Early Update – Rotation Between NASDAQ and Small Caps In Play
11:22 a.m. ET
So far this morning we are seeing the short-term theme laid out in yesterday’s Afternoon Update,
“NASDAQ has clearly been the worst performing index of the day, but it does look like some of the Tech, mega-cap, NASDAQ-100 areas are seeing some support build in on 3C charts, which may very well lead to the mini-rotation I mentioned earlier in which small caps take a breather/consolidate, while the other averages rotate in to relative strength.”
The 3C divergences in Treasury futures in last night’s Daily Wrap, are playing out as well, sending yields lower and that’s helpful in supporting the NASDAQ-100 type stocks (mega-caps, Tech, etc). Gold futures (+1.25%) are benefitting as well from the move lower in yields this morning.
Just look at the price percent change for NASDA-100 and Small Caps – EXACTLY what 3C was forecasting yesterday afternoon!
SP-500 +0.35%, Dow +0.25% (Transports -0.55%), NASDAQ-100 +1.1%, Small Caps -1.1%
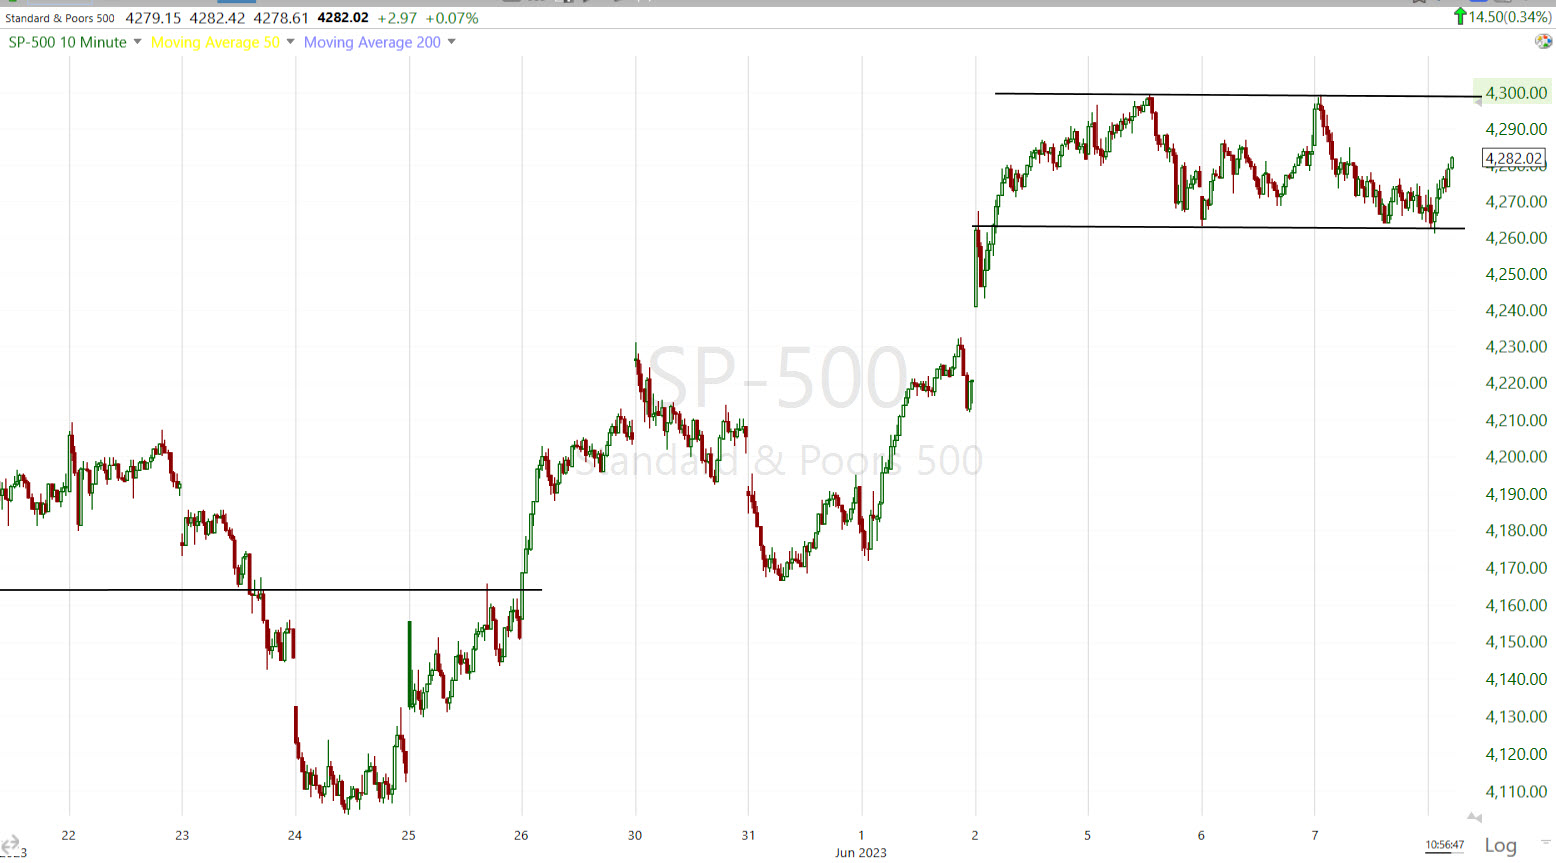 SP-500 (10m) still sits in a rectangle consolidation. It has a bullish bias, but it’s the least bullish of the bullish consolidations. It’s a short-term picture of balance between bulls/bears, but the preceding uptrend gives it a bullish bias. The S&P is less than a half percent from $4300 above, which is a key level that changes a lot. More on that below.
As for the Dow…
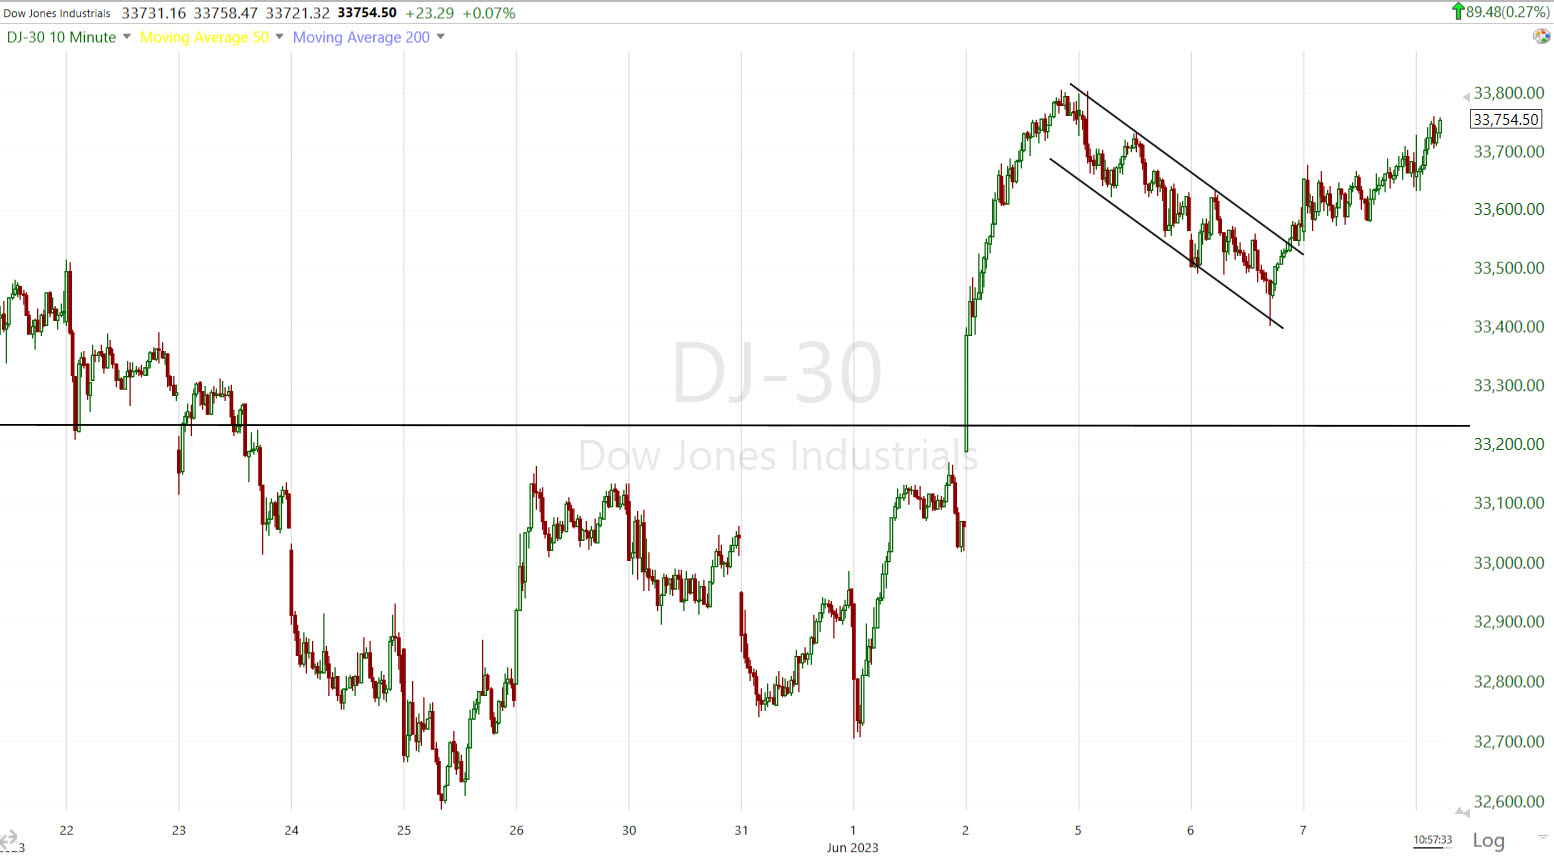 Dow (10m) as mentioned yesterday, this small bull flag broke out, but not convincingly. It has a day or two to make good on a definitive breakout and is adding some to it this morning. Otherwise it’s likely to morph into a larger consolidation pattern as there’s still a heavy zone of overhead supply/resistance just above around $33,820. Support and resistance are more often than not, areas, not exact levels, although S&P is an exception in this case.
I’m not really expecting much from the NASDAQ-100 other than the “powers that be” trying to keep prices in the area, or higher for distribution purposes.
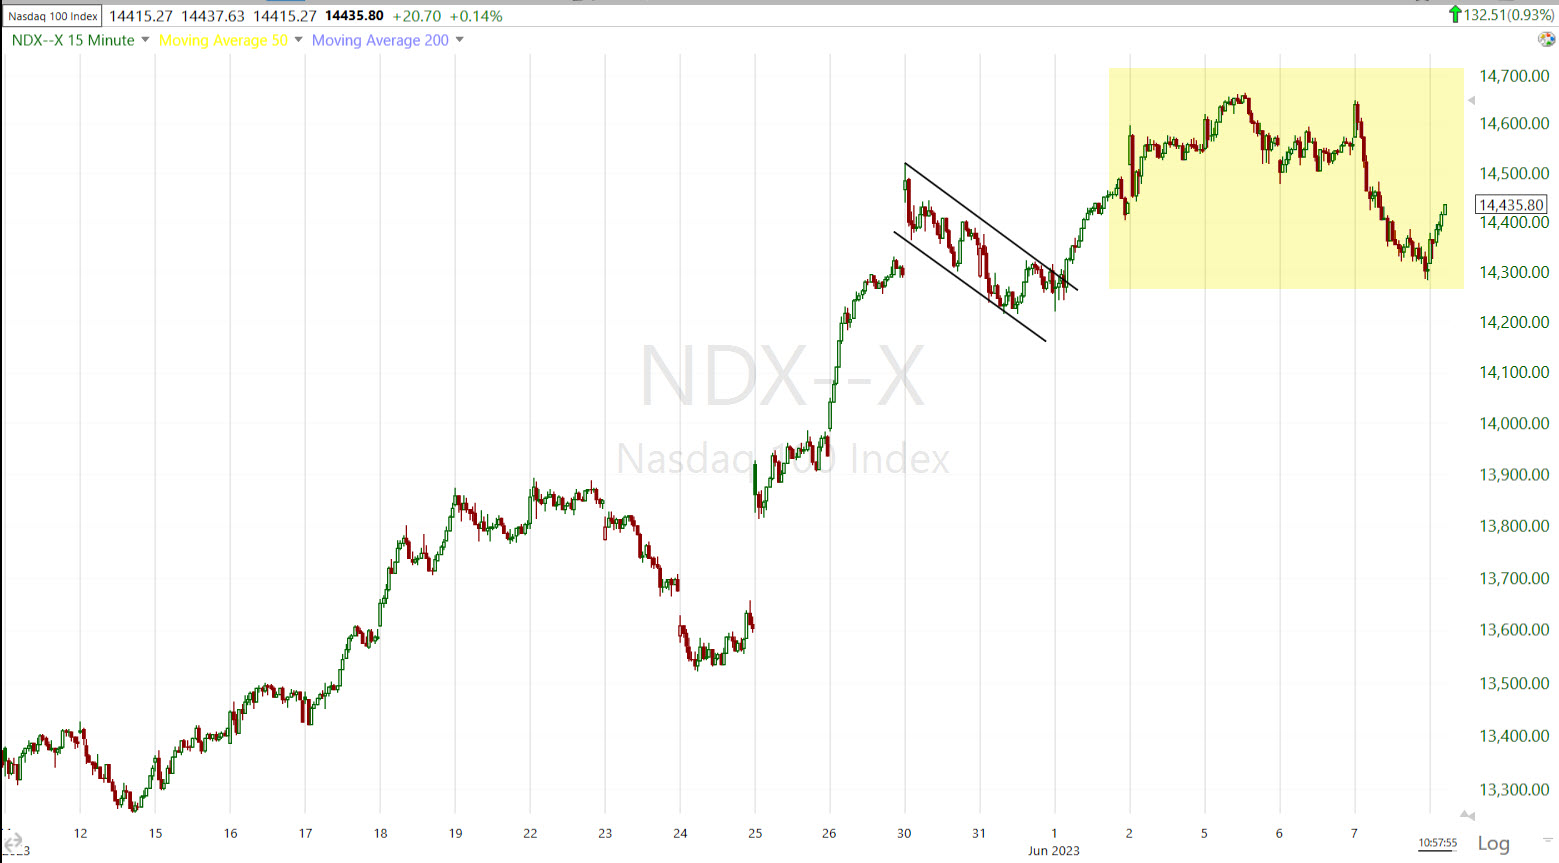 NASDAQ-100 (15m) since the last bullish consolidation (bull flag) at the end of May, I don’t see any vestiges of a bullish consolidation here (shaded yellow), unlike most of 2023 thus far. This looks more like a sloppy lateral zone typical of distribution, but prices need to be supported for that purpose and that’s what we’re getting today.
Small Caps are taking that “breather” I thought was necessary as they were getting ahead of themselves with a 5-day run of +7.75%, and what 3C was suggesting strongly yesterday afternoon.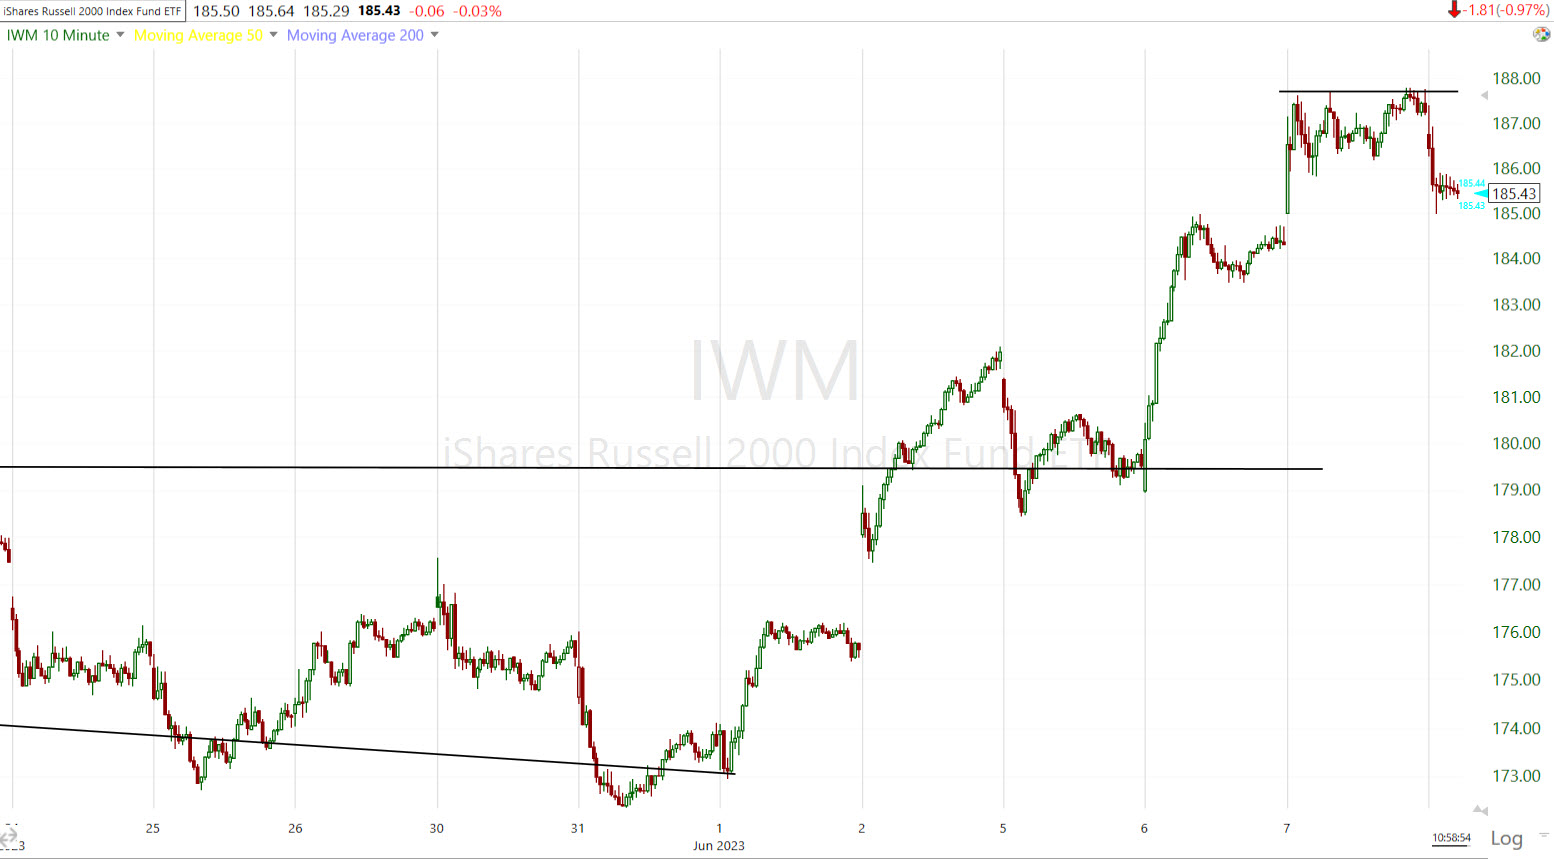 IWM (10m) – this may turn in to a correction/consolidation, but as of now, very early in the process, it’s just a pull back. Here’s a closer look…
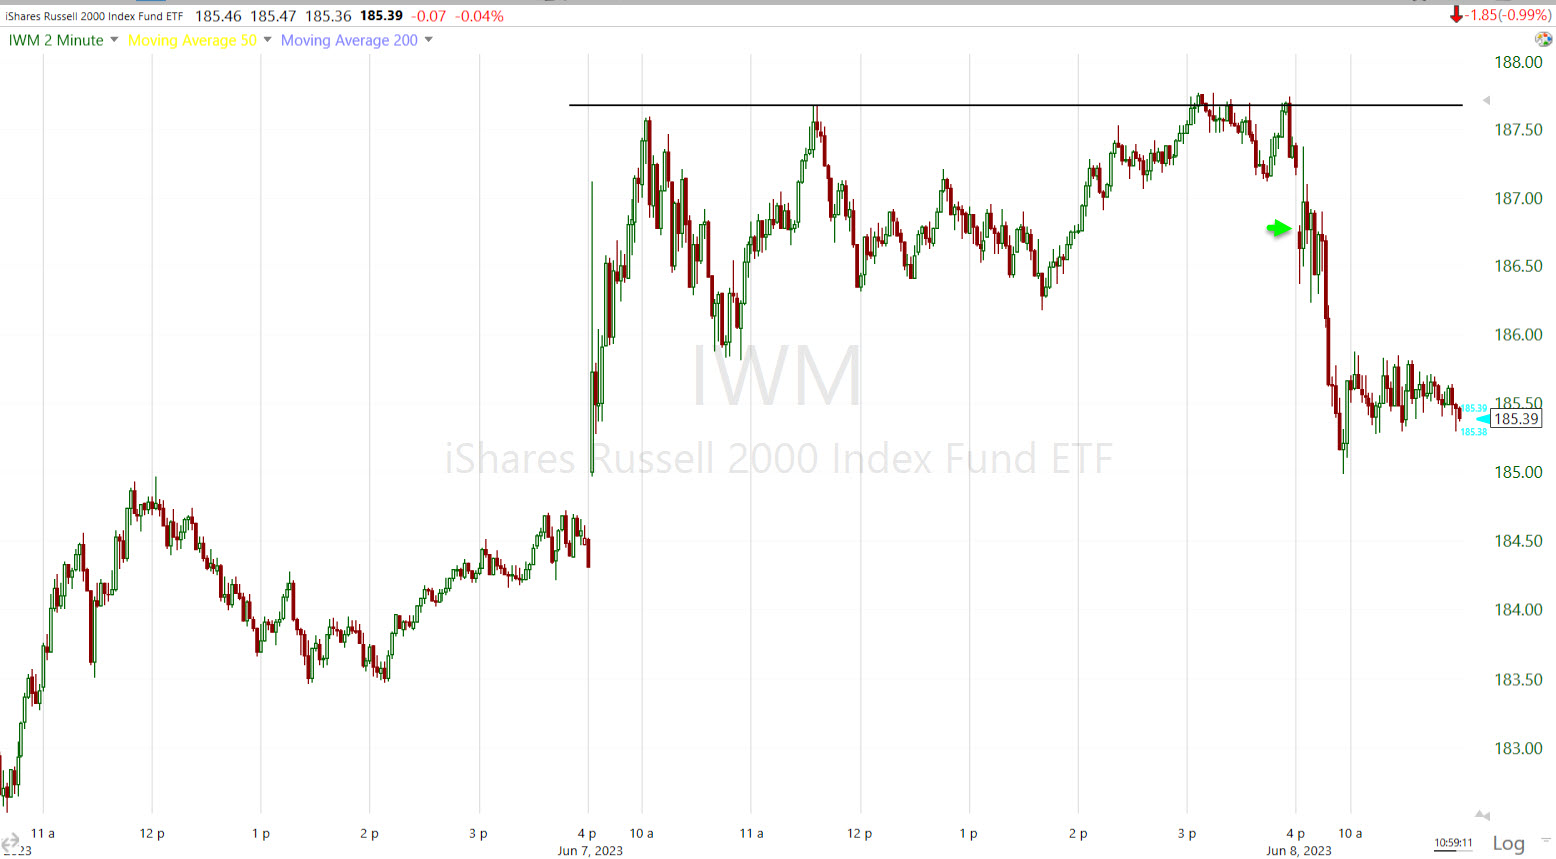 IWM (2m) with this morning’s open at the green arrow. since the initial decline we have something of a small bearish consolidation in price. We’ll keep an eye on it intraday and see if it continues to build, or starts forming a consolidation, which probabilities favor it turning out to be a bullish consolidation. Remember that breadth oscillators have been in sharply oversold territory the last couple of days.
There’s not much movement in my Most Shorted Index (which tends to affect Small Caps most) after the week of short squeezes, I don’t think the shorts have a huge appetite to jump back in on a -1% pull back in Small Caps after being brutalized in June thus far.
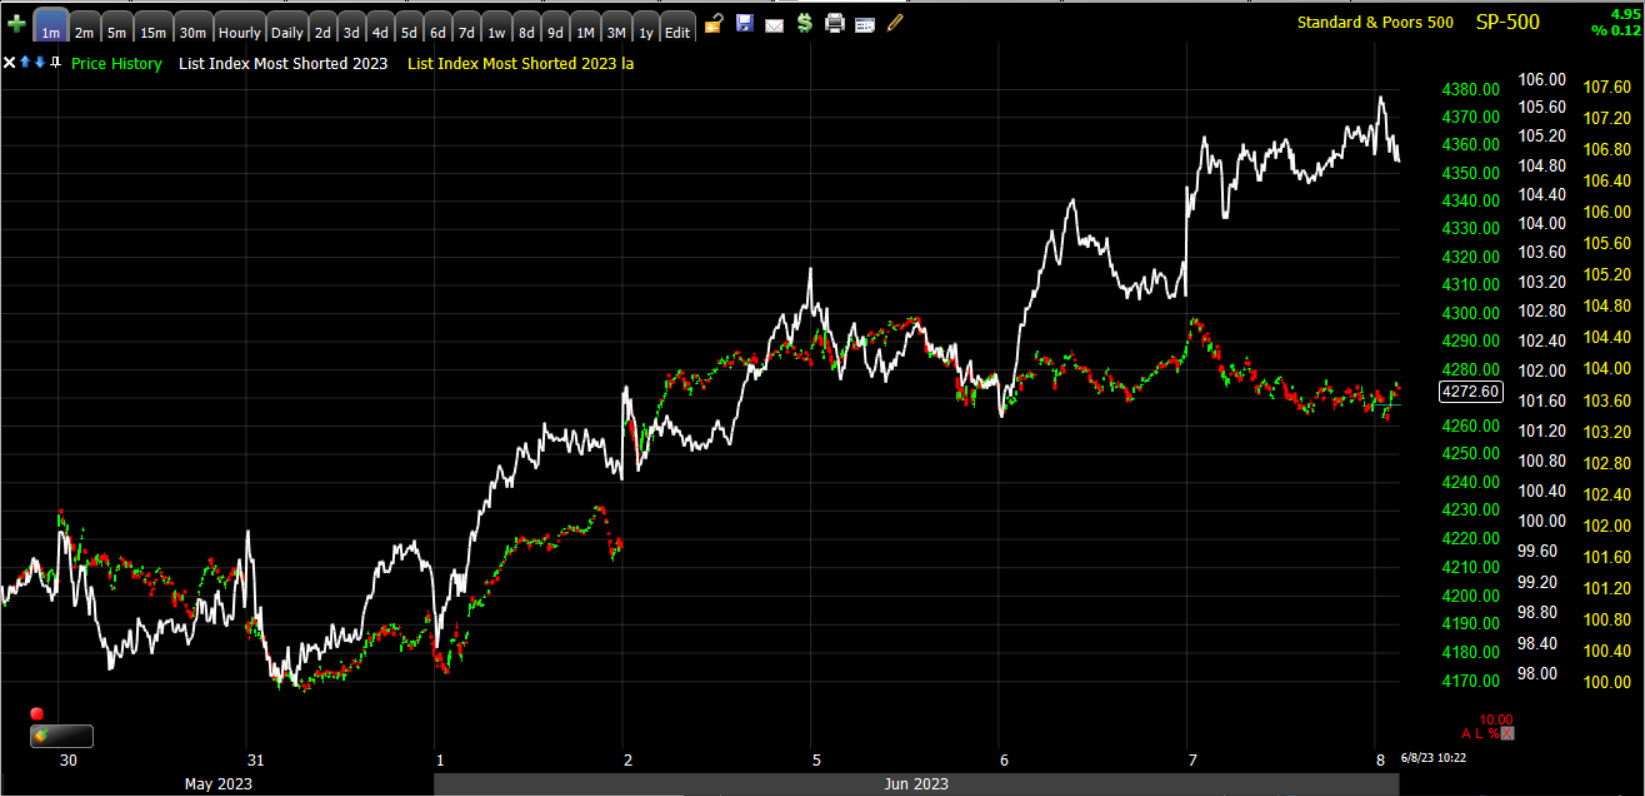 SP-500 (1m) and my most shorted index (white)
VIX is down -1.1%, trading to the lowest intraday low since February of 2020, when the market was trading what was then all time record highs just before the COVID crash. VVIX (+2.4%) is displaying some modest relative strength this morning. It’s not so much as to be a leading signal, but it keeps up, VVIX tends to lead VIX’s relative performance and that can be telling in near term moves for the market.
The Absolute Breast Index is higher at 45 and far from a high probability long volatility signal. The recent surge in the ABI has been a result of better market breadth/stock participation stemming from small Caps’ rotating into leadership for June.
5 of 11 S&P sectors are green led by all 3 of the mega-cap heavy sectors – Consumer Discretionary (+1.6%), Technology (+0.85%) and Communications (+0.6%) – followed by a bond proxy and defensively oriented sector that are benefitting from the decline in yields (Health Care and Consumer Staples). Real Estate is the worst performing sector (-1%), followed by all of the cyclical sectors that have led all week, each in the red from -0.15% to -0.9%.
The mega-cap index (MGK +1.05%) that underperformed the S&P Equal Weight Index (-0.35%) by a massive 240 basis points yesterday, has an 140 basis point edge this morning as we get the short term rotation from small caps to mega-caps expected yesterday afternoon.
Regional Banks (-2.7%) are getting a decent pull back after gaining +14.4% over the prior 5 days. Likewise, the Retail sector (-0.65%) is starting a correction around its 50-day sma after an +8.5% gain over the prior 5 days.
NASDAQ-100’s A/D line is showing modest improvement this morning, while the broader NASDAQ composite and NYSE’s are pulling back with Small Caps. The breadth oscillators that hit extreme overbought at 98 yesterday (scale 0 to 100), are down to 88 this morning, which is still overbought territory, just not extreme.
The 2 and 10-year yields are down -4 bp each, which was a helpful condition in the mega-caps rotating in today.
High yield Credit (HYG +0.4%) is displaying some very slight better relative performance. That too is a result of lower Treasury yields this morning. The big picture outlook, and the short term outlook as far as a signaling mechanism, haven’t changed with this morning’s small move.
The U.S. Dollar index is down -0.65% after the weak U.S. initial claims further weighed on it and US TSY yields.
WTI Crude oil is down -1%, I haven’t checked the specific news, but it wouldn’t be surprising if it were down due to the weaker Initial claims (concerns about recession).
Gold futures jumped higher on Initial claims and the drop in the Dollar and yields, now up +1.25% to $1982.40/oz, but $2k is still a key level gold needs to take out.
Bitcoin futures are up near +0.5% at $26,735, as you know, I feel they loiter around $27k for a while longer.
Remember my warning not to get sucked into the narrative that the June outperformance of small caps is a sign the economy is improving and will have a soft landing from the Fed’s rate hikes. This was the narrative Goldman Sachs was peddling yesterday and I’d trust GS about as much as I’d trust Robinhood not to sell order-flow, actually I trust GS less. This morning’s Initial Claims is just the latest data that argues against this narrative.
Initial claims, which are a leading indicator – or at least a far better leading indicator than the unemployment rate – hit their highest level since November 2021, and the biggest week-over-week rise since July 2021. That data is actually helpful in the NASDAQ-100’s rotation into leadership over small caps, and the latter’s correction today.
In Europe, things are already “worse” than thought. According to the latest data revisions by European statistics agency Eurostat, the euro zone economy was in a technical recession in the first three months of 2023, after downward revisions of growth in both the first quarter and the final quarter of 2022. Surprise, surprise!
As far as the 3C charts that gave us the head’s up yesterday afternoon of this morning’s rotation favoring mega-caps over small caps, this is actually an important tactical development in the scheme of things I’ve been expecting to materialize in June – namely institutional distribution, and that’s going to be seen most notably in the stocks that gained the most YTD for 2023 – the mega-caps. The most important of them – and the most important stock for the market, Apple (AAPL +0.7%), had a bear flag that was just breaking down yesterday. Had that bear flag met its second leg downside measured move it would have broken an up trend from early March and traders/investors would have noticed that.
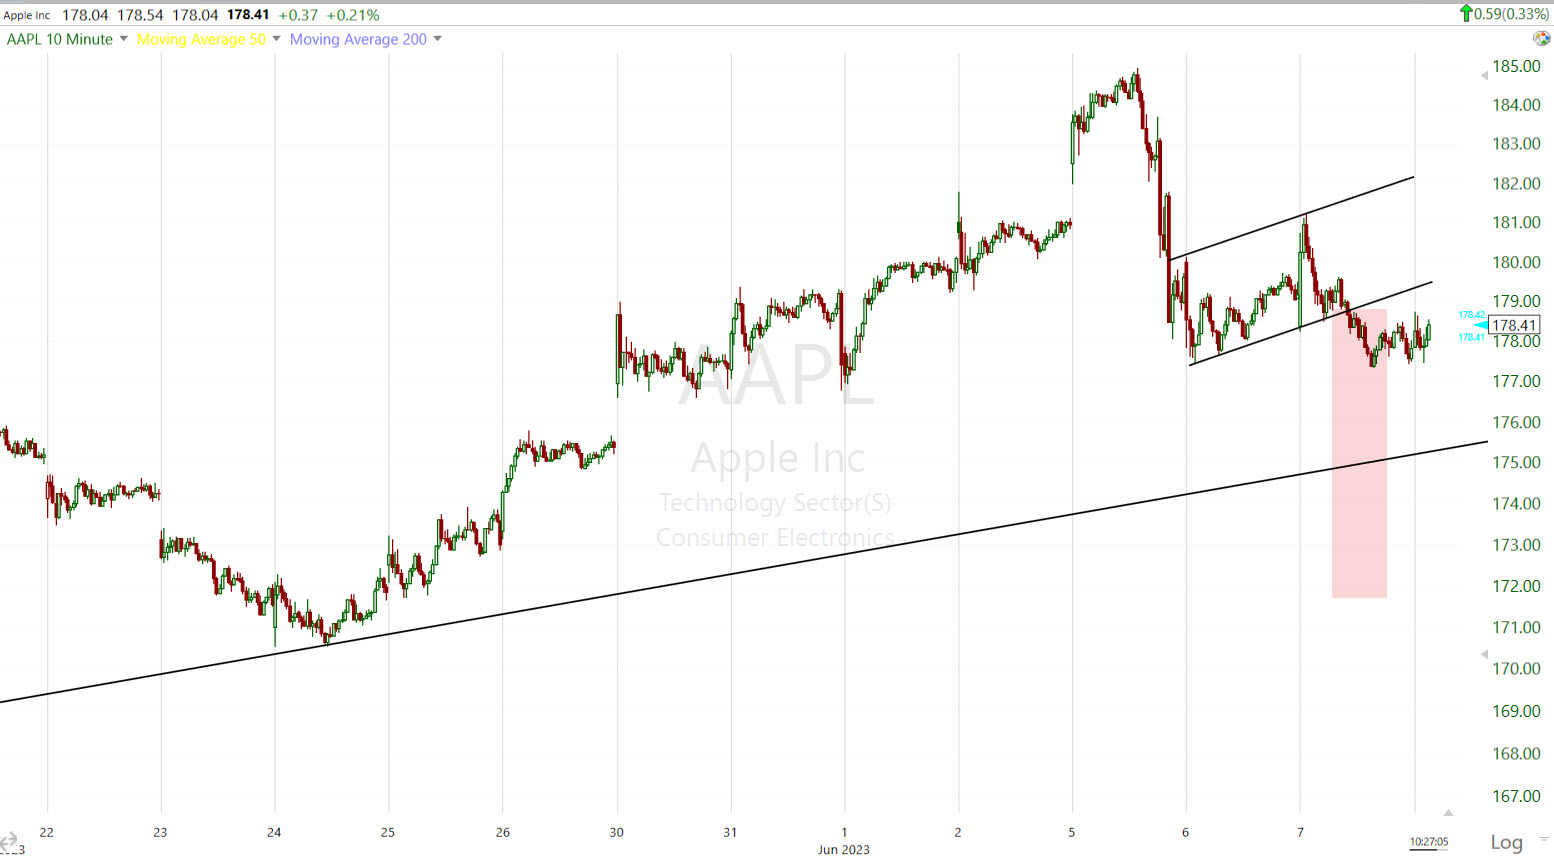
AAPL (10m) with it’s recent bear flag that developed after an outside day/distribution day on the heaviest downside volume (excluding options expiration) of the year on Monday, June 5th, was set for a measured move (shaded red) that would have broken that trend line – and that would be noticed. So it’s not too surprising that Apple was one of the first placed I saw 3C positively diverging yesterday afternoon to prevent that from happening, at least this early in the month.
That positive divergence in apple continues this morning. And as such, keep Apple’s price trend looking non-threatening.
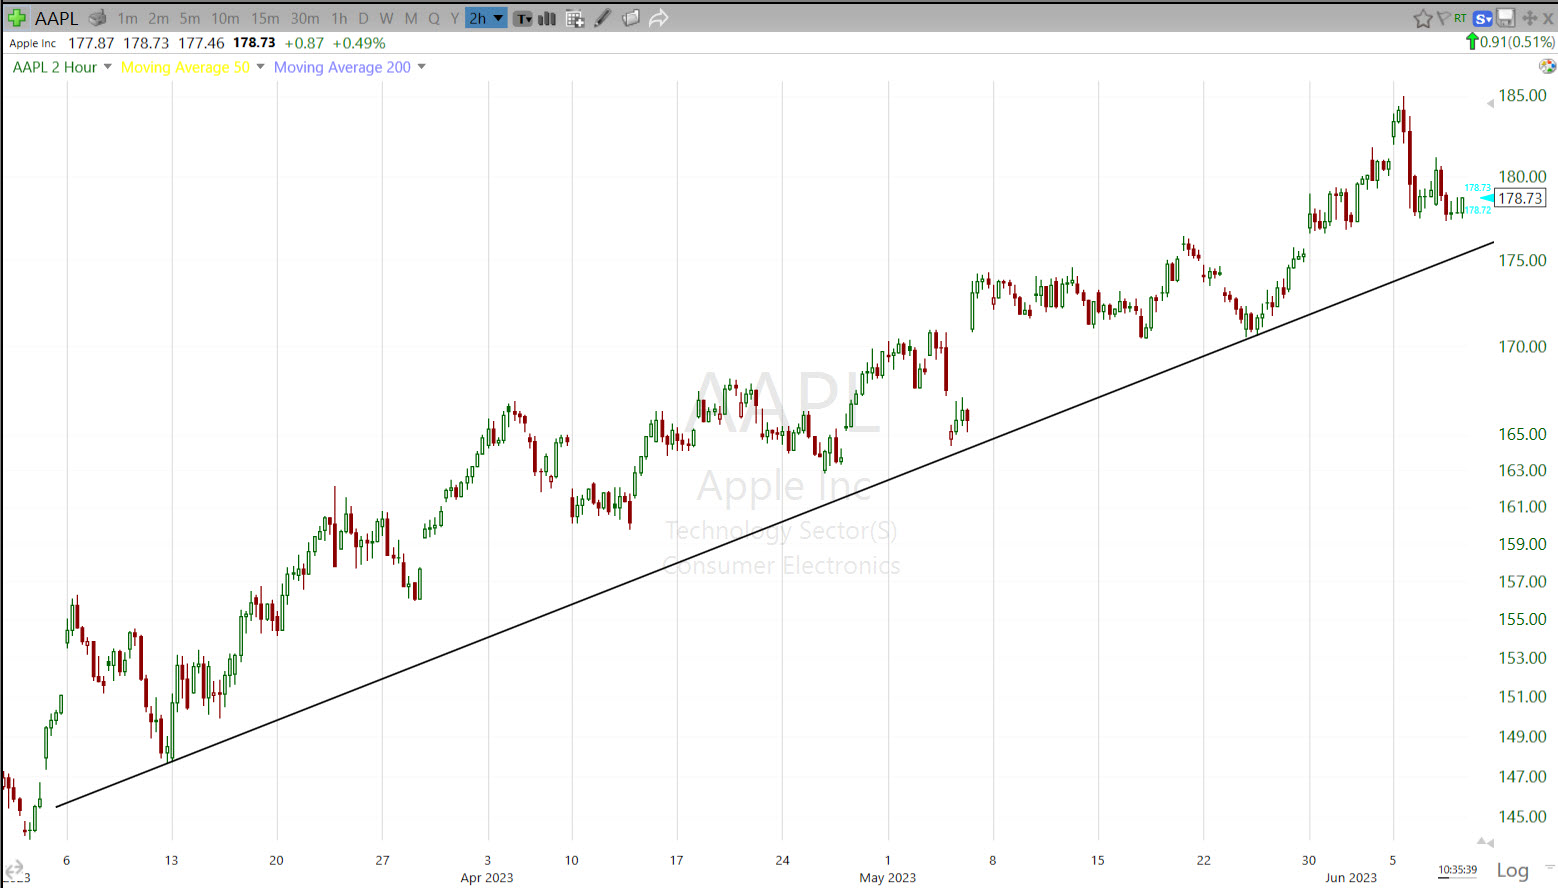 AAPL (2H) solid up trend.
You have to keep in mind the reasons behind supporting the mega-caps within the context of institutional distribution which is quiet and under the radar, not usually showing up at the index level until they’re done. At the risk of sounding repetitive, and proving what may not be my finest analogy,
” a fisherman sometimes has to let out some line and let the fish run and tire itself out before they can land it. With regard to distribution, institutional positions are so large they can’t just place a sell order for a position like most of us can without moving price against their order/position. They need demand to absorb their massive supply so they can slowly feed out their shares until they’re done and out of the position. Just like the fisherman who has to let out a little line to accomplish their goal of landing the fish, sometimes institutional money, market makers, etc, have to provide some support to keep prices from collapsing before they’re done distributing their shares.”
And that’s what I believe we were seeing in apple yesterday, as well as some other mega-cap/Tech related issues, and Small Caps looking ready for a needed correction/consolidation in the meantime.
SPY’s short term 3C chart looks good as it consolidates under $4300, a level that once it crosses, likely triggers short covering in a historic non-commercial net spec short position (e.g.- hedge funds). Small Caps aren’t going to push the S&P above $4300, but mega-caps can and the S&P only needs a little support from them to make the additional half percent gain to $4300.
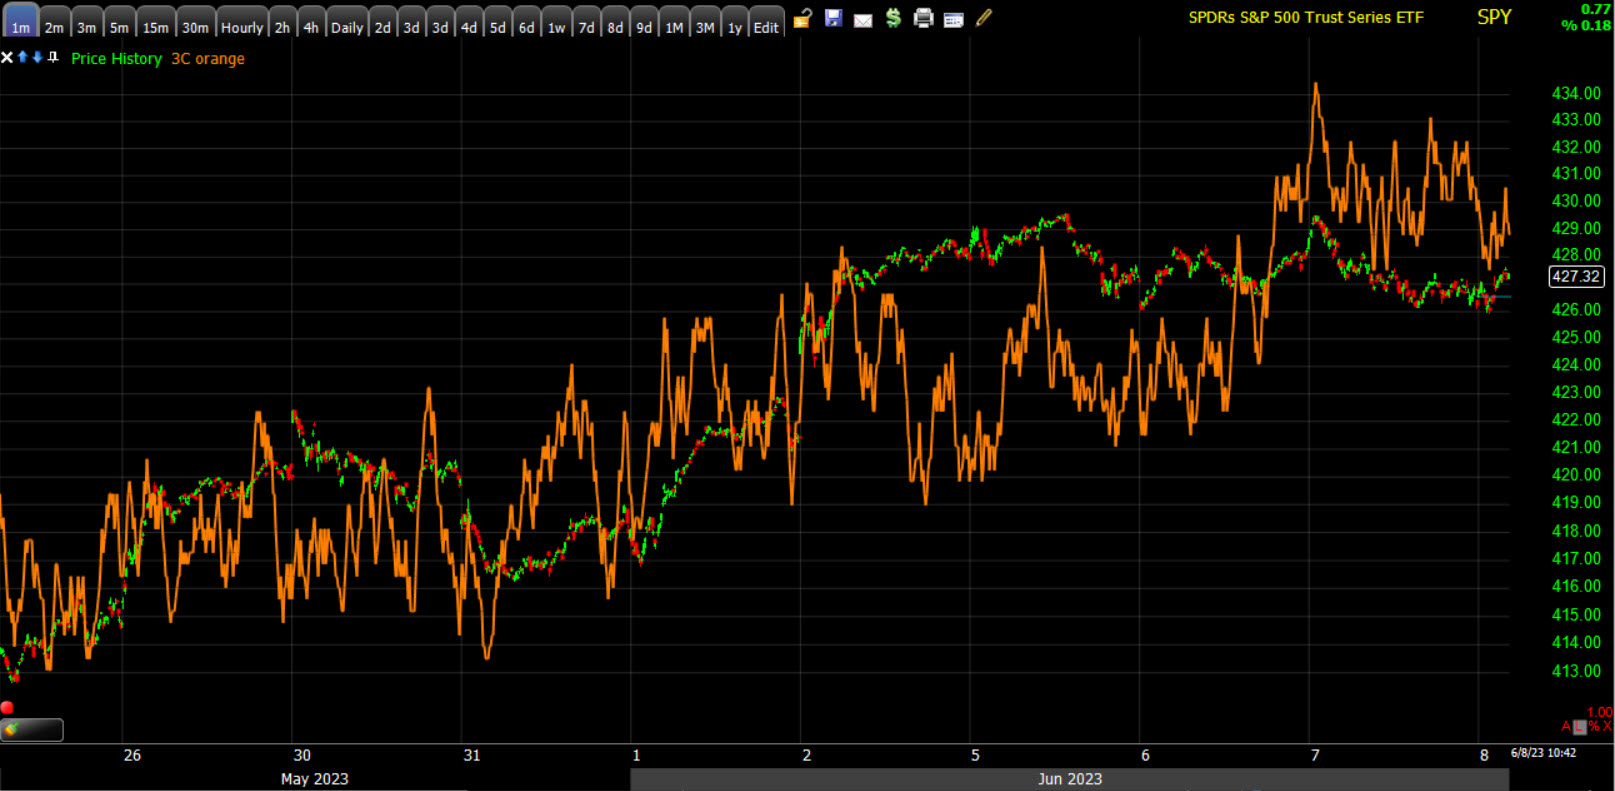
SP-500 (1m) 3C is still short term constructive. The short squeeze of ES shorts further enhances the demand institutional money needs to sell into.
As covered yesterday, IWM’s short term 3C chart doesn’t signal much more than a correction, but it has not been confirming higher prices as price momentum slowed yesterday. We have that correction underway this morning.
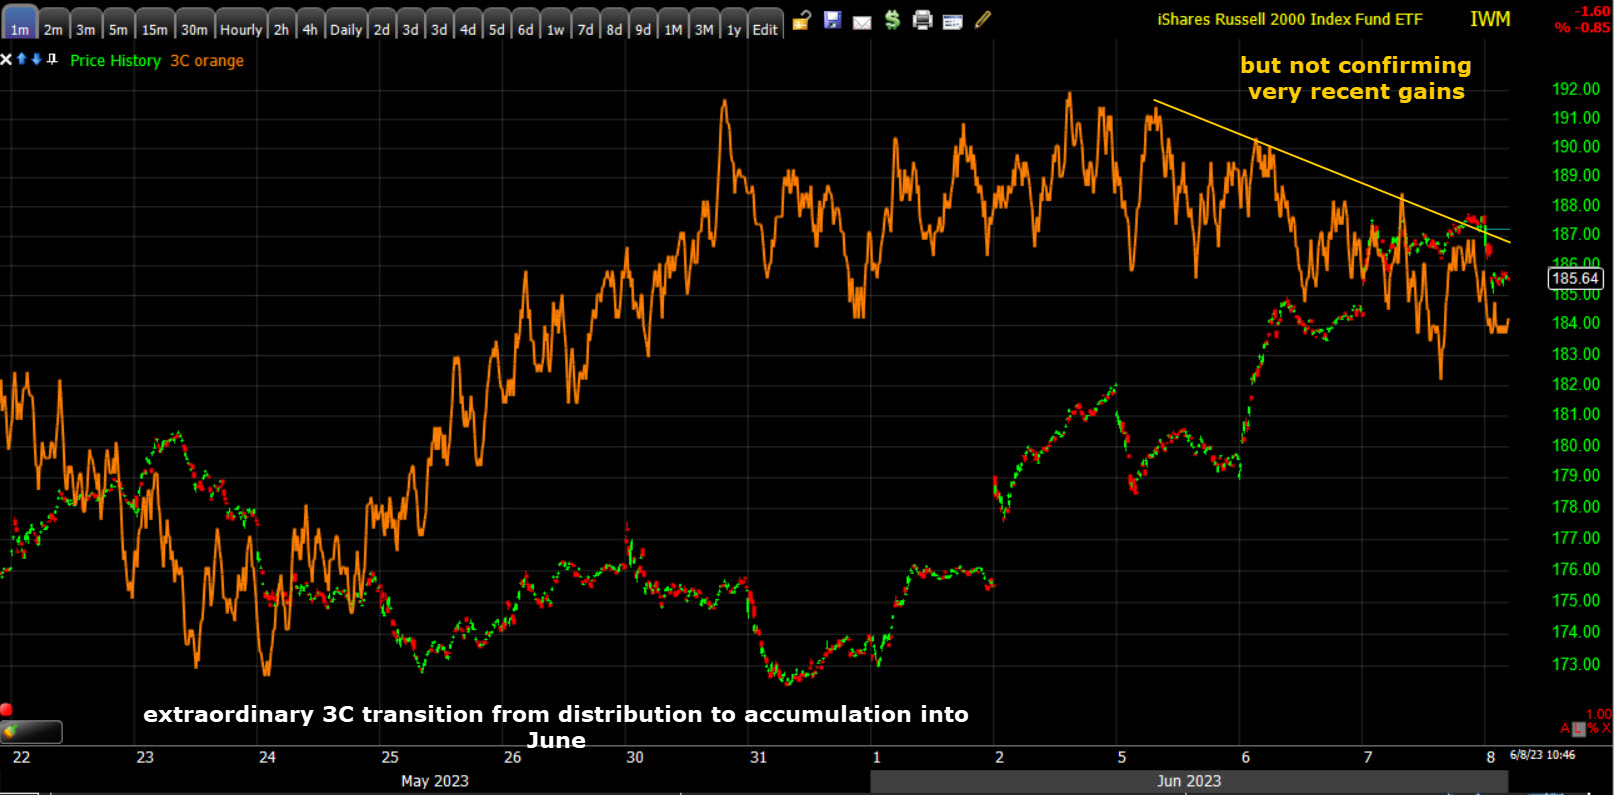 IWM (1m)
And…
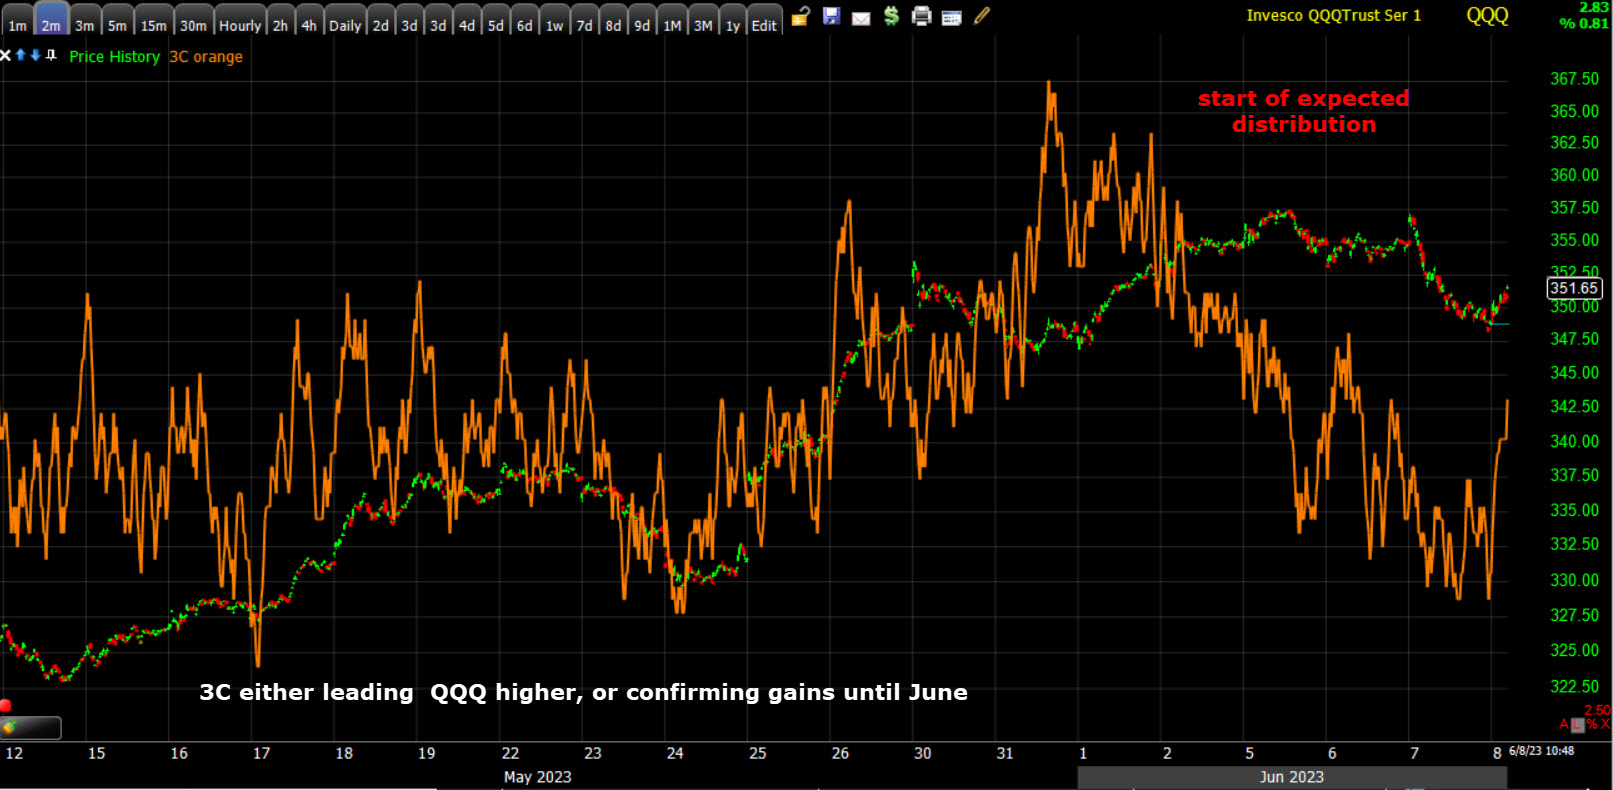 QQQ (2m) this is a stronger, more influential timeframe than the shorter ones above, meant to uncover more of the trend. You can see NASDAQ-100/QQQ’s 3C chart was looking excellent, either leading prices higher or confirming gains right into June, when we start seeing 3C negatively diverge. This is exactly the scenario I’ve been laying out in my 3 Market Phases and more specifically, the transition from Phase I rally that front ran the Fed’s peak policy hawkishness (and peak inflation), a rally that started in October and is going on its 8th month, to the Phase II transition – the market focusing on recession as the Fed’s policy lag catches up and the 525 basis points of rate hikes, that have not been felt in the real economy, start to do so in full force in the second half of this year, which begins at the end of this month. This is why I’ve seen June as the most probable transition point (distribution of the rally’s gains).