End of Day Stock Market Wrap-Up
Today’s trade started on a mixed note. Early on we got the exact scenario suspected last night with Small Caps and Transports initially bouncing, while mega-caps and NASDAQ-100 lagged even though yields were modestly lower. Then rates trended higher in response to the ISM Services PMI at 10:00 a.m. ET. Mega-caps and NASDAQ-100 still lagged on the day as expected.
The ISM Services PMI jumped to 54.5% from 52.7% and the Prices Index rose to 58.9% from 56.8%. That is a combination that will support the market’s thinking that the Fed will leave rates higher for longer. Both Services data sets this morning are considered “soft” or “survey” data as opposed to hard data. There is an interesting phenomena in that ‘Soft’ (survey) data jumped to its strongest since January 2022 today, while ‘hard’ data fell to its weakest since May 2023. The general theme is that the survey data shows inflation in prices rebounding, while hard data shows economic growth weakening, a scenario known as “Stagflation” (inflation with stagnating growth).
Another jump in oil prices (+1.2% to $87.57/bbl) contributed to the negative bias. Higher oil and elevated gas prices have stirred concerns about a slowdown in discretionary spending. Several airlines warned today about rising jet fuel costs.
Apple (AAPL -3.6%) took a decent size loss following headlines that China banned government officials from using Apple devices, according to The Wall Street Journal, and the EU Commission designated Apple as one of six “gatekeepers,” which will place it under a regulatory microscope.
Averages
The major indices were able to climb off their worst levels in afternoon trade, but still registered decent losses. The NASDAQ-100 held above its 50-day sma all day. The S&P closed about two-tenths of a percent below its 50-day. Dow Transports (-0.75%) were pretty much in line with everything else, but we have what I think is the first Head and Shoulders neckline break.
S&P-500 ⇩ -0.88 %
NASDAQ ⇩ -0.88 %
DOW JONES ⇩ -0.57 %
RUSSELL 2000 ⇩ -0.33 %
Looking at the intraday/closing price action, I’m going to revise my thoughts for tomorrow.
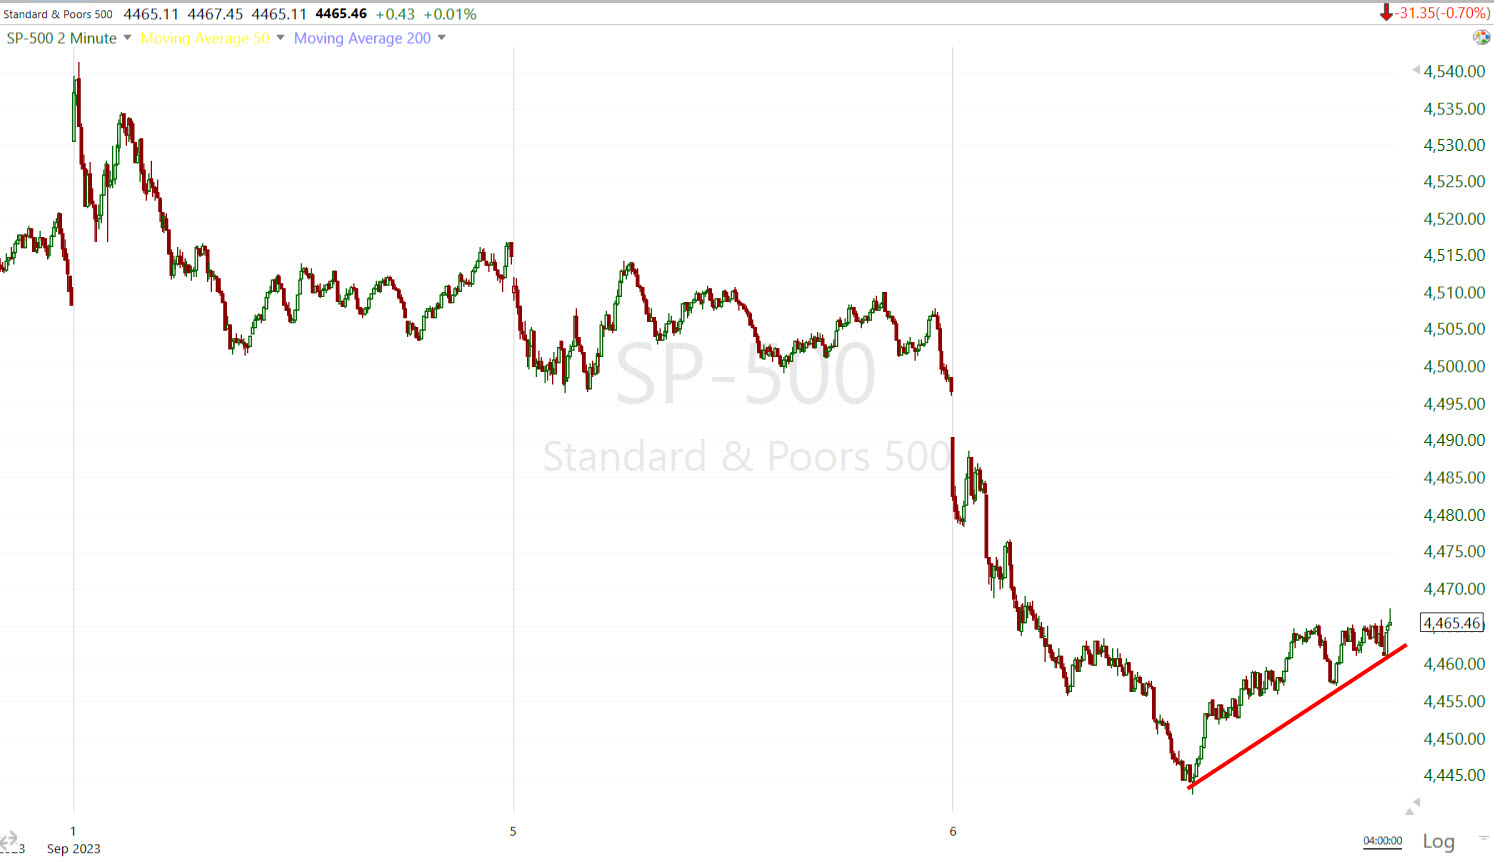 SP-500 (2m) – this looks like a small bear flag. I suspect price will be modestly higher tomorrow, but I think this small bear flag will expand in size to a larger bear flag. I’ve seen this happen so many times and it always starts like this.
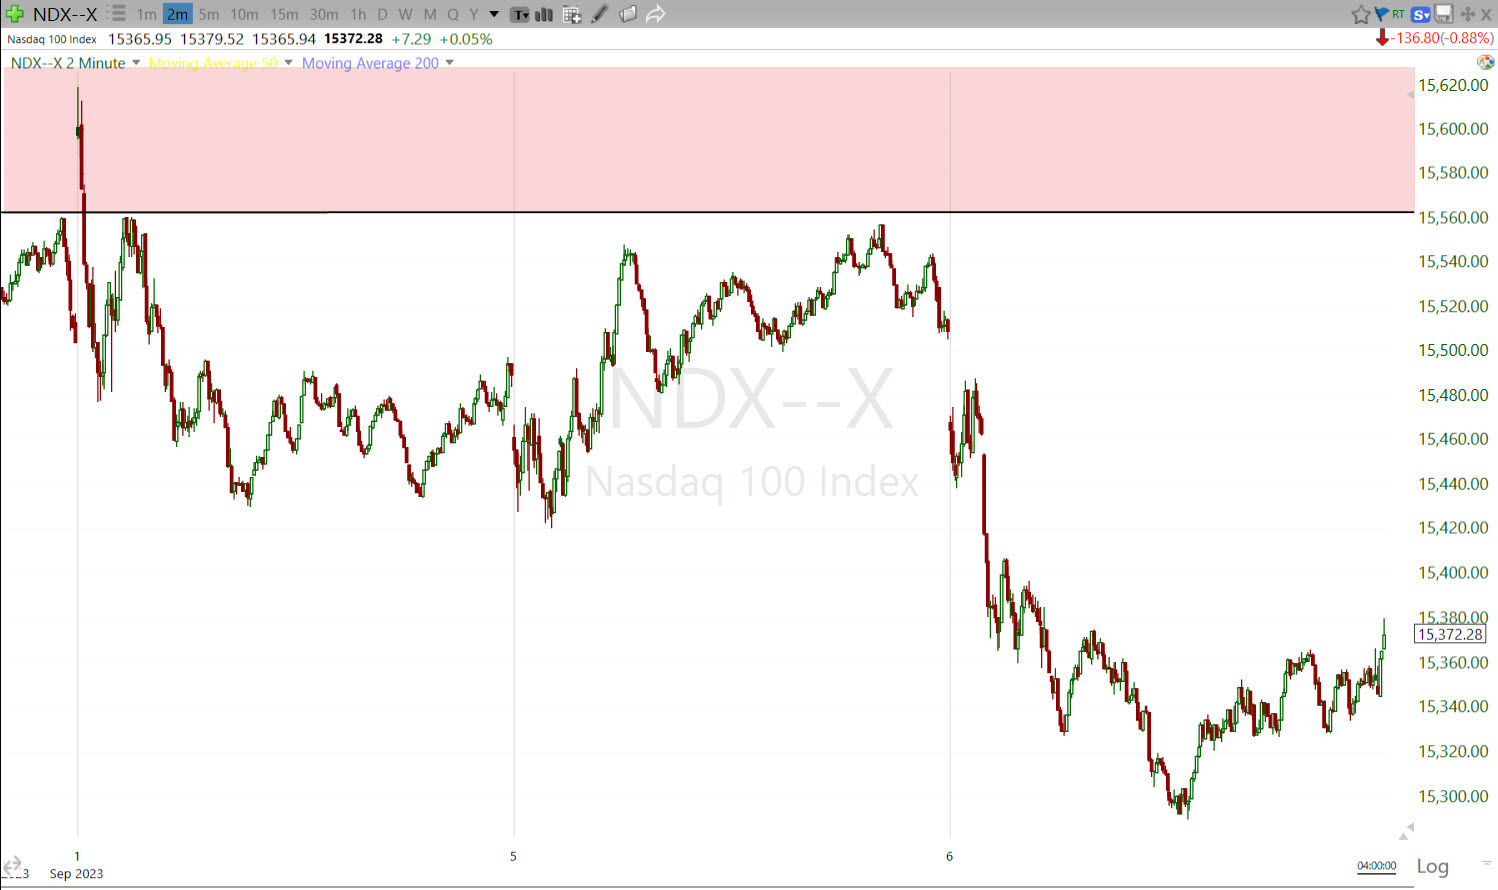
NASDAQ-100 (2m) has the same look. The red area above is the break away gap that it hasn’t been able to fill, which is a very bearish development so long as that gap remains open, especially in the context of a topping pattern.
The Dow and Small Caps have essentially the same small intraday flags.
Here’s what appears to be the first break of a H&S neck line…
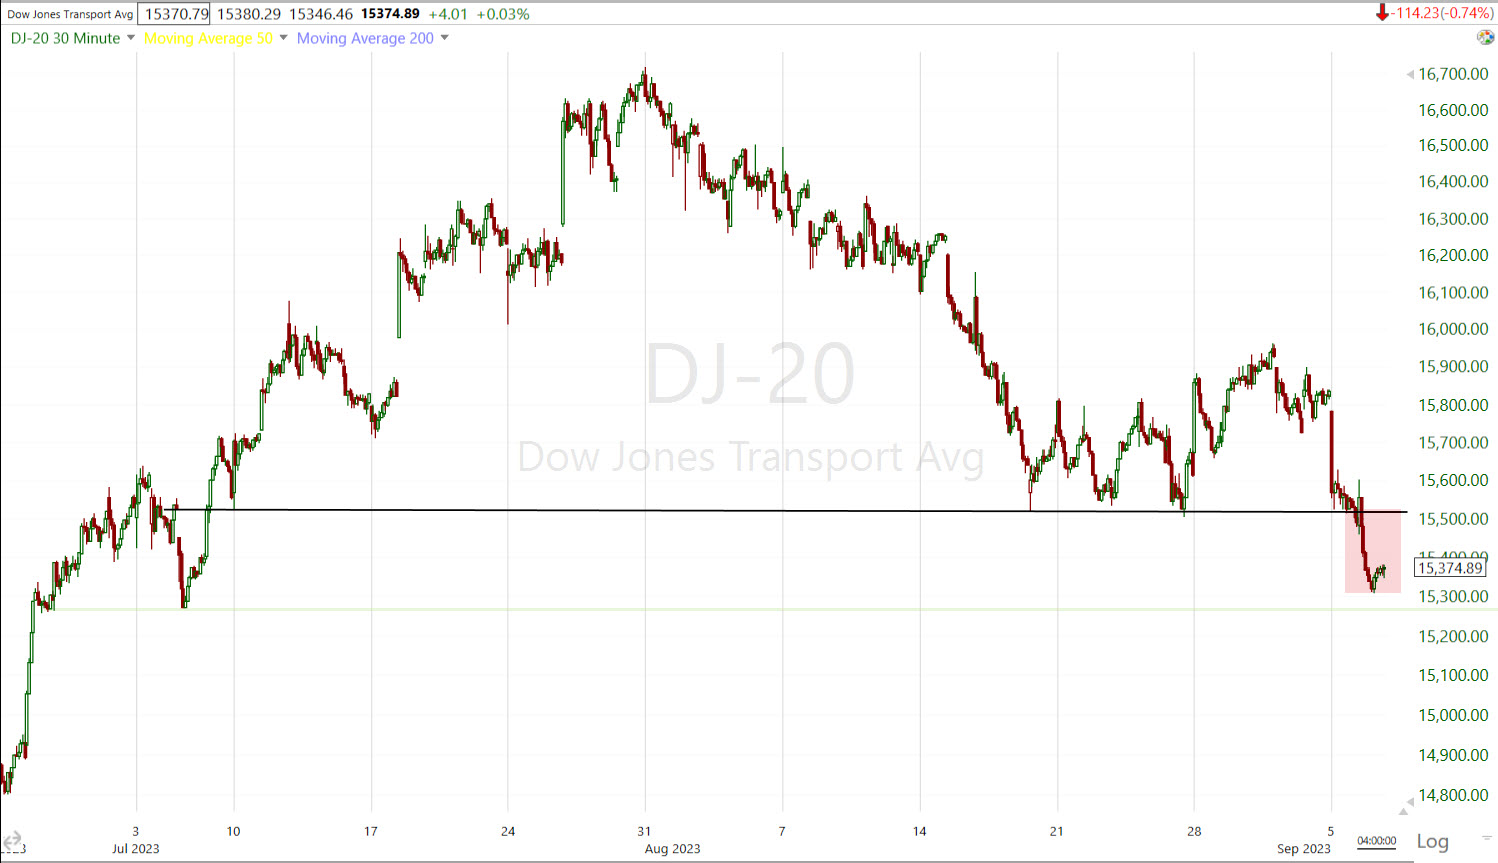 Dow Transports (30m) – price will probably find some temporary support just below at the $15,270 area, but this does appear to be the first average to break a head and shoulders neck line. Volume confirmation is important though…
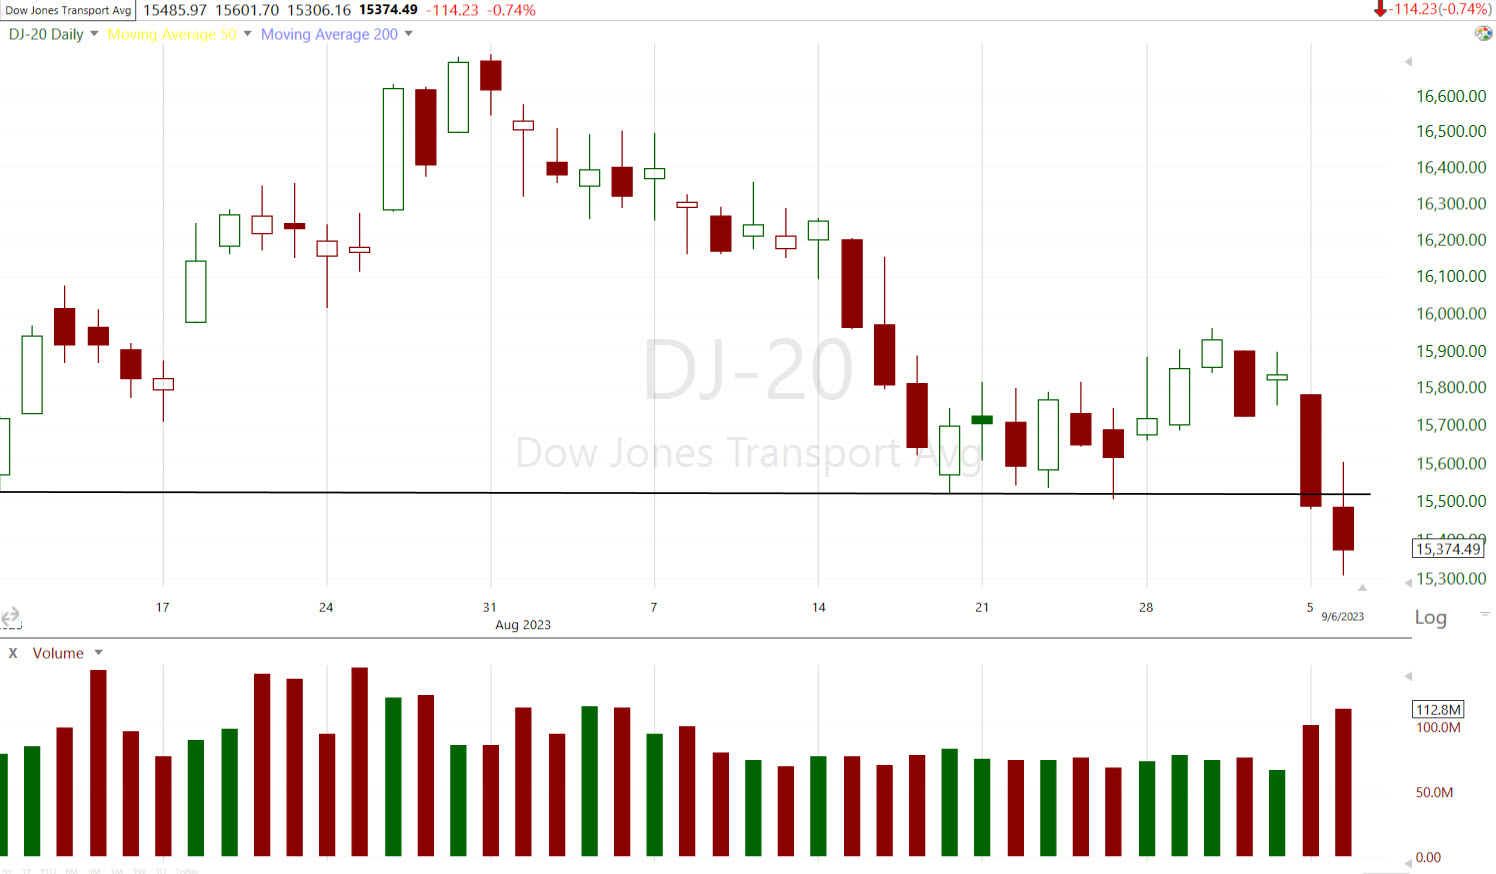 Dow Transports (daily) And there it is – Heavier volume on the break of the neckline EXACTLY as it should be, despite the broader market having lower volume today.
VIX (+3.15%) looks completely unremarkable as far as leading signals. VVIX (+1.65%), however, does appear to be building a newly emerging trend of relative strength and its relative strength trends tend to lead VIX’s, suggesting that if it continues, we’re going to see a more volatile market and that would fit with the notion of H&S tops breaking neck lines.
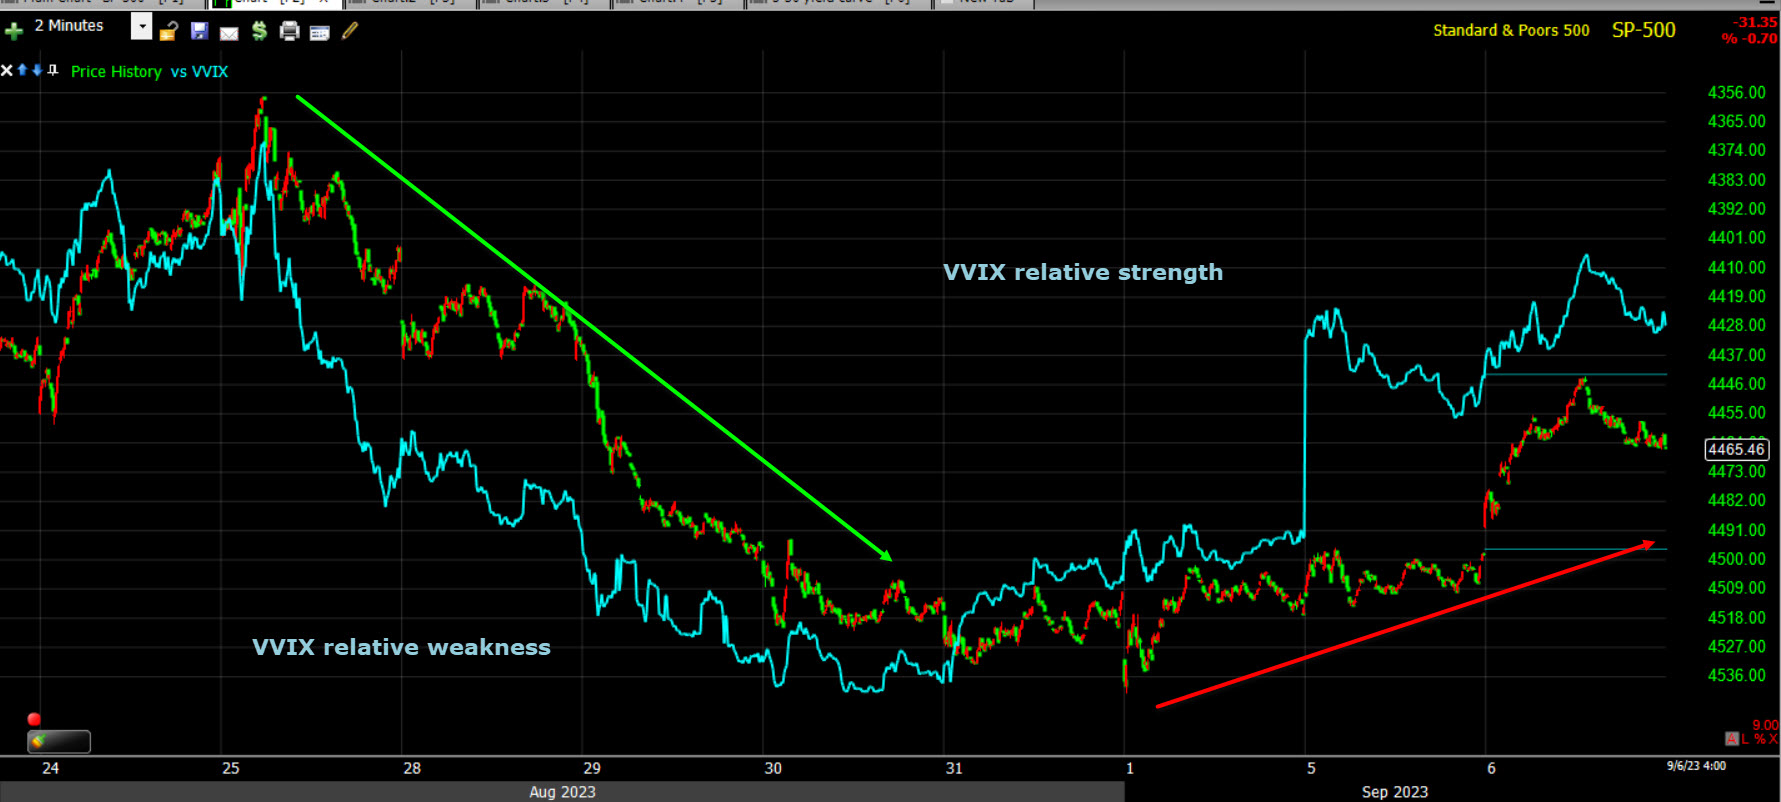 SP-500 (2m) with price inverted for easier comparison and VVIX (blue). We can see VVIS’s relative weakness as the averages rallied into last week, and now VVIS building relative strength as the averages are coming down off last week’s right shoulder highs.
I’m not excited about long volatility trades yet, but it does make sense to hedge if you have a long portfolio that needs to be hedged as volatility is low. I will say that as the S&P appears to be topping, VIX appears to be bottoming -although it should be noted that volatility is not a trending asset the way stocks and other risk assets are, it’s more of a sporadic mover. Still, if price does dip into the $13 to $13.50 area, I will be taking a closer look at whether any long vol. trades make sense.
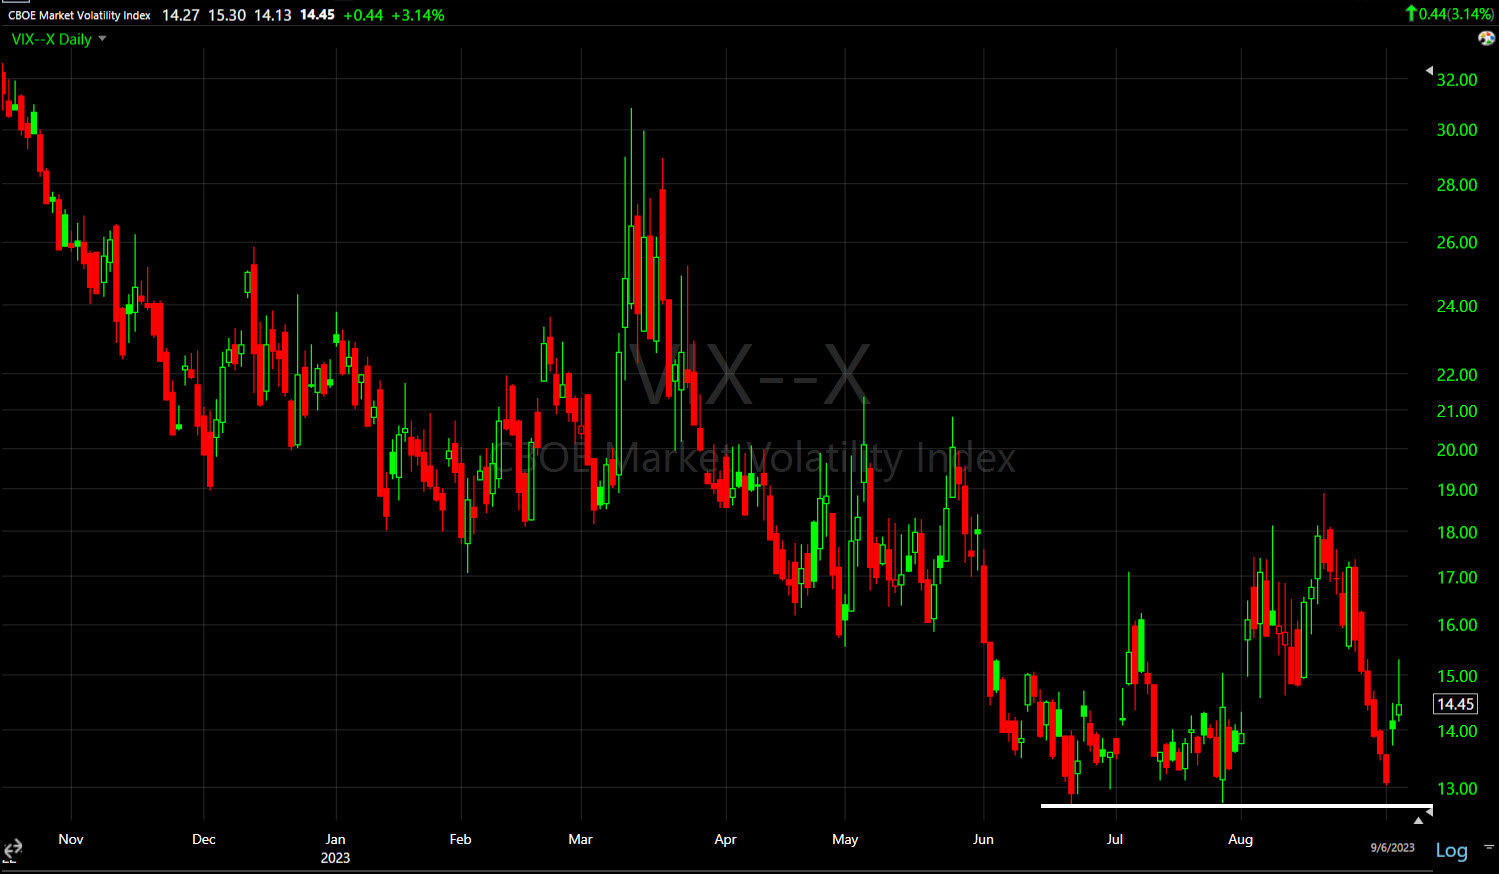
VIX (daily)
One of my most effective and reliable trading signals is the Absolute Breadth Index with a close below 14, then going long volatility. I’d say the signals are probably somewhere around 90+% positive with an average gain of 50% in VIX over the next 1-day to 30 days, but I’ve seen moves on these signals nearing +450%. A lot of you want updates on the ABI and that’s why I include them every day because in 2021, in a bull market, we had a number of reliable signals. I’d guess maybe 6 that year and then 2 or 3 the first quarter of 2022 as the stock market entered a bear market. While we’ve gotten within a point or so of a signal, we have not had a single signal since Q1 of last year. Historically though 2021 was an outlier. I’ve observed that on average this signal fires once or so a year, but it is very high probability.
The Absolute Breadth Index ended at 32, down from 40 last week.
S&P sectors
Nine of the 11 S&P 500 sectors closed with a loss. The Technology sector had the largest decline by a decent margin, weighed down by Apple. then the mega-cap heavy Consumer Discretionary sector. The defensive Utilities and cyclical Energy sectors closed at the top of the leaderboard.
The mega-caps (MGK) fell -1.2%, underperforming the S&P 500 Equal Weight Index (-0.3%) by 90 basis points. Other growth stocks were noticeably weak too, pressured by the rise in yields. The Russell 3000 Growth Index fell -0.9% versus a -0.3% loss in the Russell 3000 Value Index.
Semiconductors (SOX Index -0.8%) held up better than the Tech sector (Apple), but Nvidia (NVDA -3.1%) was a notable laggard in the group.
Regional Banks (-2.3%) were an area of relative weakness and broke below the bear flag. This post earlier today was dedicated to Regional Banks and has the potential scenarios in the very near term as well as the downside measured move targets.
Materials ⇩ -0.22 %
Energy ⇧ 0.04 %
Financials ⇩ -0.06 %
Industrial ⇩ -0.43 %
Technology ⇩ -1.06 %
Consumer Staples ⇩ -0.11 %
Utilities ⇧ 0.23 %
Health Care ⇩ -0.54 %
Consumer Discretionary ⇩ -0.89 %
Real Estate ⇩ -0.19 %
Communications ⇩ -0.31 %
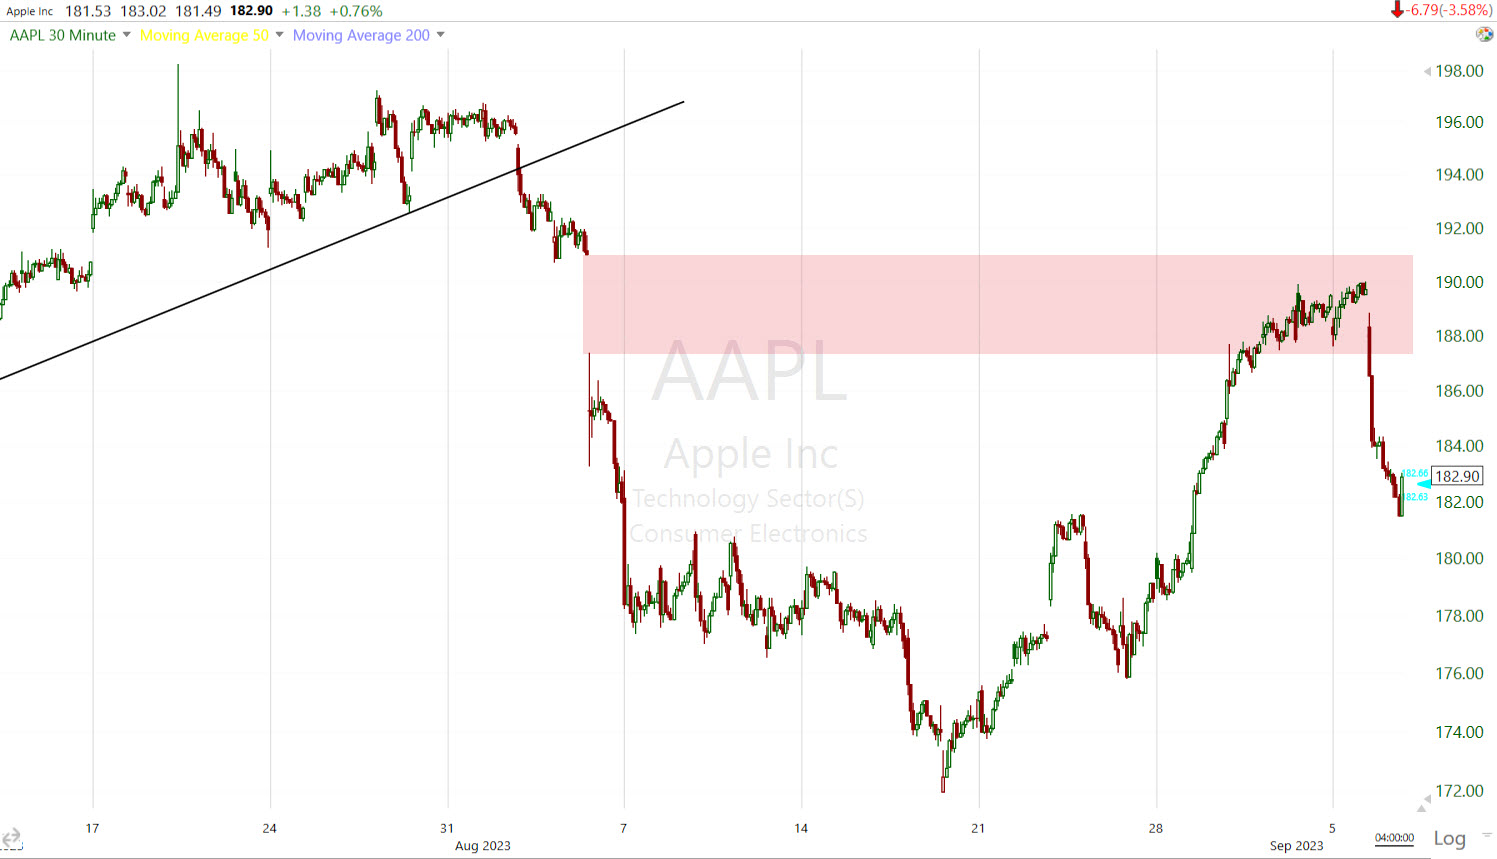 Here’s Apple’s (30m) plunge today. Recall that Apple was the first place 3C showed distribution in mid-June, then the up trend break to the left and break away gap lower. Apple failed to fill that gap.
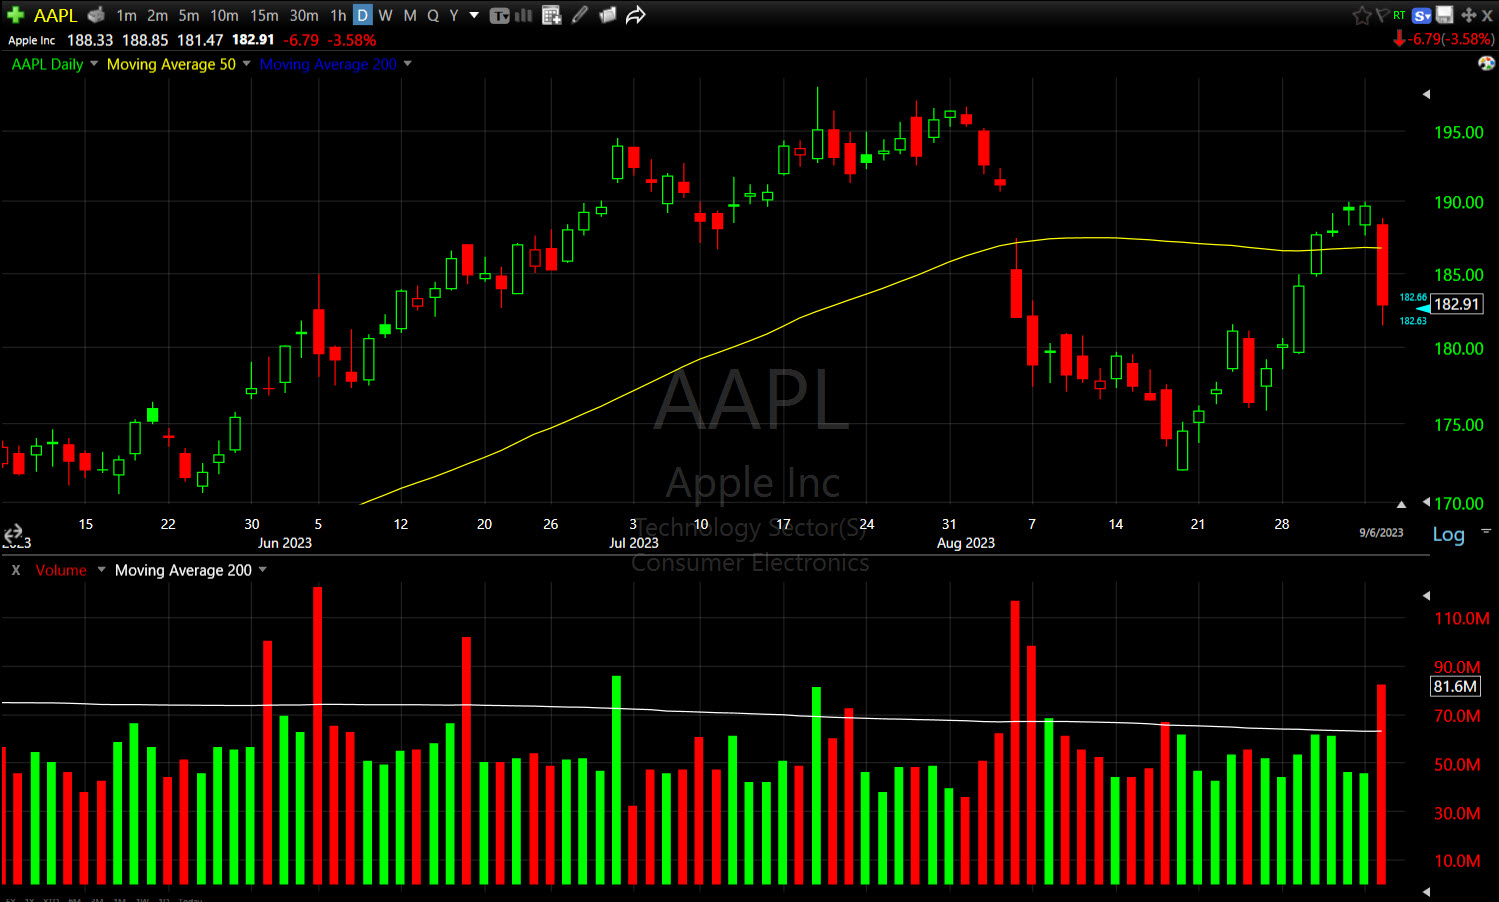 AAPL (daily) also cracked its 50-day sma on heavy volume on a day market volume was on the light side.
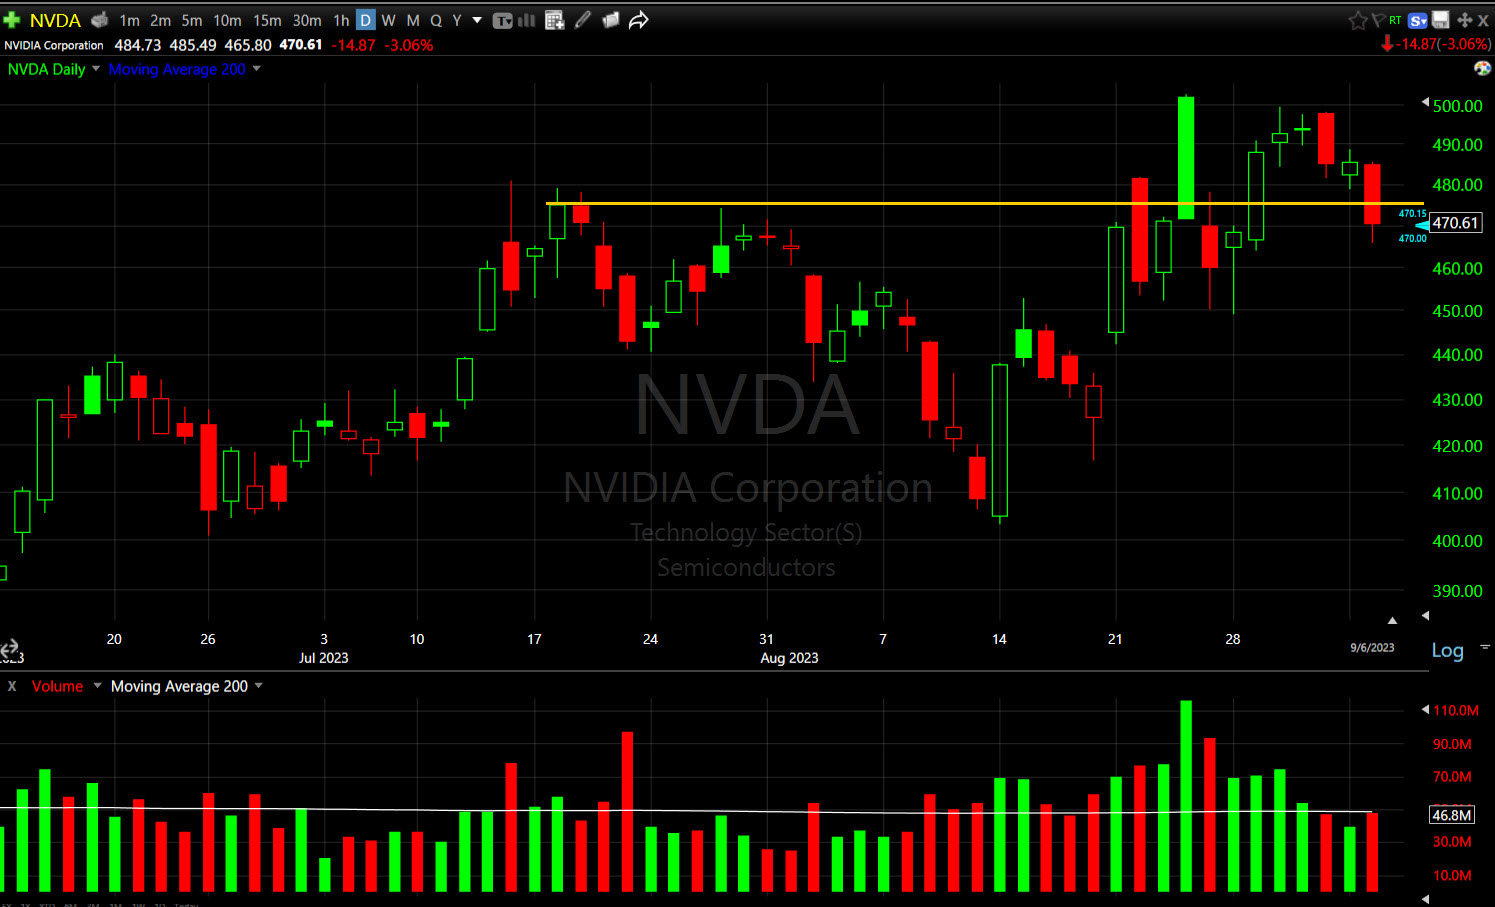 NVDA (daily) the price trend here is still an up trend, but the area I tagged 2 weeks ago at $475 is definitely looking bothersome and price closed back below it today.
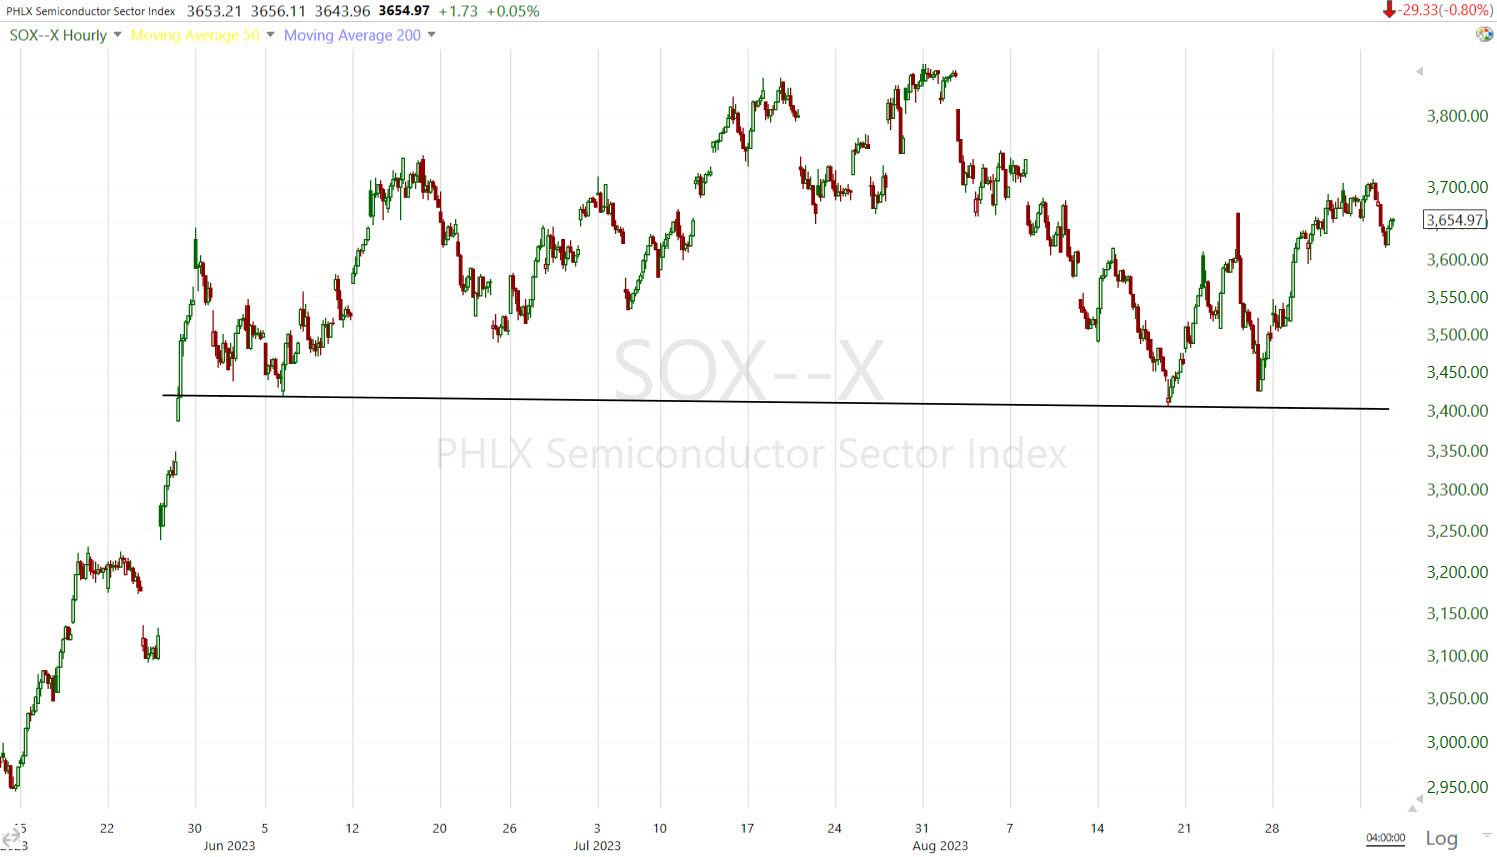 The Philly Semiconductor Index / SOX (60m) with a larger, complex head and shoulders top. It still has a ways to come down to the neck line.
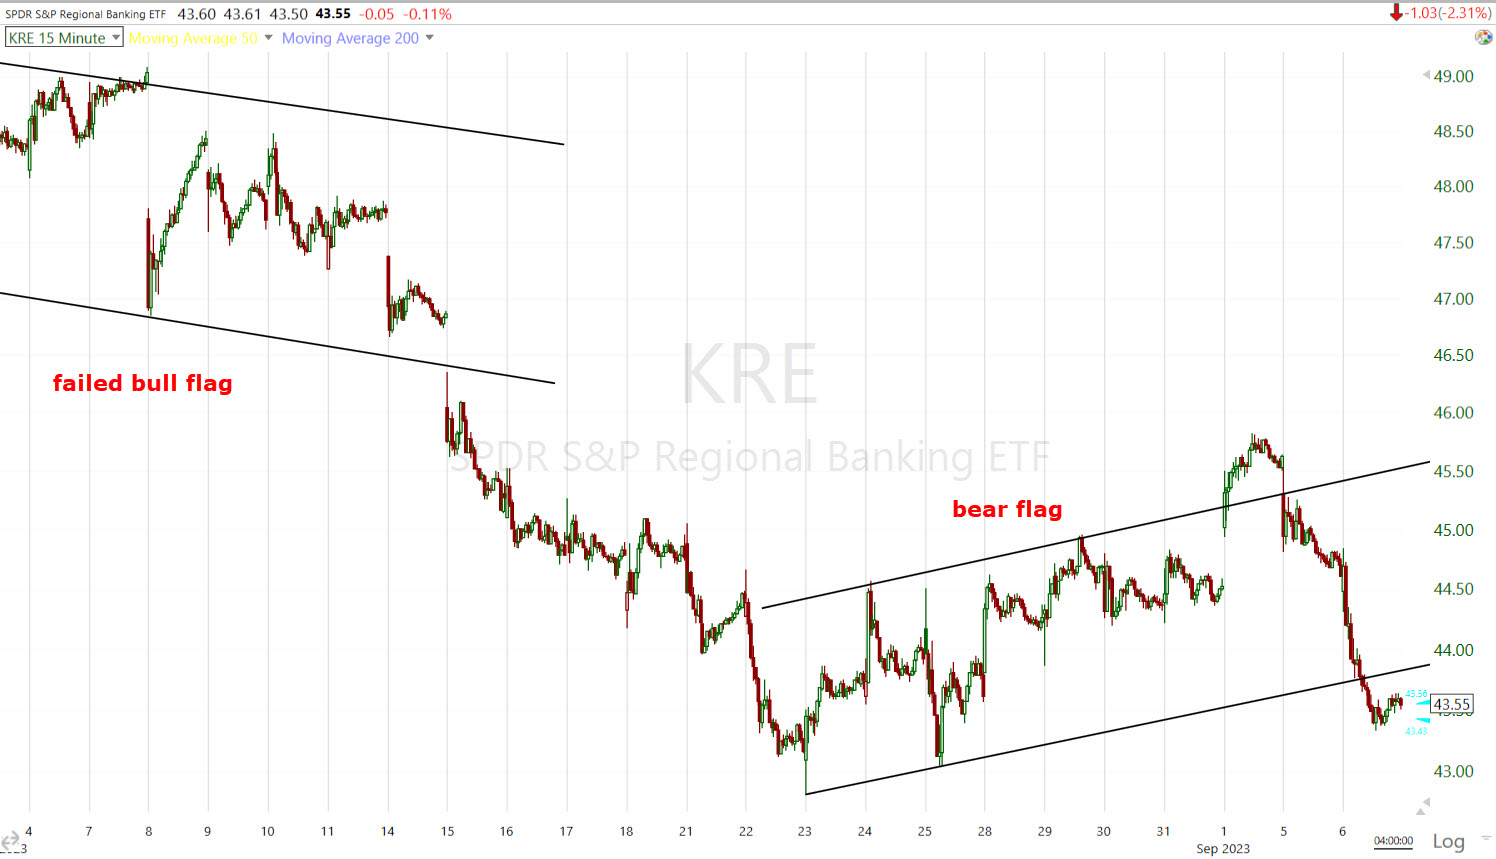 Regional Banks’ (15m) bear flag after a failed bull flag. Tat bear flag broke today. See the intraday post linked above for more on this trade.
Home Builders (XHB +0.5%) got a modest bounce today after yesterday’s -3.9% decline, but ran right into the 50-day sma as resistance.
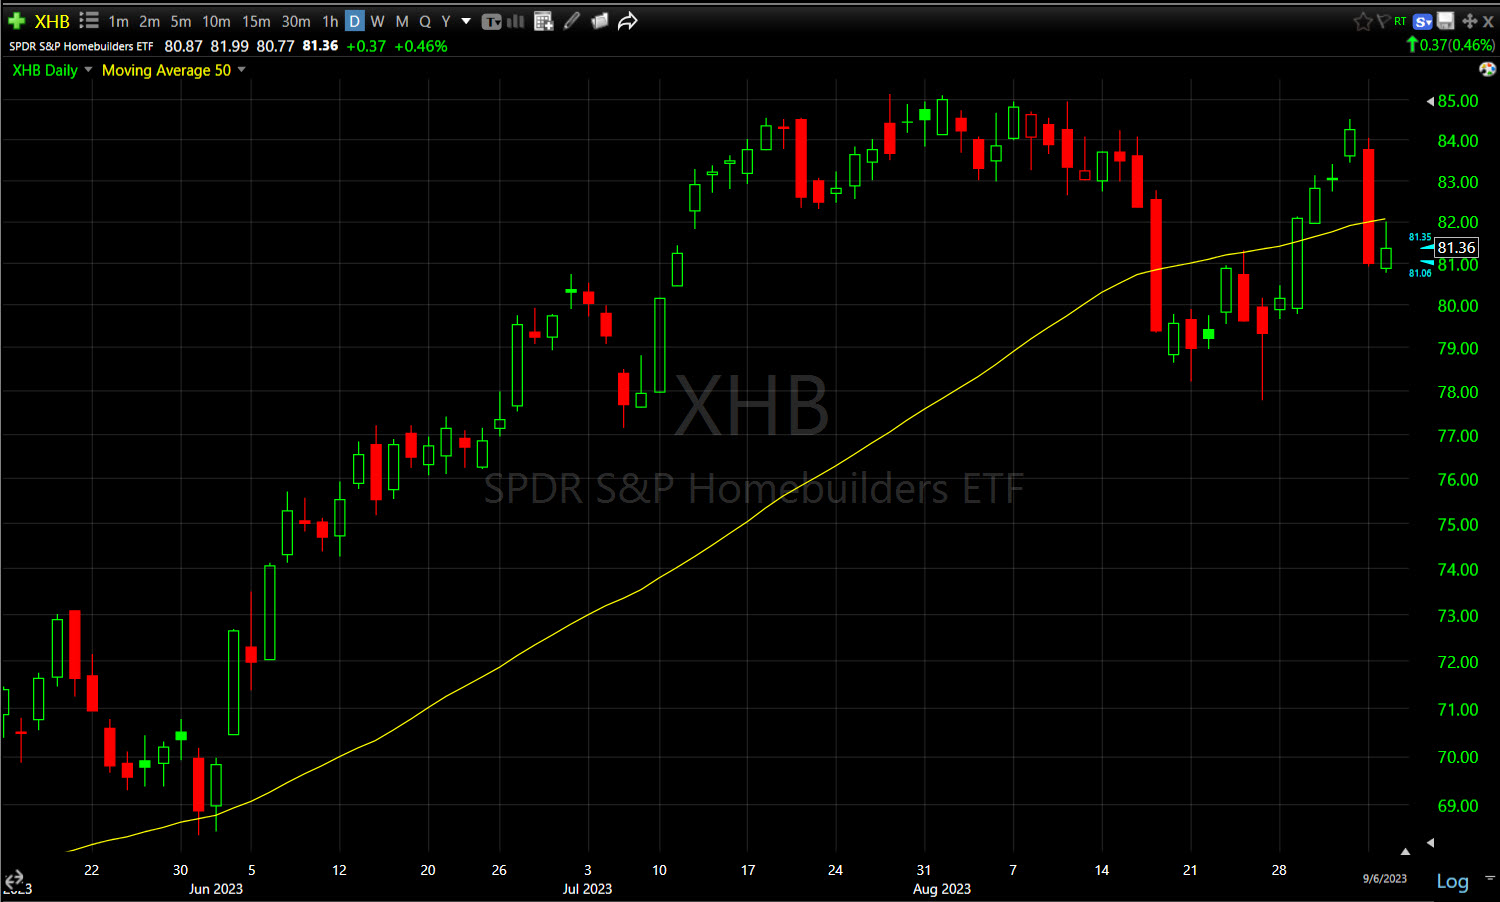 XHB (daily) and 50-day sma – note the longer upper price wick on the candlestick – that’s higher intraday prices rejected right in the area of the 50-day sma. We have a H&S here too as shown last night.
Internals
Volume (788 mln. shares) was on the light side as decliners (1773) topped advancers (1049) by a roughly 9-to-5 margin at the NYSE and a nearly 2-to-1 margin at the NASDAQ Composite.
There is no Dominant price/volume relationship today so there’s no 1-day oversold internals signal. However, breadth oscillators are at near term oversold levels.
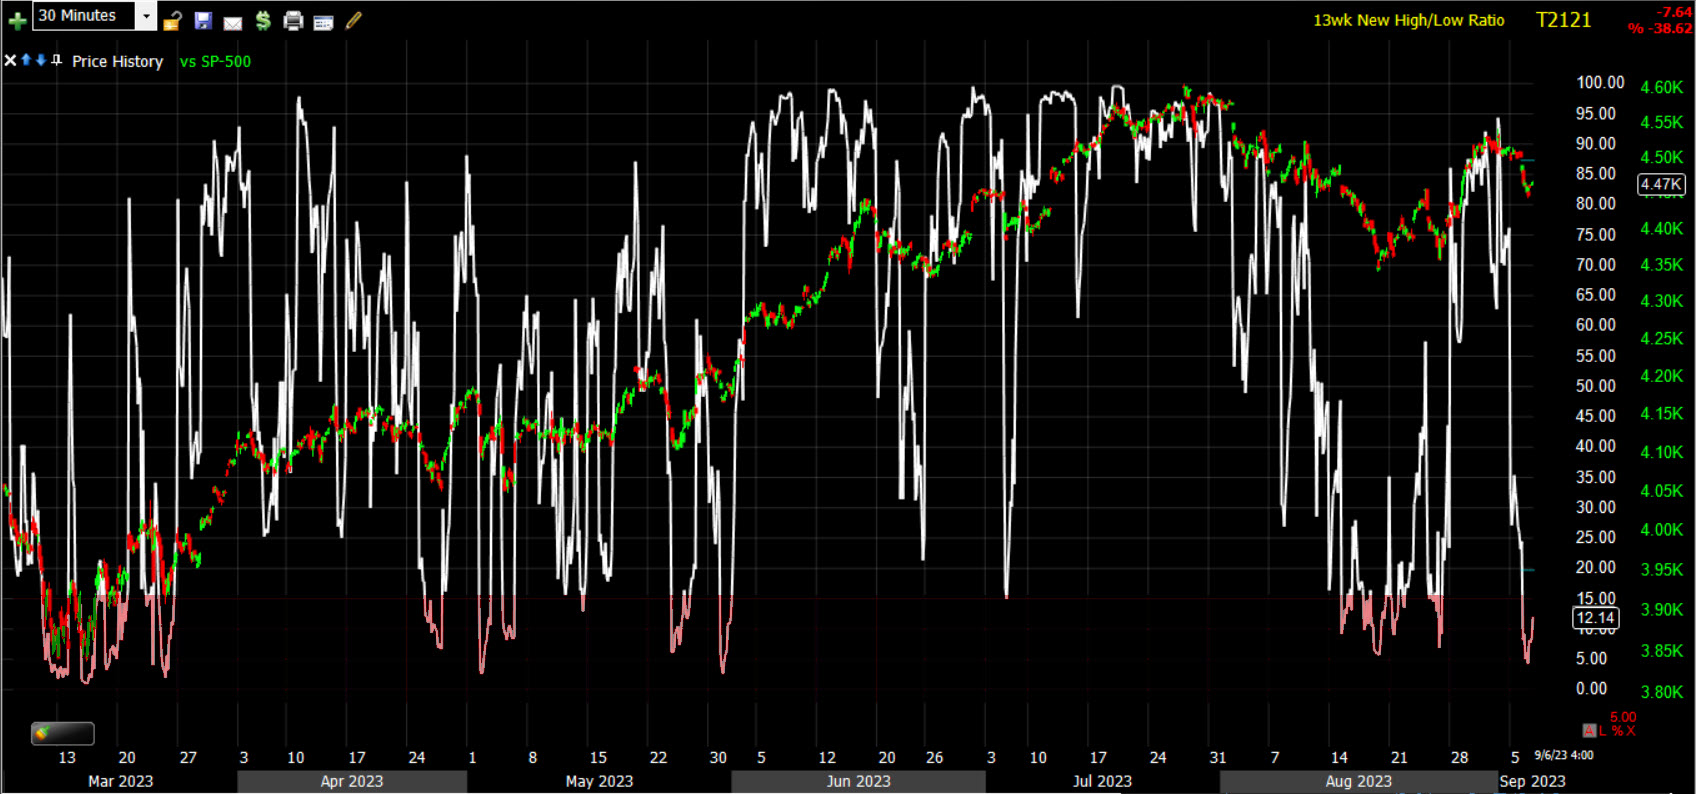 SP-500 (30m) and NYSE 13 week new highs/new lows. I shaded the oscillator’s oversold territory in red, you can see in virtually every instance it correlates with a near term low in the S&P of varying degrees. Oscillators by definition are on a scale of 0 to 100, it reached a low of 3 on an intraday basis and closed at 12.
However, while a bounce or correction is the most typical outcome from deep oversold short term signals, oversold markets can work off oversold conditions through either price (bounce) or time (consolidation) such as a bear flag.
I’ve been highlighting different breadth indicators each night in the Daily Wrap. Tuesday’s New 52 week Highs/Low was very insightful and further confirmation of deteriorating conditions, or what I’d expect to see in nearly fully formed H&S topping patterns.
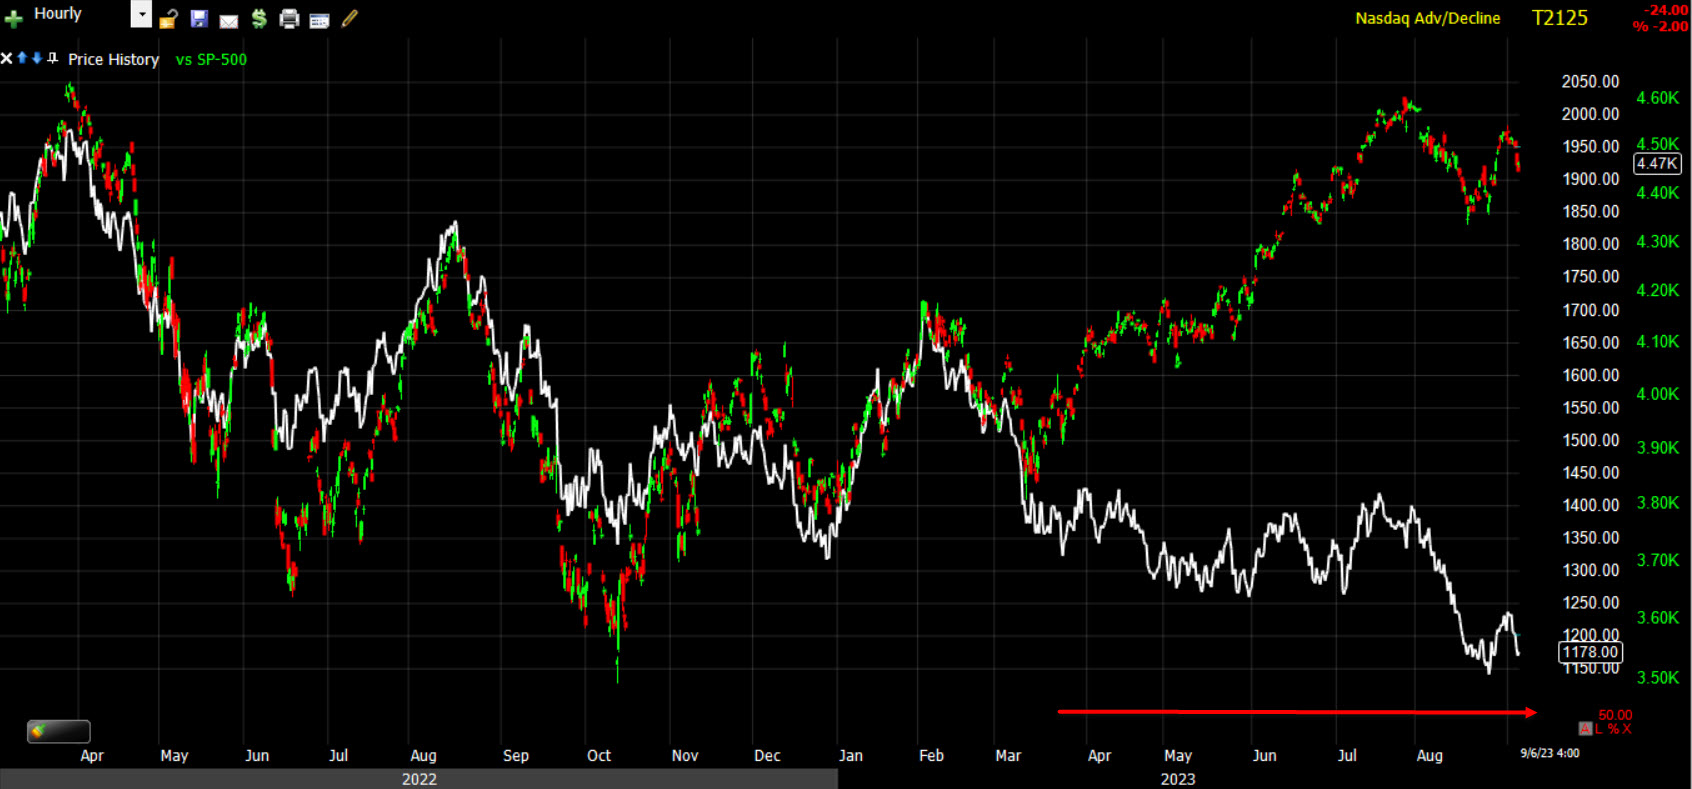 The NASDAQ Composite’s Advance/Decline Line (white) has to be one of the ugliest breadth indicators right now. Breadth is not as ugly as 2021’s bull market which was the worst I had seen in 25 years, but it’s not pretty. This shows that the stock market and the market of stocks are two very different things. Since the S&P crossed $4200 and forced an all time record short position in S&P futures to cover, propelling the market higher, this was the same time retail, hedge funds and others capitulated on their bearish positions, covered and went long. It was the same time as the “AI” narrative and the “soft landing” narrative. What this chart tells me is investors didn’t buy the stock market, they bought a select few stocks – mostly Tech and AI plays. Meanwhile we can see the majority of stocks in the composite were not ad are not participating. That makes for a fragile market that’s propped up by a handful of stocks. Bad things can happen quickly in those situations.
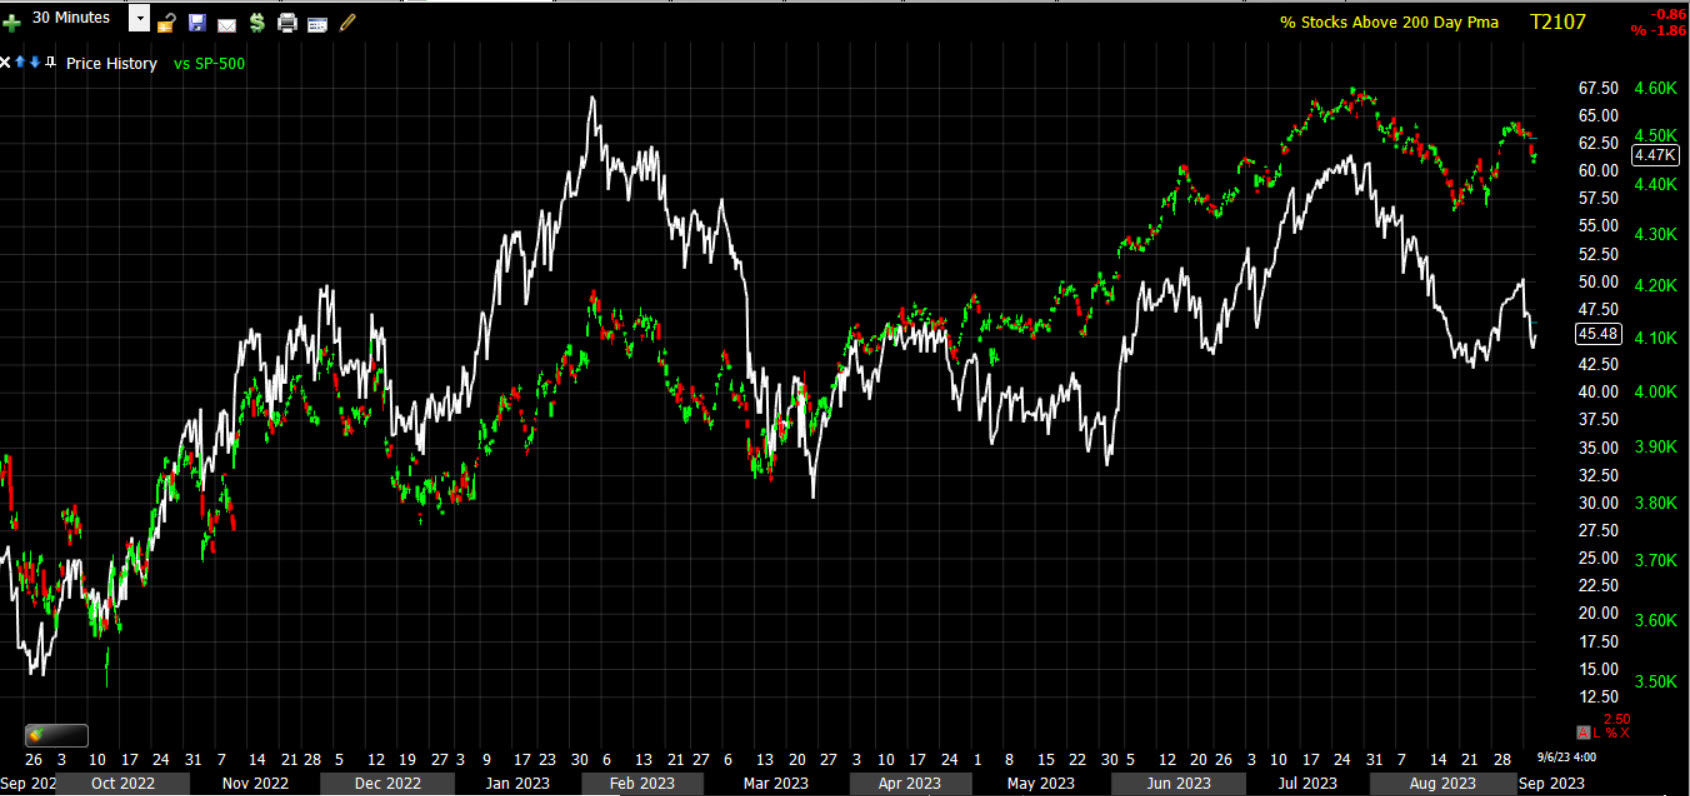
This isn’t as horrible as 2021’s bull market highs, but the Percentage of NYSE Stocks trading ABOVE their 200-day sma has not made a higher high since January. This was when the mega-caps were rotating in to leadership and I would not have even considered short sale trades as market breadth was exceedingly strong then. It’s not so now.
Treasuries
The 2-yr yield, which is most sensitive to changes in the fed funds rate, sat at 4.95% before the Services data, but settled up eight basis points from yesterday at 5.04% – back above that psychological threshold at 5.00%. The 10-yr yield was at 4.25% before the data, then settled at 4.29%.
On a related note, the Boston Fed’s Collins told business leaders in Boston,
“This phase of our policy cycle requires patience, and holistic data assessment, while we stay the course… And while we may be near, or even at, the peak for policy rates, further tightening could be warranted, depending on the incoming data.”
High yield Credit (HYG -0.25%) has the same bear flag intraday, but more notably is that on a relative basis vs. the S&P, it is leading the benchmark index lower.
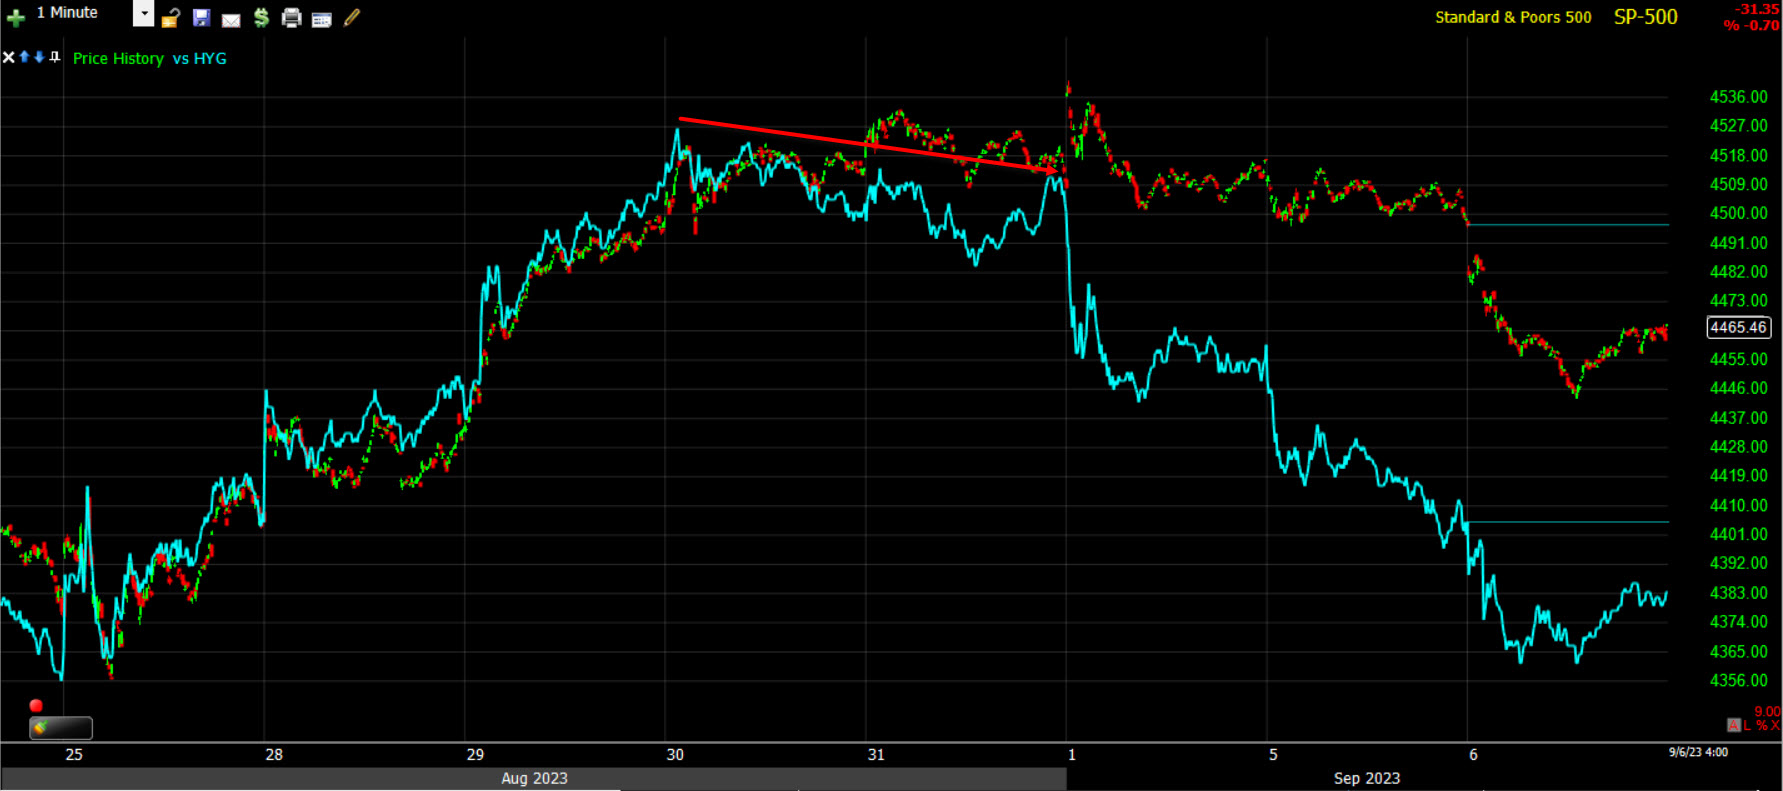 SPX and HYG (1m) – HYG can be very insightful. I first remarked last week that it was displaying a modest relative negative divergence (red arrow), which to me suggested that last week’s rally off the neck lines was stalling. The rally stalled, and is now following credit lower. I don’t use HYG for marking price targets for the S&P, just directional moves, but on a relative basis, it suggests that the S&P should be about -1.5% lower just to catch down to HYG. I only mention that to illustrate that is is leading lower.
Currencies and Commodities
The U.S. Dollar Index only added +0.1%, but closed at its highest since March which has been a headwind for stocks.
I’ve featured a lot of Australian Dollar charts recently, from the market averages’ H&S top to the big picture macro-economic outlook in which it is diverging with the equity market in similar fashion as it did before the COVID crash and before the 2021 bull market highs led to 2022’s bear market. I just wanted to show that it’s also now becoming more useful as a shorter term indicator as well.
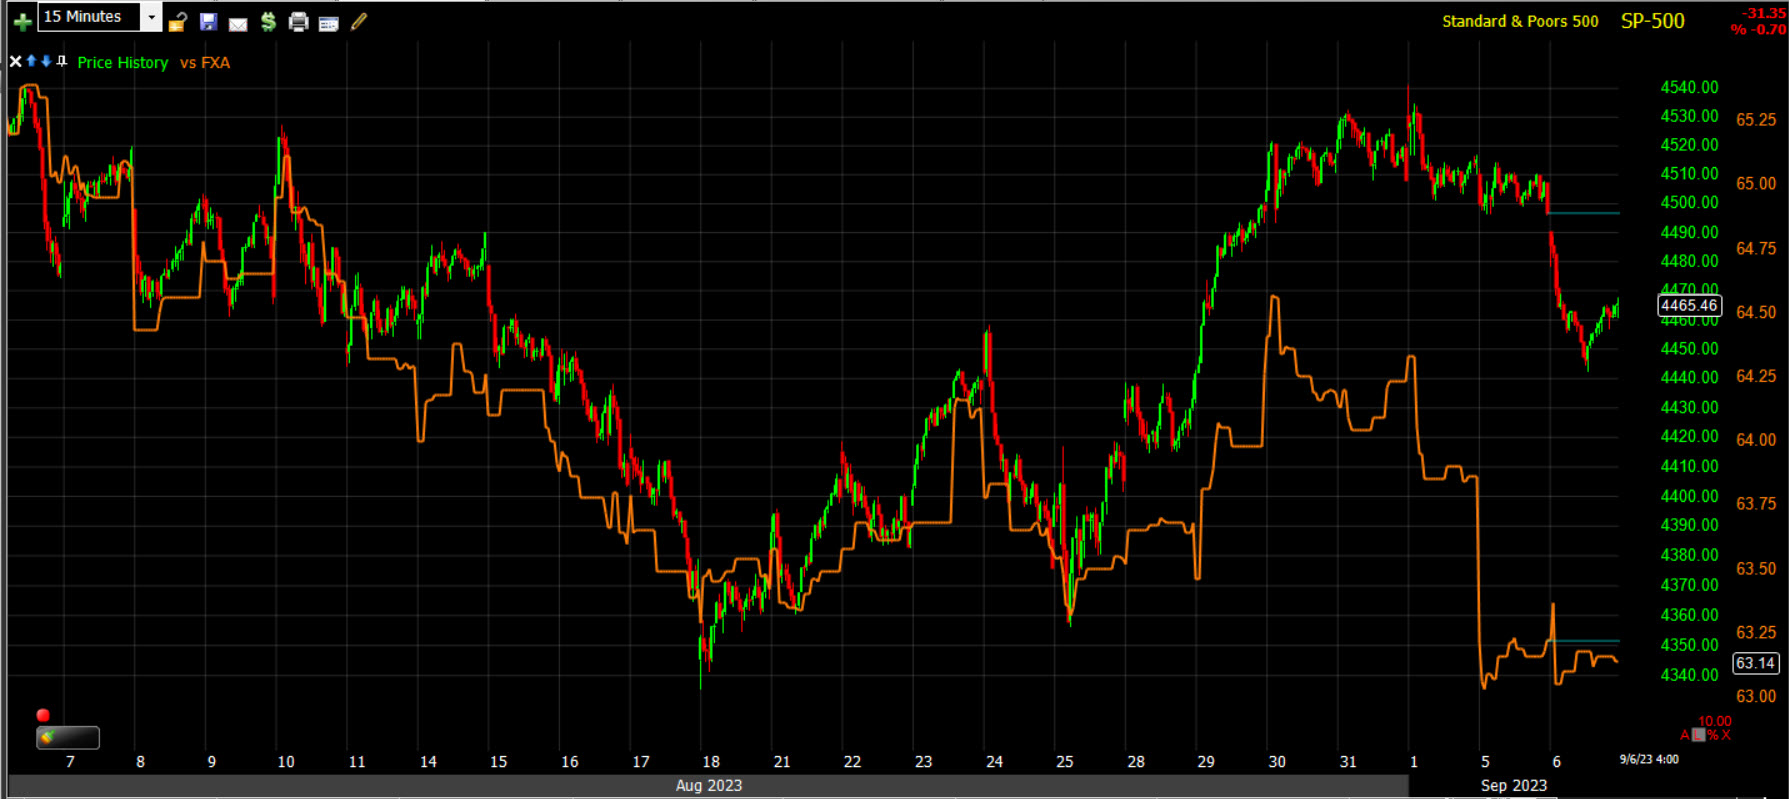 SP-500 (15m) and proxy for the Aussie (orange). As pointed out last week, the Aussie was not keeping pace with the bounce in stocks. We can see its divergence called last week’s high, and now trading at levels below where the major market averages were last at the H&S neck lines, it’s at least signaling that prices return to those necklines, completing the Head and Shoulder tops we’ve seen in every major average and numerous S&P sectors. In fact, it’s trading below that level, although not by a huge margin (yet).
Energy complex futures saw another mixed session. WTI crude oil futures jumped another +1.2% to $87.57/bbl. to a 10-month high. Natural gas futures fell -2.7% to $2.51/mmbtu.
Gold futures settled lower by -0.4% to $1,944.20/oz, this alongside modest gains in the dollar and a jump in yields. Gold is sitting right around its 200-day (support).
Bitcoin didn’t do anything of note on the day, but did see some volatile price action that looks like a stop run at $26k.
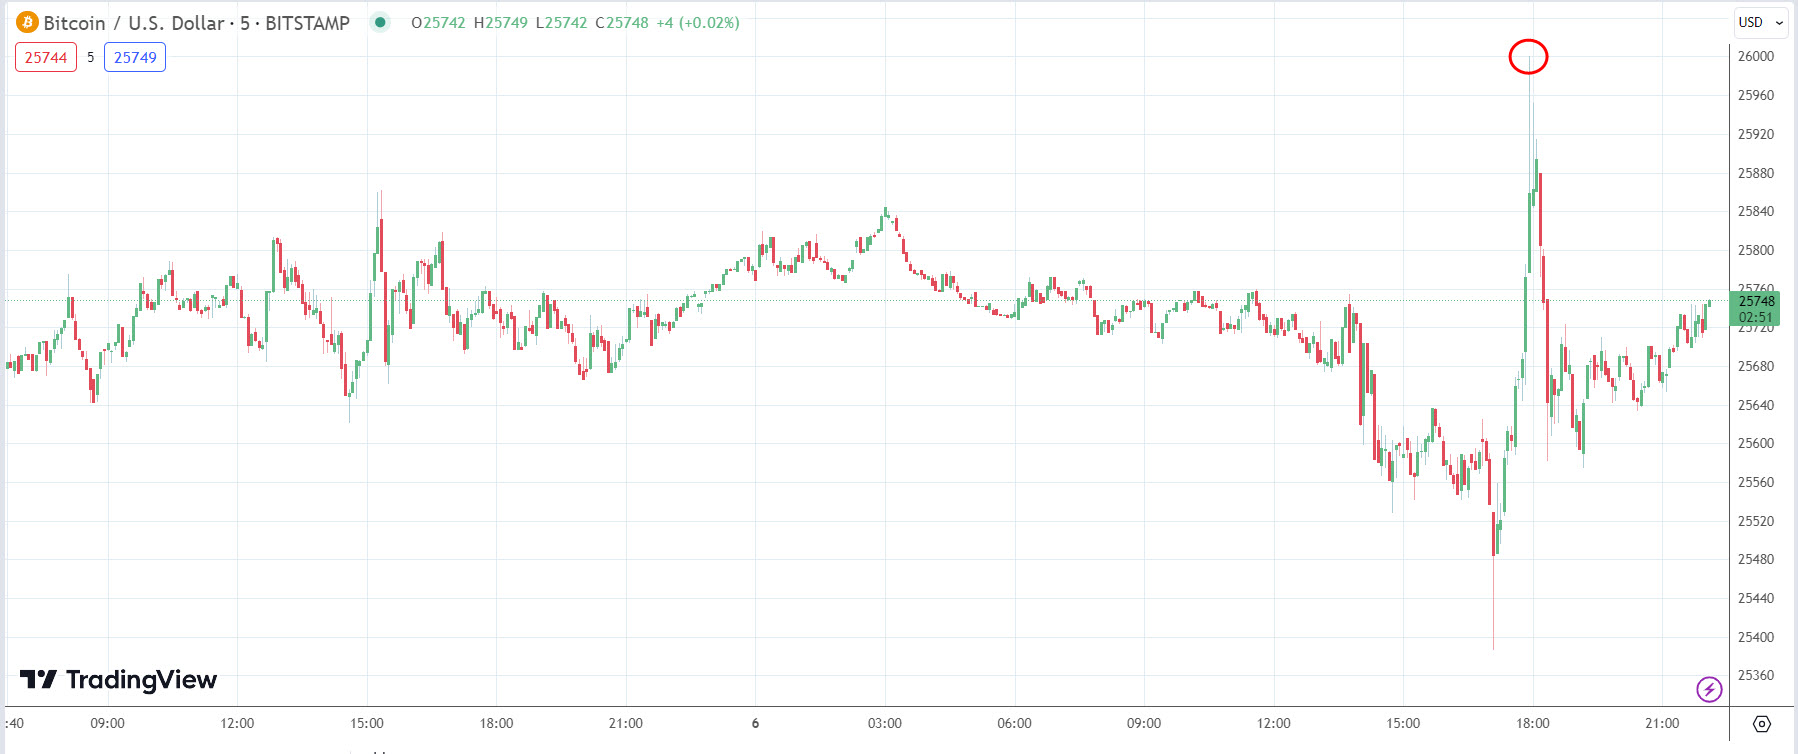 BTC/USD (5m) running stops right at $26K? Looks like it. Meanwhile, it’s still resistance and Bitcoin in my view (as well as other cryptos) are dead money until the Fed cuts.
Summary
I think you know all of my thoughts on the market at this point. As far as tomorrow and maybe the rest of the week, we don’t have 1-day oversold internals, but breadth indicators are there. After seeing the close, I’d place the highest probability on those small intraday bear flags expanding, perhaps the rest of the week. Remember that a bear flag is upward sloping so we could see some modest price gains, but it would be more interesting to see if they do broaden out. If so, we’ll have a nice quick short trade. If we got a little more downside from here and then flags expanding into next week, I’m guessing they’d have a measured move coming right down to the neck lines. The advantage of the flags is that they set up the trade, the target and risk management as well as some degree of timing.
What’s far more important is the change the market is undergoing. I haven’t seen many people talking about these H&S patterns that are now everywhere like chicken pox, so it seems to me there’s a lot of complacency and that could lead to some surprised traders leading to an increase in price volatility. Of course as I have been noting, a H&S pattern is just that, it’s not a top until the neckline breaks, but these are some of the best confirmed patterns I’ve seen in a long time and the number of them is almost unprecedented in my expiernece.
Overnight
S&P futures are unchanged tonight. 3C charts of index futures look the way I’d expect to see an expanding flag consolidation.
The U.S. Dollar Index is very little changed (-0.05%). Last night I said that the Dollar’s recent gains suggested yields had more upside and we got that today. That gap is pretty much closed now so yields are more likely to be more data driven.
WTI Crude is up +0.2% and in a small bullish consolidation of today’s gains, but it’s not the cleanest consolidation.
Gold futures are down -0.15%. 3C is a bit more positively divergent here so I’m guessing that’s technical traders stepping in near the 200-day.
Bitcoin futures are up +0.4%, but still below $26k ($25,805).
Yields are little changed and mixed with the 2-year down about a half basis point and 10-year up about a half. that’s interesting because as I look at Treasury futures’ price and 3C charts, the short end of the curve still looks like yields could move higher, while the longer end of the curve looks like longer term treasuries have a better chance at stabilizing here and yields moderating or coming down a bit. Tomorrow’s labor data before the open likely sets the tone for the short end. Perhaps because we don’t have much else in economic growth data, the long end is setting up as if it’s about to get a break from the rise in yields.
Thursday’s economic calendar includes:
- 8:30 ET: Weekly Initial Claims (prior 228,000), Continuing Claims (prior 1.725 mln), revised Q2 Productivity (prior 3.7%), and revised Q2 Unit Labor Costs (prior 1.6%)
- 10:30 ET: Weekly natural gas inventories (prior +32 bcf)
- 11:00 ET: Weekly crude oil inventories (prior -10.58 mln)