Excerpt From the Member’s A.M. Update (Sept. 12/2022)
*For those of you from Twitter referencing this tweet as it’s easier to explain here, this is the section I referenced from this morning’s subscriber’s pre-market A.M. Update. I’ll emphasize the on topic sections in bold font below.
A.M. Update
“Index futures are coming into the new week, following through on last week’s gains. S&P futures are up +0.4% as the U.S. Dollar Index (-0.75%) continues to come down, along with Treasury yields (2-year down -4 bp and 10-year -4 bp). The euro is extending gains and rose the most in six months against the dollar.
It seems traders are starting to lean toward tomorrow morning’s (8:45 a.m. ET) CPI report – the last important inflation reading before the Sept. 21 FOMC policy meeting – will confirm peak inflation with two consecutive monthly declines, but recall that in April we had a weak CPI report that was not confirmed in May. However, our Copper : Gold ratio indicator never signalled peak inflation until mid-June – the same indicator that called embed inflation (rather than transitory inflation) in March of 2021, about a year before the Fed admitted inflation was not transitory, but embedded in the economy.
From a quick read of the 3C charts, the trend chart that depicted both the pull back from August highs and a bottoming process into the start of September, still looks solid.
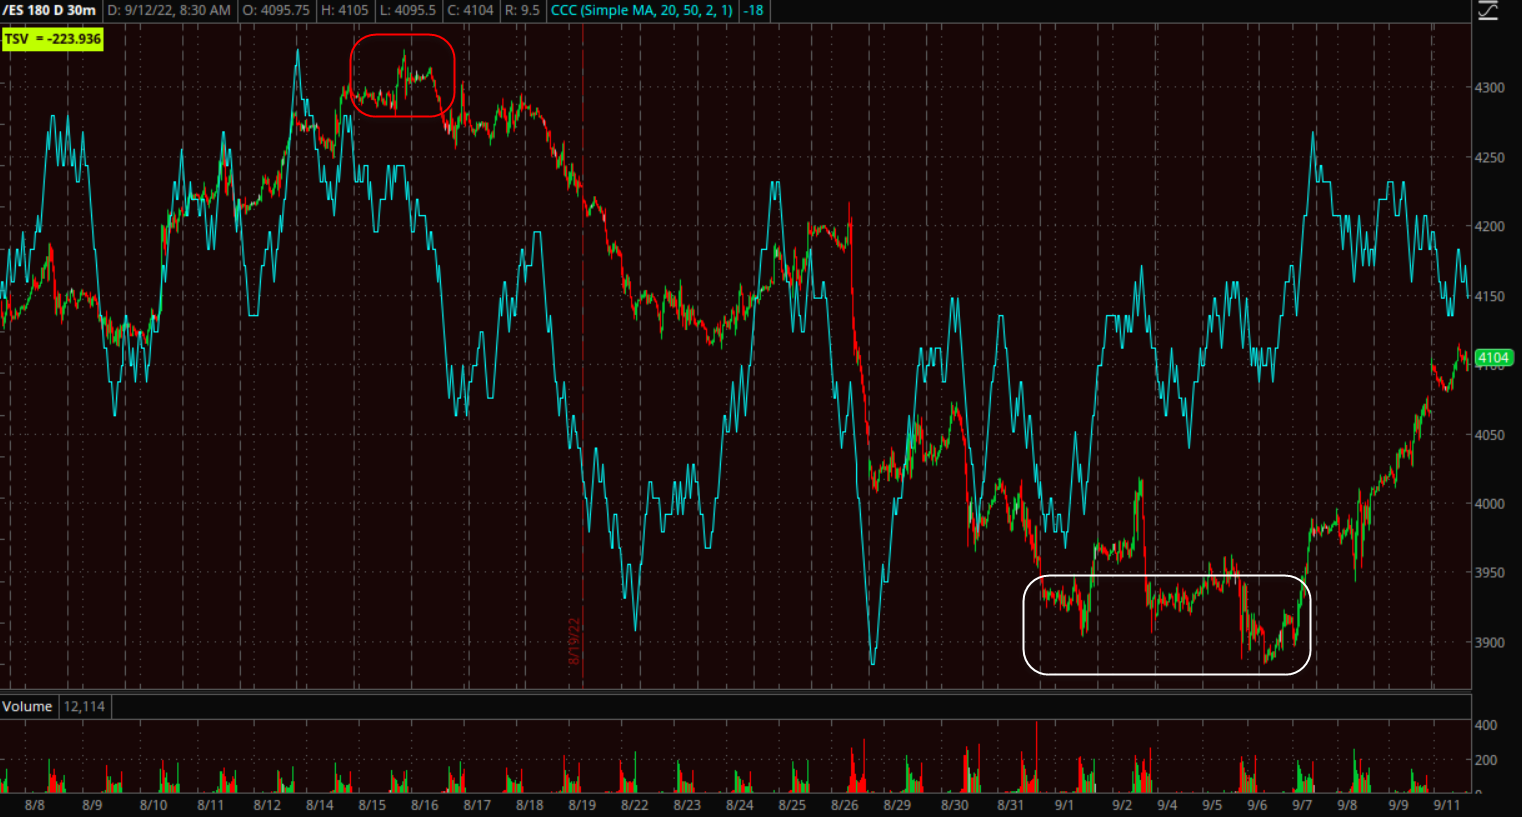 S&P futures (30m) trend chart
However, after 3 consecutive days of green closes and a +4.1% gain in the S&P-500 over the period, there are signs showing up that we may be nearing a consolidation day, which would make some sense ahead of tomorrow morning’s key CPI report before the open.
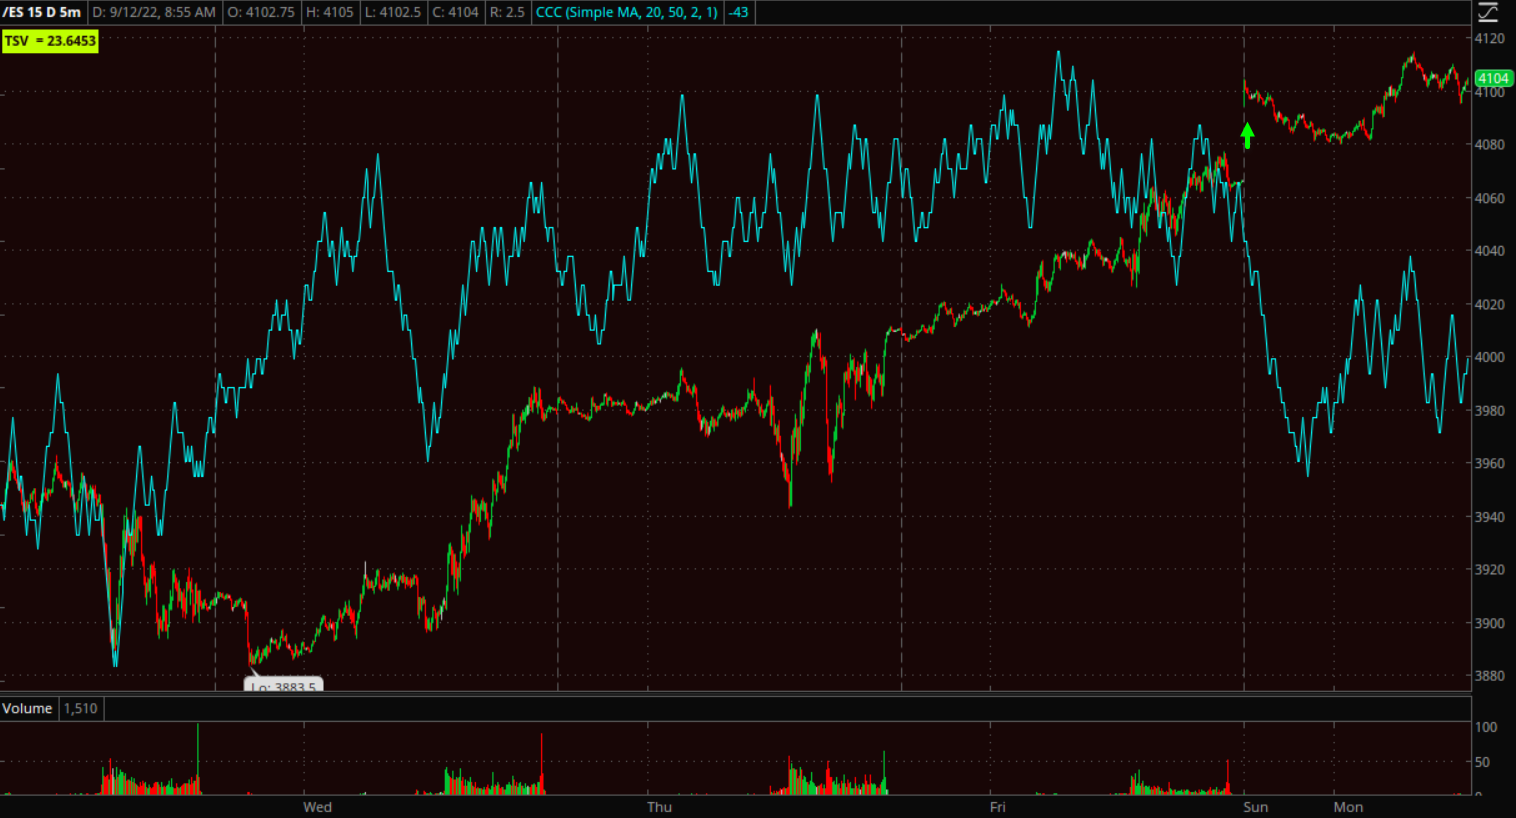
S&P futures (5m) on this shorter, more sensitive timeframe, 3C is not confirming as well since Sunday’s open (green arrow). My interpretation at this point is that it may suggest a slow down in buyers’ conviction and lead to a consolidation day.”
And that’s exactly what the intraday cash session turned into. As of the close….
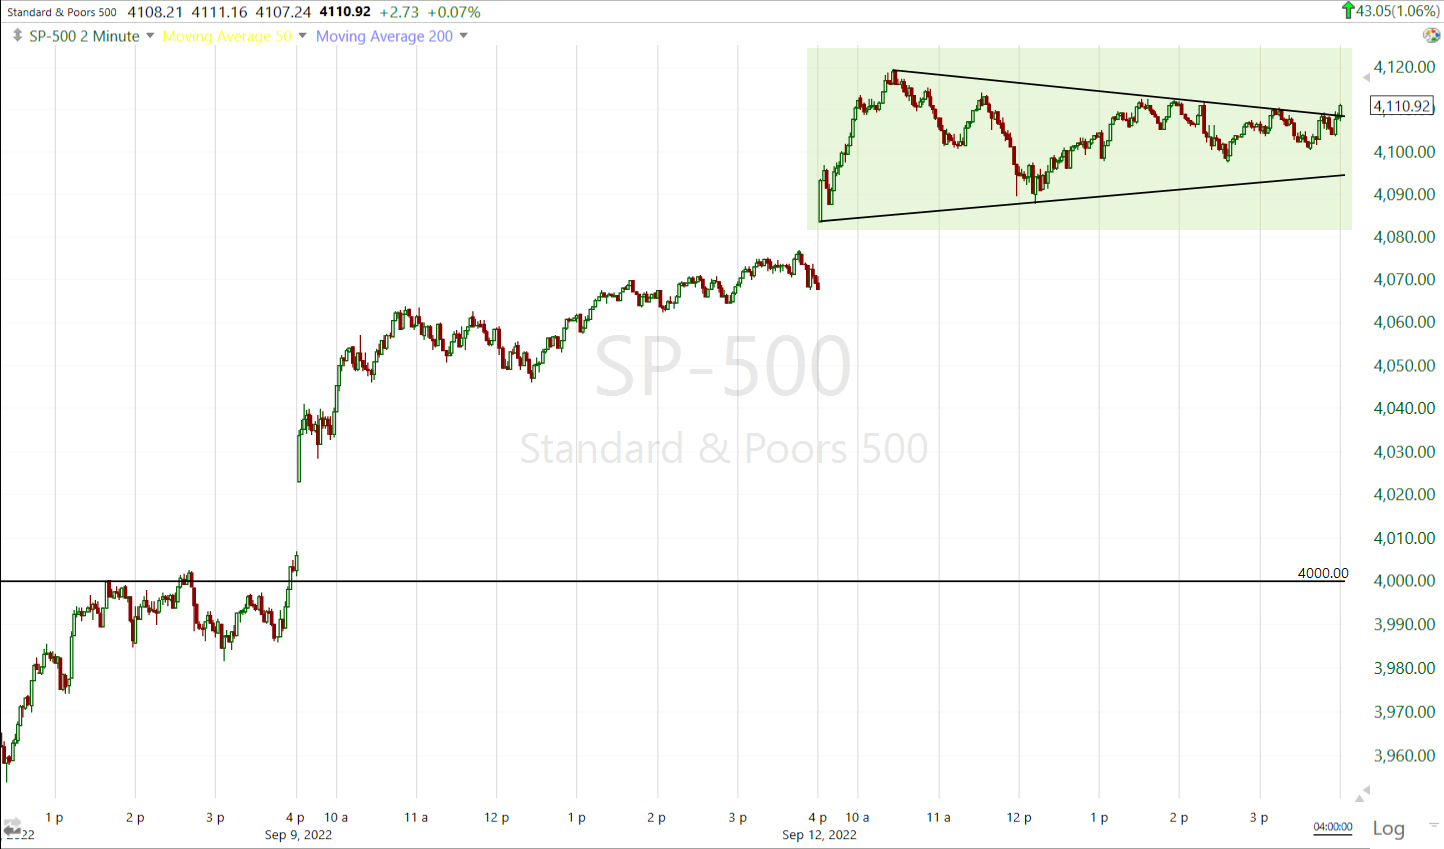
SP-500 (2m) with today’s intraday consolidation in price (highlighted in green) in the form of a symmetrical triangle.
A case could be made for a small bull flag too, but the fact the lower trend line wasn’t confirmed with another test makes the triangle more appropriate at this time.
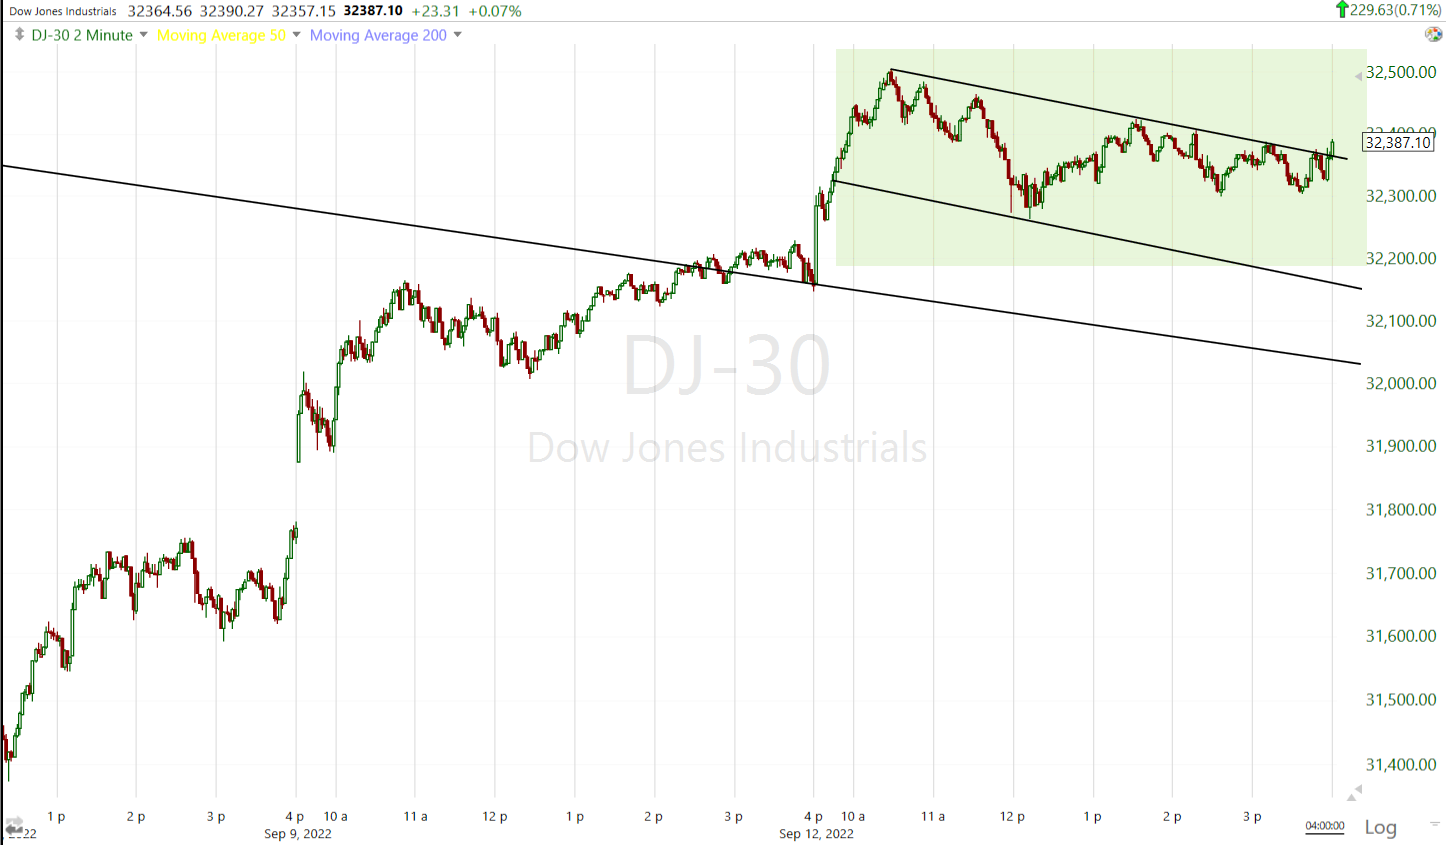 Dow (2m) with a similar price pattern to the S&P with a potential bull flag. The upper trend line was tested plenty of times throughout the day to make it valid. A test of the lower trend line would have made a stronger case for a bull flag, but either way (bull flag or symmetrical triangle), the early analysis suggested a consolidation day and both price patterns are that of consolidation days.
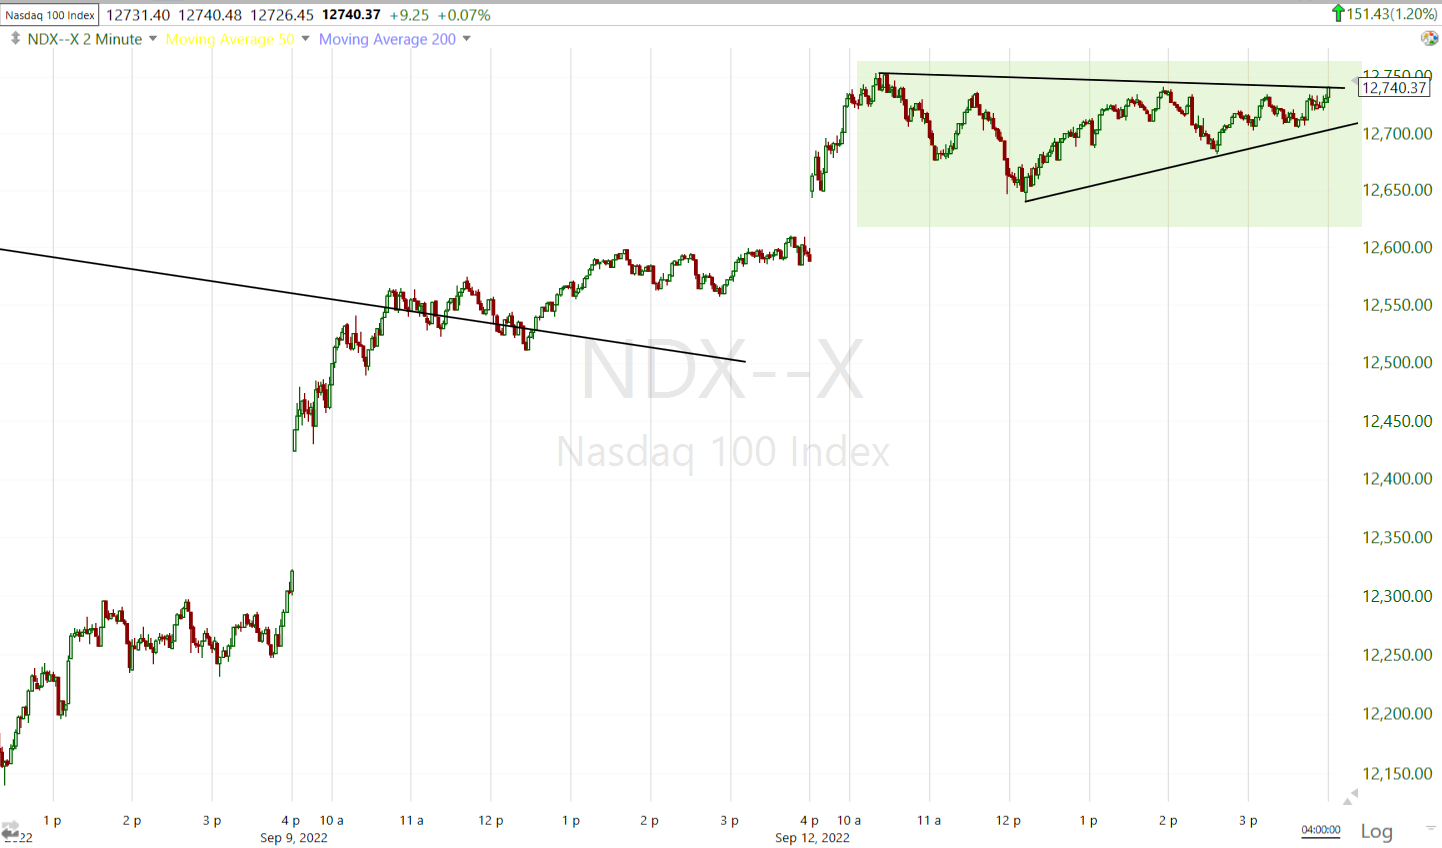 NASDAQ-100 (2m) with a bullish ascending triangle today (highlighted in green). The ascending triangle is due to the mega-caps (MGK +1.39%) outperforming the equal weight S&P (+0.88%) by 50 basis points.
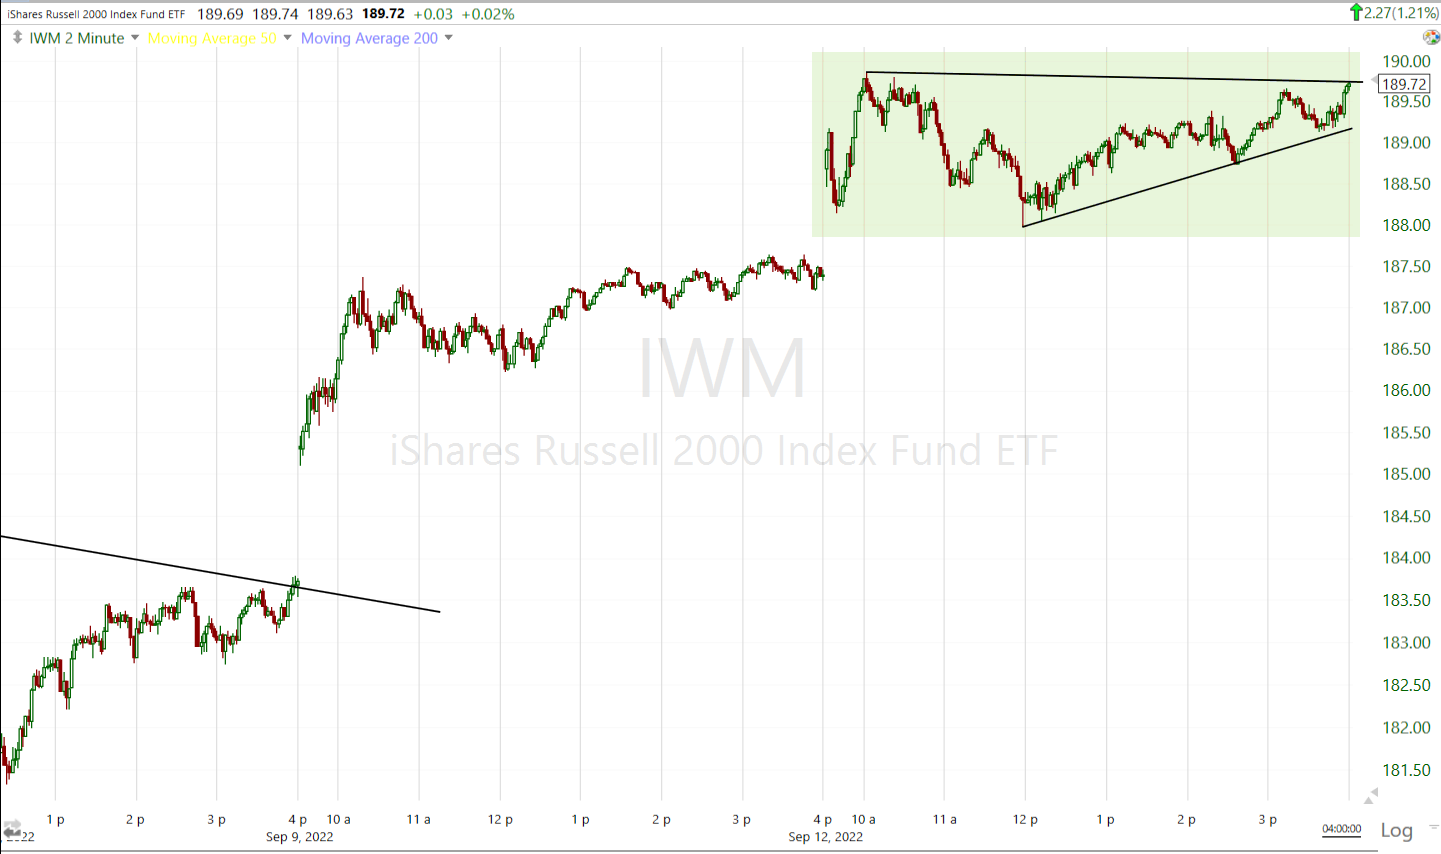 And Small Cap IWM (2m) with another ascending triangle consolidation pattern.
VIX’s (+4.75%) relative strength was apparent early on and just went to confirm the slightly lower conviction in markets today observed on 3C charts before the open (although still bullish price action in the short term) ahead of tomorrow’s CPI print before the open.