Friday, October 14th’s Afternoon Update
Afternoon Update
Quite a week, or at least a Thursday with the 5th biggest intraday reversal on record. To put that in some context, for years (I’ve said this mostly during bull markets) you’ve probably heard me say that bear market rallies are some of the most spectacular you’ll ever see, so the fifth biggest intraday reversal in history comes in the midst of a bear market. There’s a little question mark though on that point when it comes to small caps and Dow as covered last night. They seem to have already started to enter a transitional state of primary trend down to at least a sub-intermediate lateral, maybe to be an intermediate trend sideways.
I started seeing the first signs of this transitional trend in August when all of the major averages made a higher pivot high in the midst or a primary downtrend. That raised the question of a transition. To be clear, I’ve never viewed this transition as a bear market bottom, but something else in the midst with the expectation being, at some point we do see the bear market reassert itself and trade to a meaningfully lower low before all of this is over. I just want to be clear on that point.
I’ve also either become, or have been becoming more clear that this potential transition is probably not due to inflation breaking, and a dovish pivot from the Fed. Although it can be said with some certainty that commodity inflation has at least broken, which the Copper:Gold ratio indicator told us about a month ahead of time. I think the probabilities of any “less hawkish” central bank policy is more likely to come in the form of a breakdown in the financial system, that’s become so fragile due to extreme central bank coddling over the last 2 decades, that they created this extremely fragile monster that looked like a raging bull on the outside, but internals showed a thinner and more fragile market than I’ve ever seen- particularly last year as the major averages (save for small caps) made new record high after new record high. All the warning signs were there that it was a pile of kindling just awaiting a spark, and that spark was inflation with its inception in COVID.
On the Financial system fragility front… We’ve already seen the Bank of Japan intervene in support of the Yen for the first time since 1998 (this has a lot to do with the very dovish stance of the BOJ as compared to the very hawkish stance of the Fed). Then we saw the Bank of England have to intervene in support of their gilts market (to save pension funds), which was blowing out. We know the reason why – a divergence of policy between the UK government and the central bank. We know the reason inflation surged too… COVID, but just because we understand the reason doesn’t mean that more of these unexpected shocks won’t materialize. And on the Bank of England/UK front, that situation isn’t even resolved, which in part has led to some of today’s weakness.
Now I’m reading stories that the Swiss National Bank has been in need of emergency-assistance via Fed swap lines amid a Dollar shortage. I keep saying the strong dollar is going to break something sooner or later. Apparently the Fed had to send the SNB $6.27 billion to avoid an emergency funding crunch.
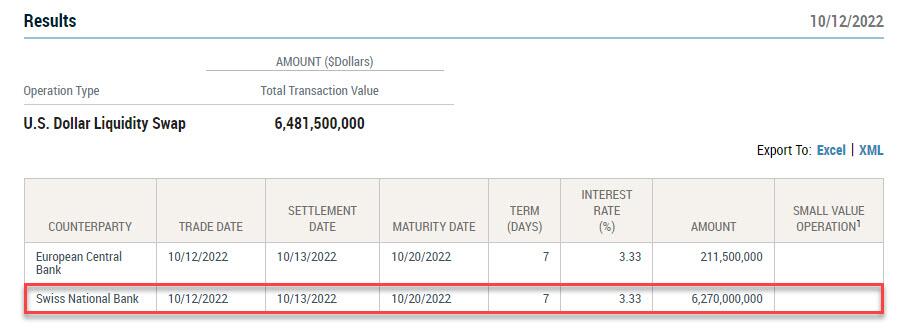
For some perspective, this was the largest single $USD swap in history. Of course if you’ve been listening to financial reports in recent weeks, you may have heard that Credit Suisse appears to be in some trouble and that could be the reason the SNB needed this emergency overnight funding, and it’s the second week in a row the Fed has had to send Dollars to the SNB and only 2 times this year.
In any case, this is hypothesis that I think is rooted is in some common sense, and also some initial evidence as well. Central banks and the Fed in particular, have a really nasty habit of ignoring things too long, acting too late, and/or acting too much or too little… never “just right” or the “soft landing” they always shoot for and never achieve.
As far the current market action, with about 20 minutes left to go on the week we have:
SP-500 down -1.25%, but holding its 200-week sma. The Dow up +1.6% and one of the best examples of a “W” base. Also recall that the Dow/DIA’s 3C chart has seen the most notable standout improvement into October, almost coming out of nowhere as it wasn’t really on my radar much before that. Dow Transports are +0.6% for the week. NASDAQ-100 is down -2.75% on the week, and Small Cap IWM is down -0.8%.
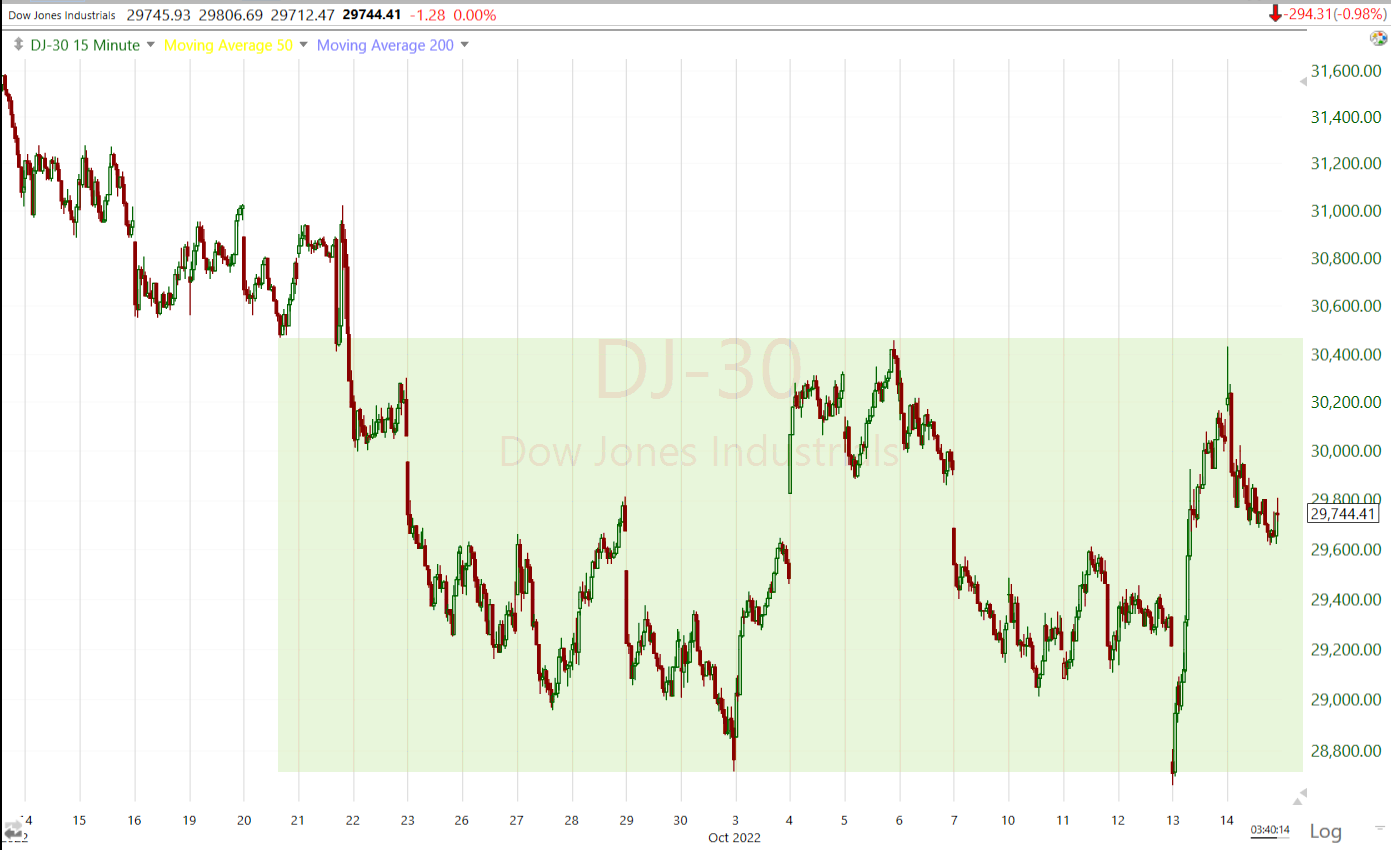 Dow (15m) potential “W” base
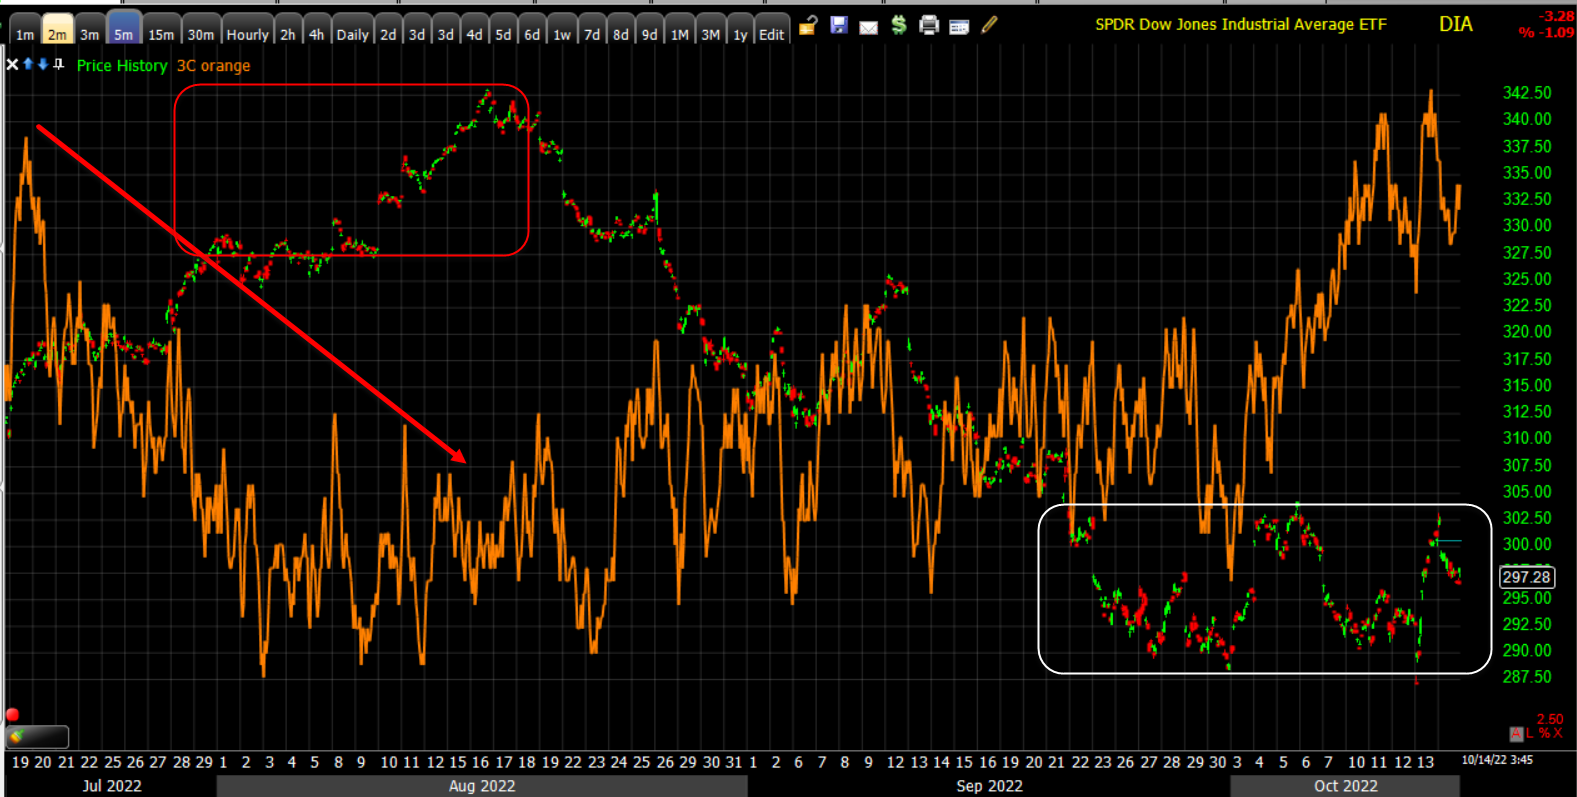 DIA (5m) notable positive 3C divergence into October at the second low of the “W” base.
Intraday trade and today’s close could be better, but it’s not far at all off a bullish consolidation or the start of a bullish consolidation at a very reasonable area to expect one.
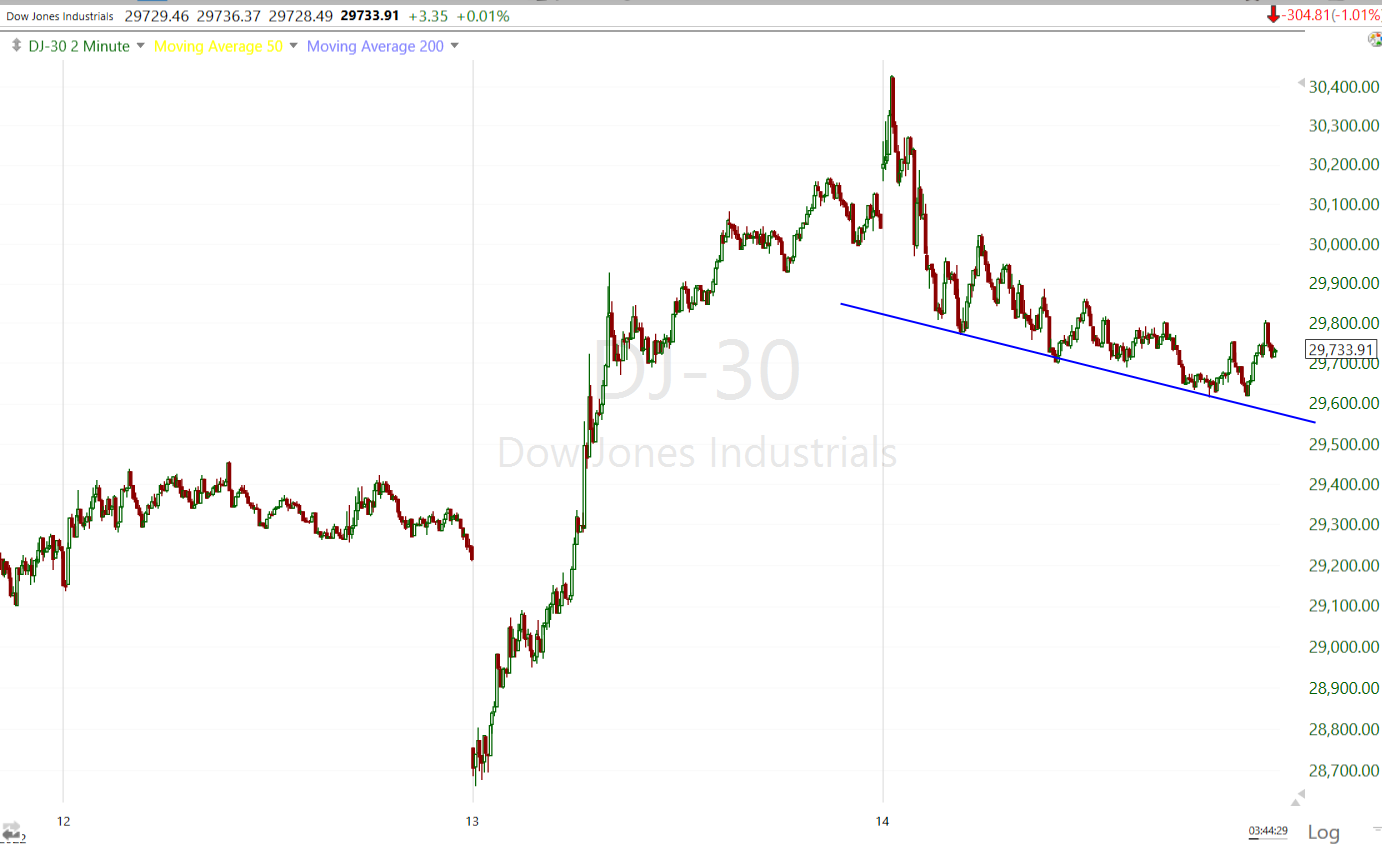 Dow (2m) this isn’t a textbook a bull flag, but it could be the start of one (a downward sloping parallelogram following a strong nearly vertical advance).
Small Caps have a pretty well defined “W” base as well.
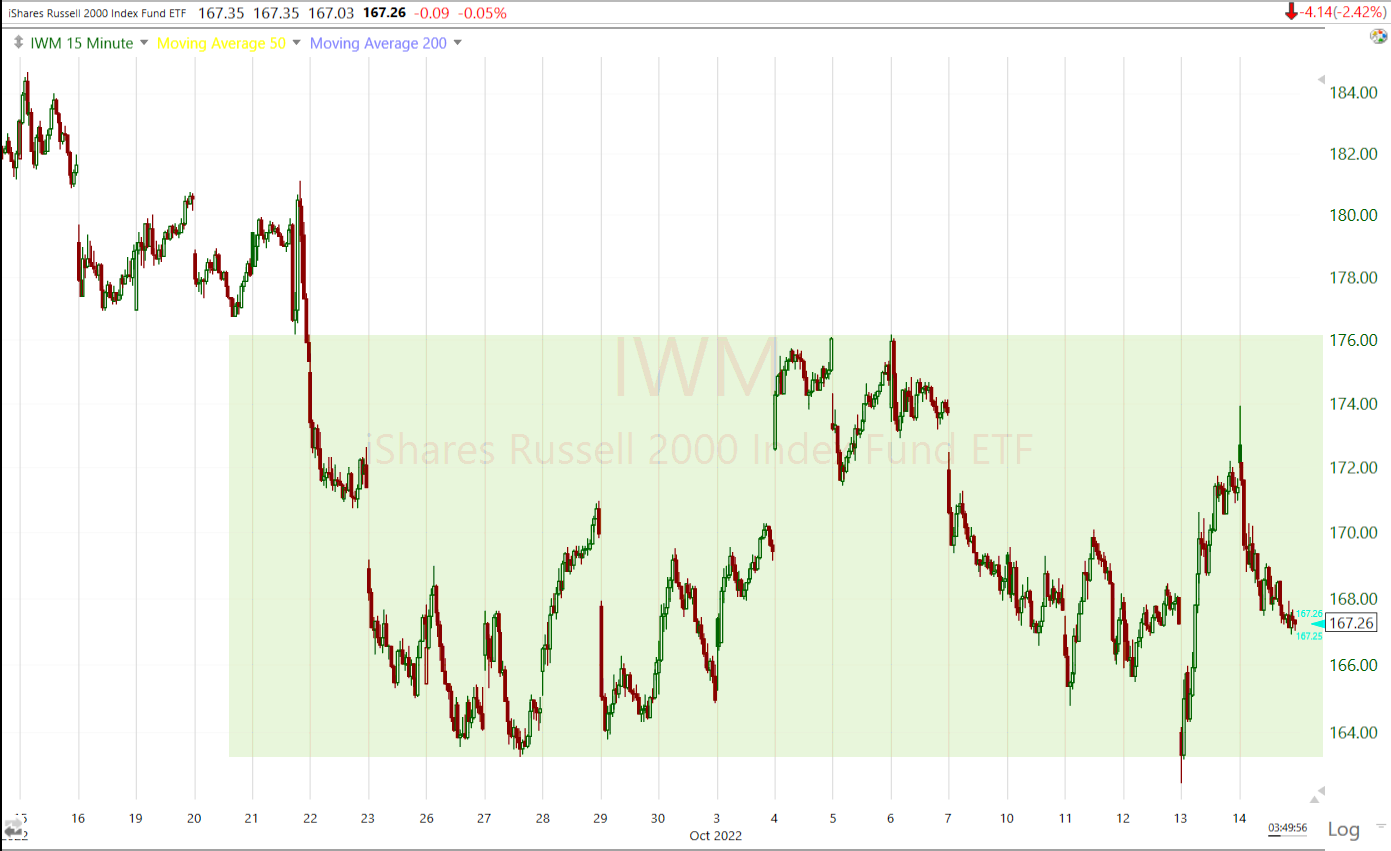 IWM (15m)
And an improving 3C chart.
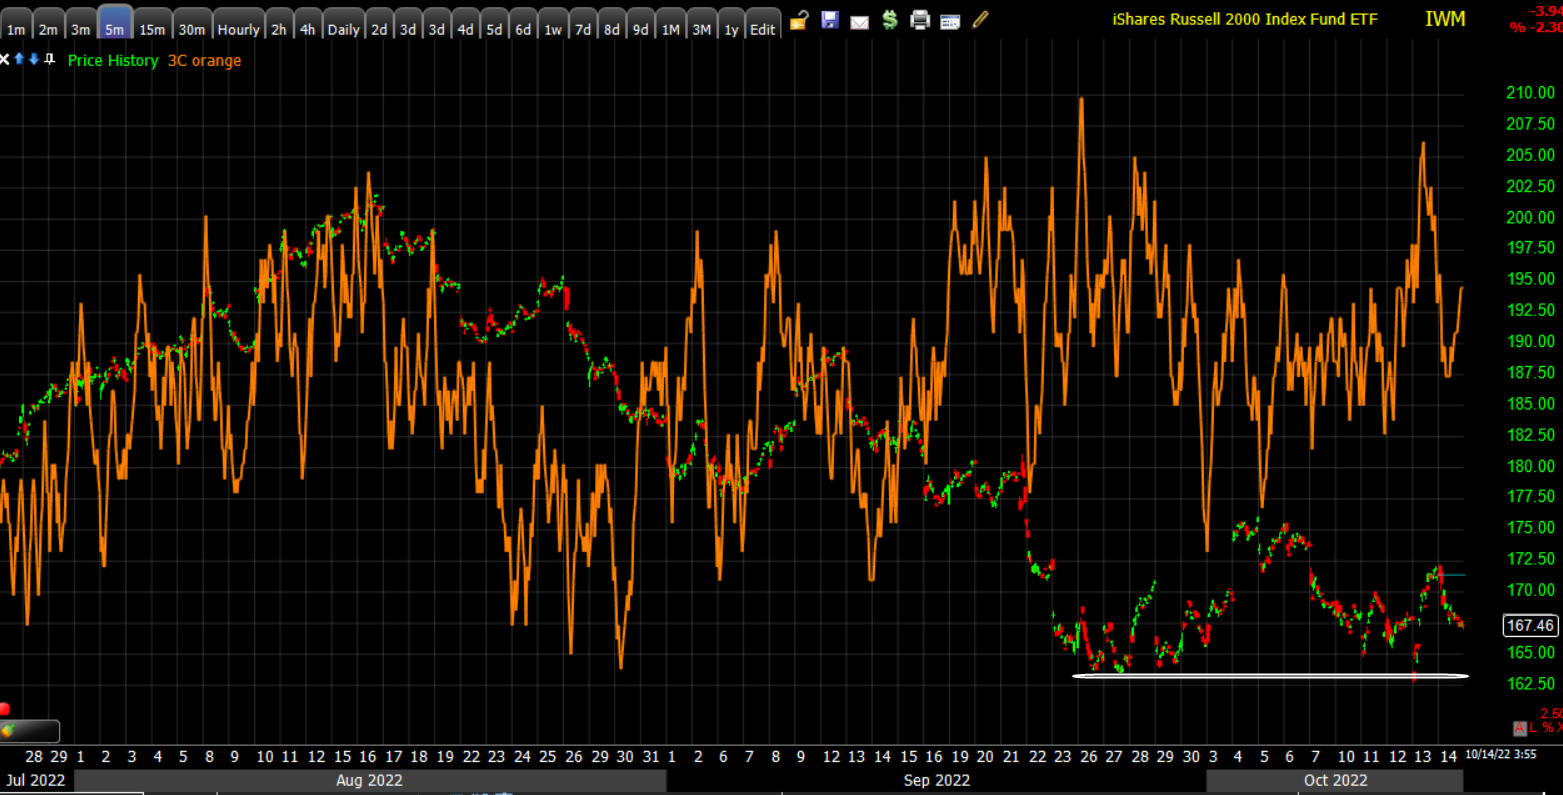 IWM (5m)
It was SPY’s 3C chart though that first alerted me well before price action or any breadth indicators that something may be changing…
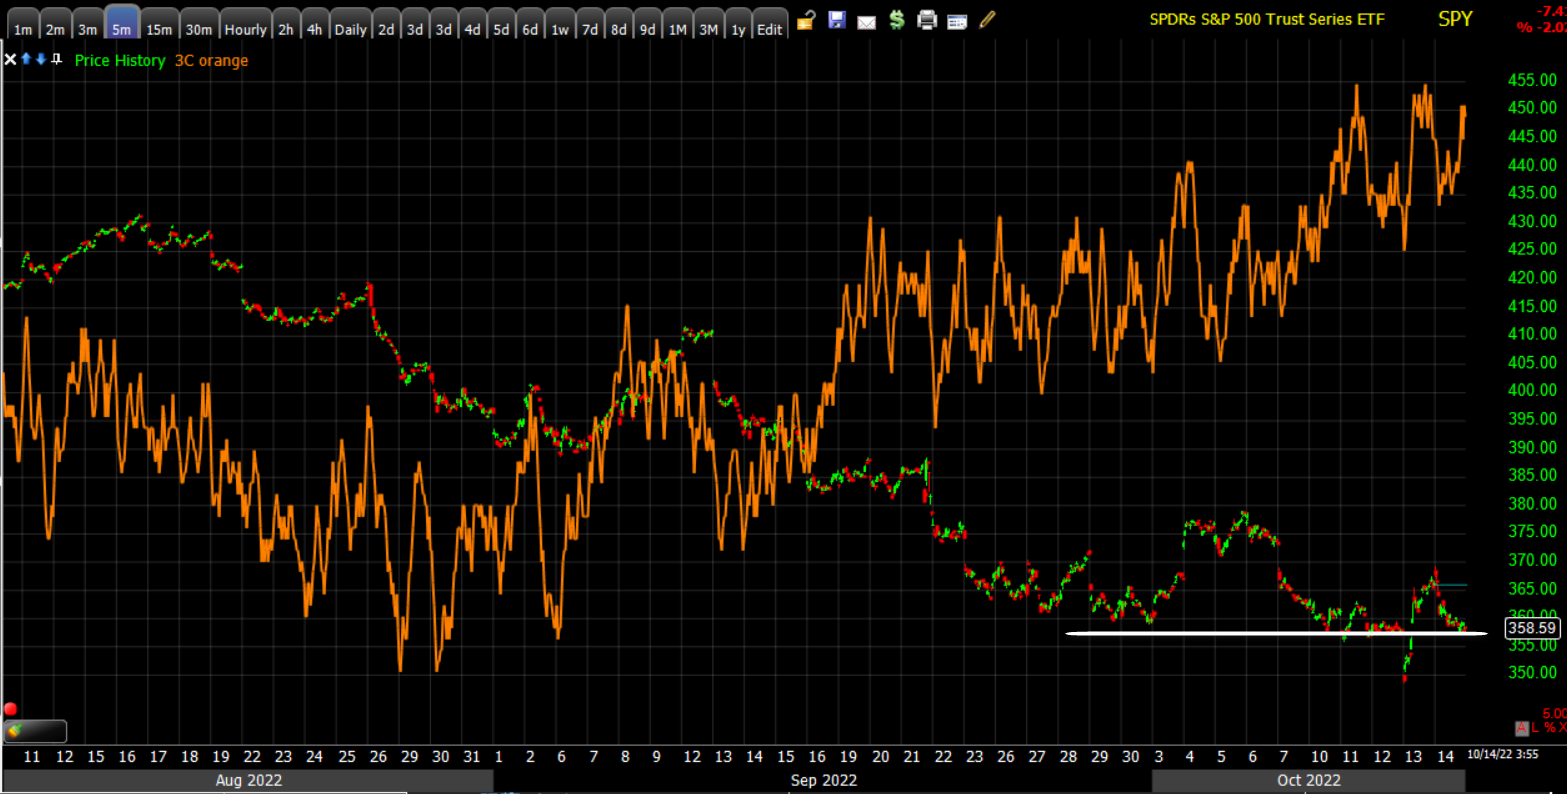 SPY (5m)
Market breadth has been improving in a number of ways as we have entered October or the approximate area of the second low of the “W” base. And then there’s the oversold readings, which have led to a rally or bounce every time this year.
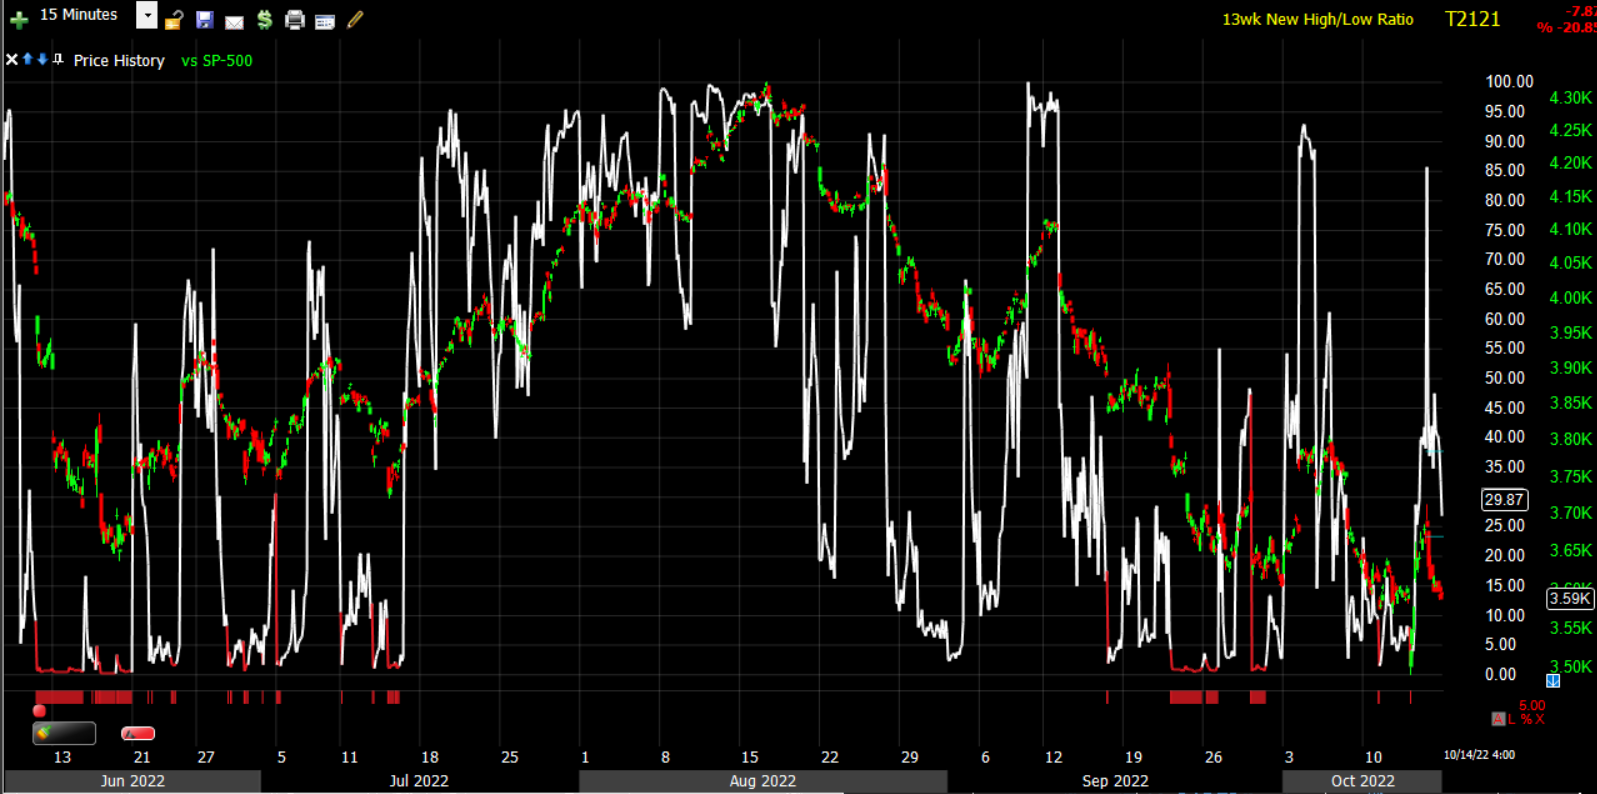 Sp-500 (15m) and oversold in red. The last oversold rally saw the S&P gain 19%
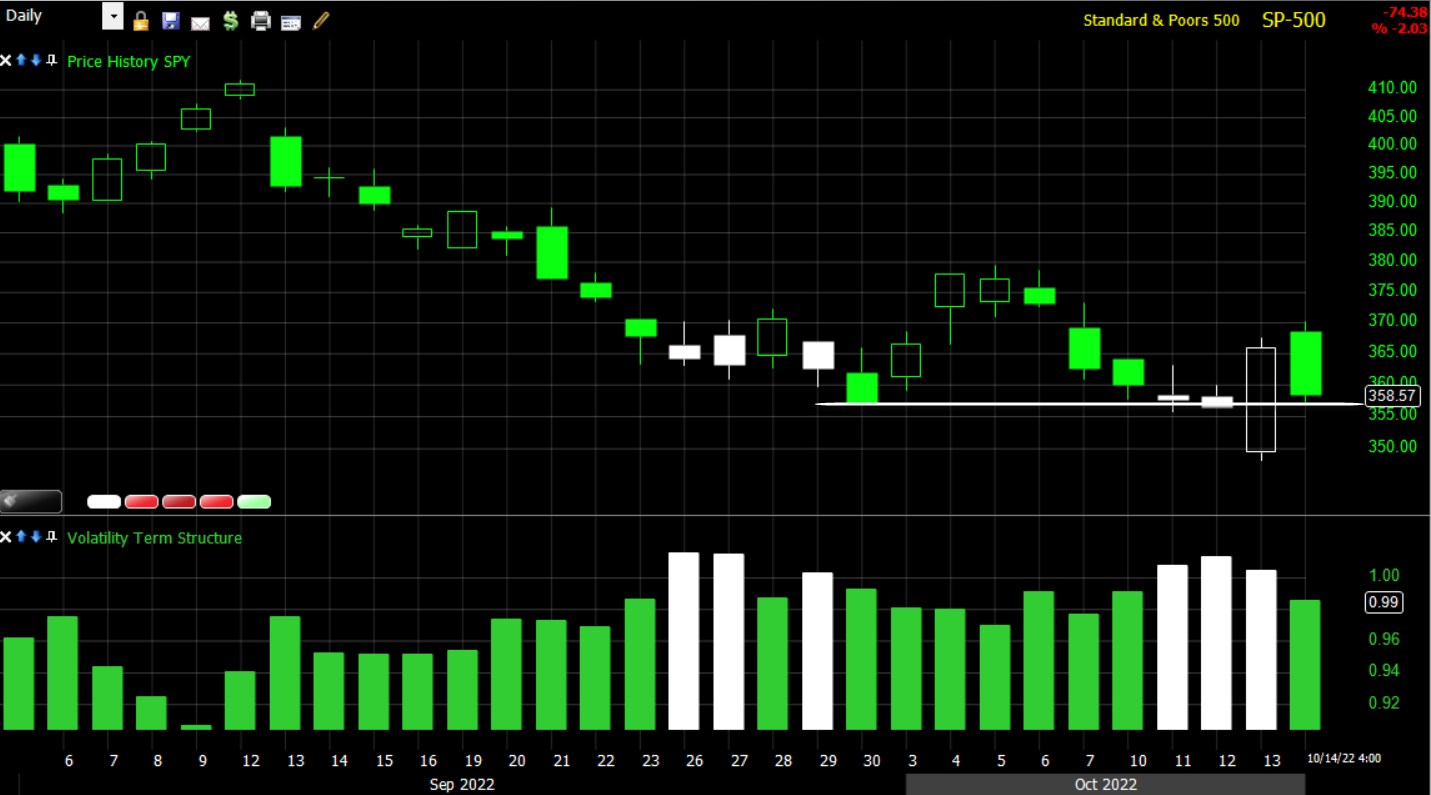 Then Term structure inversion, an extreme fear signal that’s also contrarian 4 of 5 times on average.
These are all just probabilities, but the probabilities have been shaping up to allude to something more than the primary downtrend continuing without interruption.
We still need to see the Dollar come down or at least consolidate, and it’s failure to make a higher high on CPi suggests that it at least consolidates.
We also need to see yields come down to support any market bounce/rally beyond a day or two. I don’t think that will be completely resolved until the market doesn’t have so much focus on events in the UK or they are resolved, but we’re very close to that trend line being broken as it has been tested several times this week.
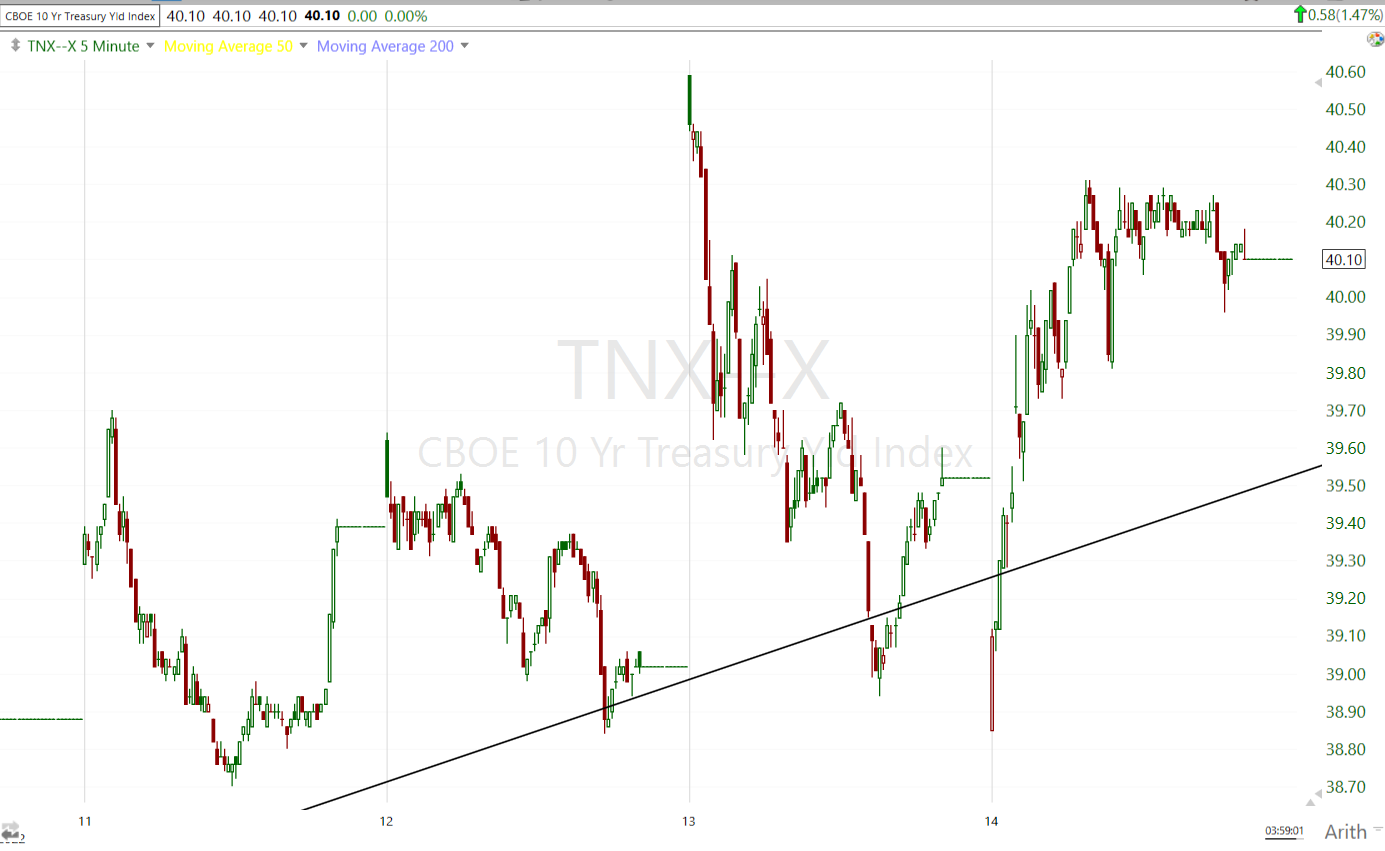 10-year yield testing under the trend each of the last 3 days, currently around 3.95%.
And then we have the longer term macro levels like S&P’s 200-week…
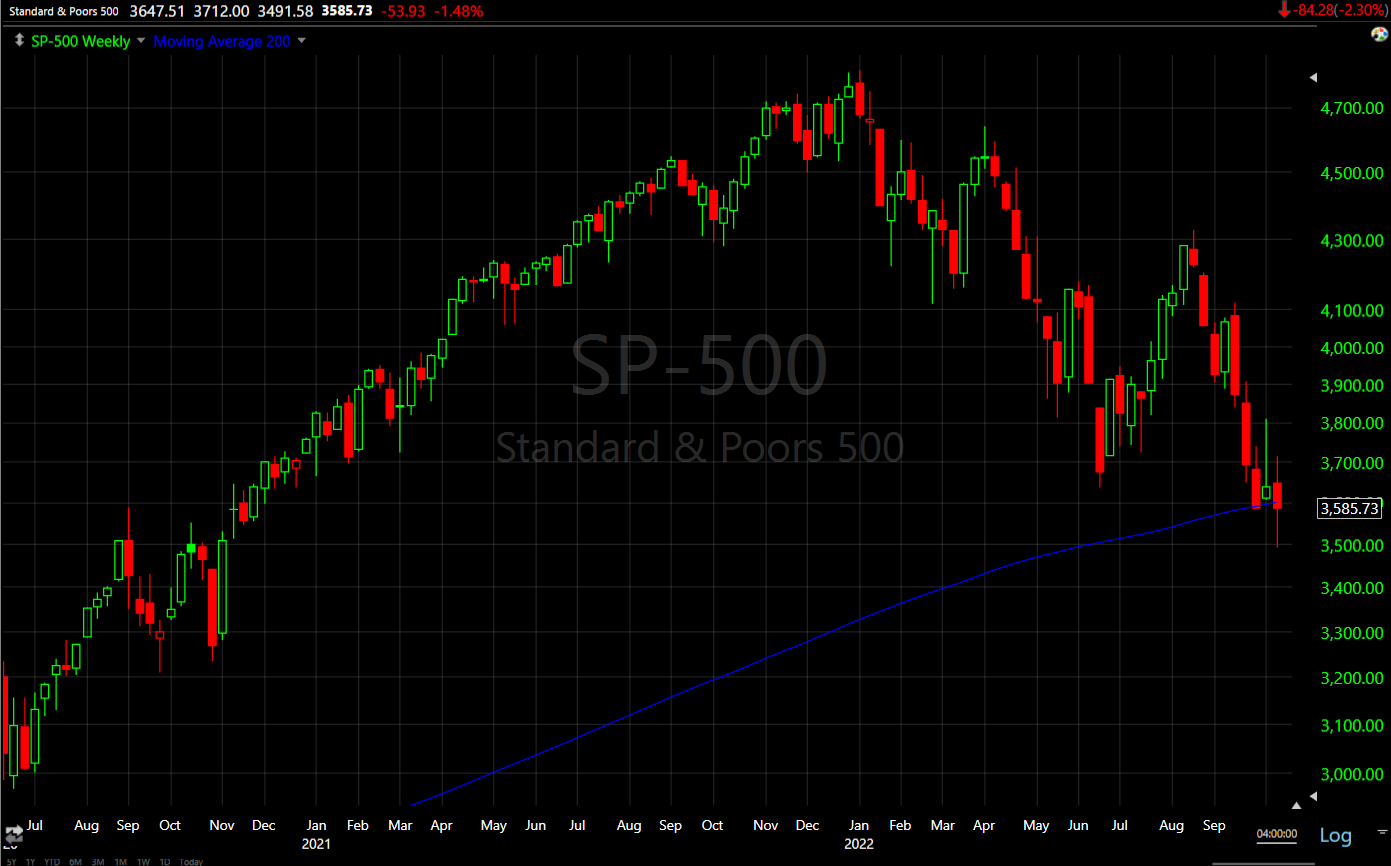 SP-500 200 week
And…
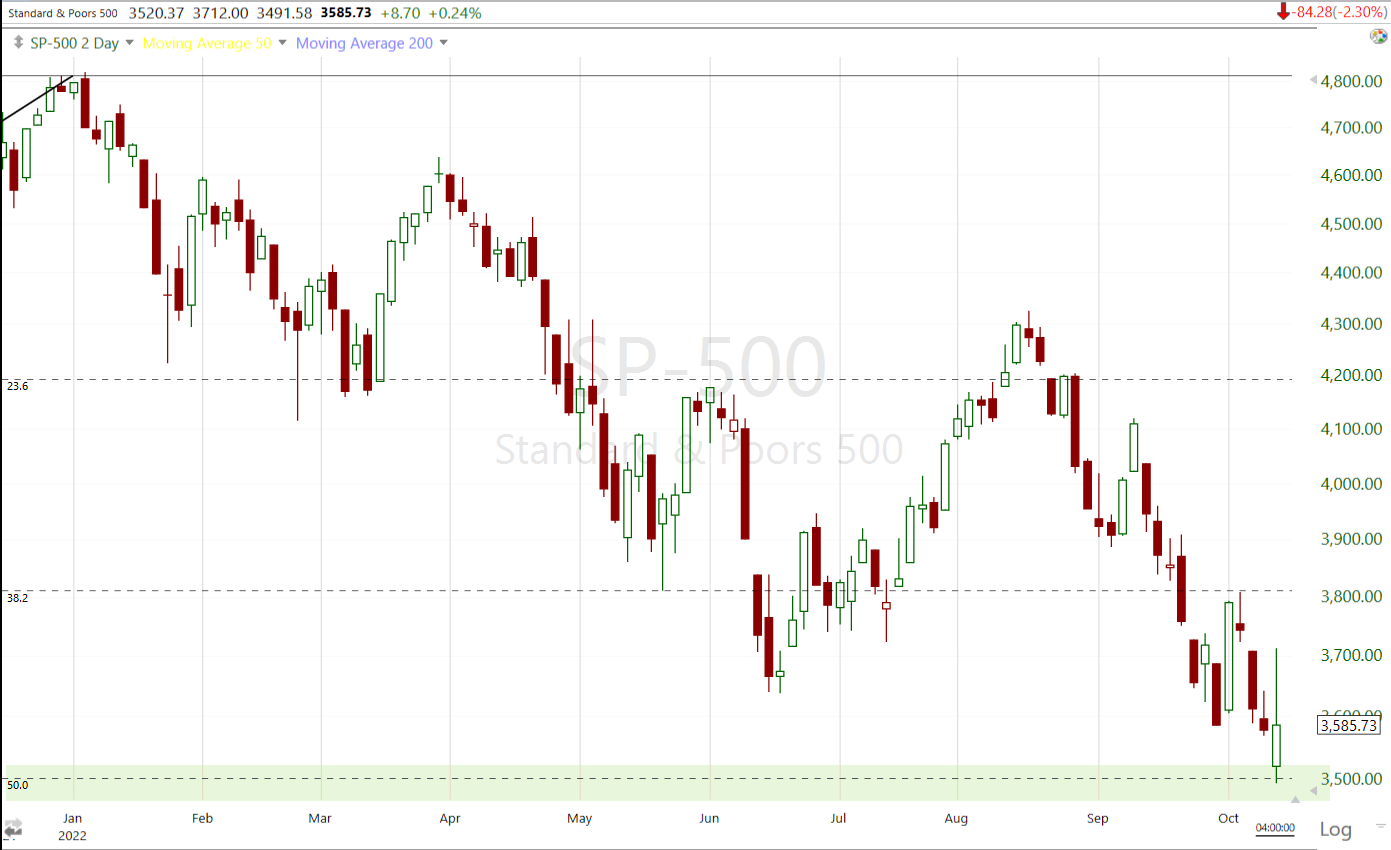 The S&P’s 50% retrace off the COVID crash lows.
This is all about probabilities and how they shape up. We’ve had some times like the June low to August high rally of 19% when there were certain probabilities like HY Credit that were stronger than now, but I can’t think of a time this year where we’ve had so many probabilities align suggesting a change in trend (and there are 3 trends, up, down and sideways). That said, we have the additional uncertainty of earnings season next week as it officially kicked off today. However, I think there’s good reason to take these probabilities serious.
To reiterate, I lean toward a more lateral trending market in a wide range, perhaps 20% or so which is excellent for swing traders. I would move those probabilities up from 50/50 last week (which is still high given there was a 100% primary downtrend in effect) to 60/40 favoring a change in trend. I think the potential of this being a market bottom have about a 2 to 5% probability and the probability of a new bear market low (whether later this year or early next year) are at 85%.
We’ll see if next week adds to the current probabilities. I think that will depend on the Dollar and UST yields coming down.
Have a great weekend! I’ll see you Monday.