
Market Analysis (Jan. 30, 2024) – Mega Caps Stating To Falter
*Below you’ll find the subscriber “Daily Wrap” nightly post for January 30th, 2024. Being we have the FOMC/Fed policy decision, I thought this was a great time for a broader market update. I hope you find it useful. Enjoy!
There was not a lot of conviction on either side of the tape today with the Fed tomorrow, plus we get other tier 1 economic data and the second half of the Treasury RFA, and some important earnings after the bell. While there wasn’t a lot of conviction, there were themes. Today’s wishy-washy trade was also consistent with yesterday’s 1-day overbought internals.
Relative weakness in mega cap and semiconductor-related stocks weighed on the S&P 500 and NASDAQ-100 as participants waited on earnings results from influential names in both spaces this afternoon. Further adding downside pressure to the group was better than expected economic data today, which logically you’d think is good news for the market, but it lifted Treasury yields and if we know one thing about the market since March 2022, it’s that it does not like higher yields.
It seems illogical, but good economic news is bad news for the market, and bad economic news is generally good news for the market, which is entirely because economic news moves yields and yields are the primary correlation/driver of equity direction for almost 2 years.
Economic data largely came in better than expected, but as touched on above, since the market is putting its misplaced bullish hopes on rate cuts, the good economic news was bad news for the aggressive rate cut timing the market has already discounted (i.e.- rallied on), which sent the Fed sensitive 2-year yield higher and weighed on stocks.
- The January Consumer Confidence Index climbed to 114.8 in January (consensus 113.0) from a downwardly revised 108.0 (from 110.7) in December. Meanwhile, the JOLTS Report showed 9.026 million job openings in December, up from 8.925 million in November. While the JOLTS Job openings headline print was a solid beat, the devil is usually found in the details. The “Quits” dropped to pre-pandemic levels. The quits rate has been much higher in recent years because employees felt comfortable they could leave a job for a better, higher paying job. The “quits” level suggests that “workers’ willingness or ability to leave jobs” is considerably lower, which would actually be a sign that the labor market is not as strong as the headline number suggests.
While this chart is not the JOLTs quits, but non-Farm Payrolls’ quits data and last month’s data at that, it illustrates the point.
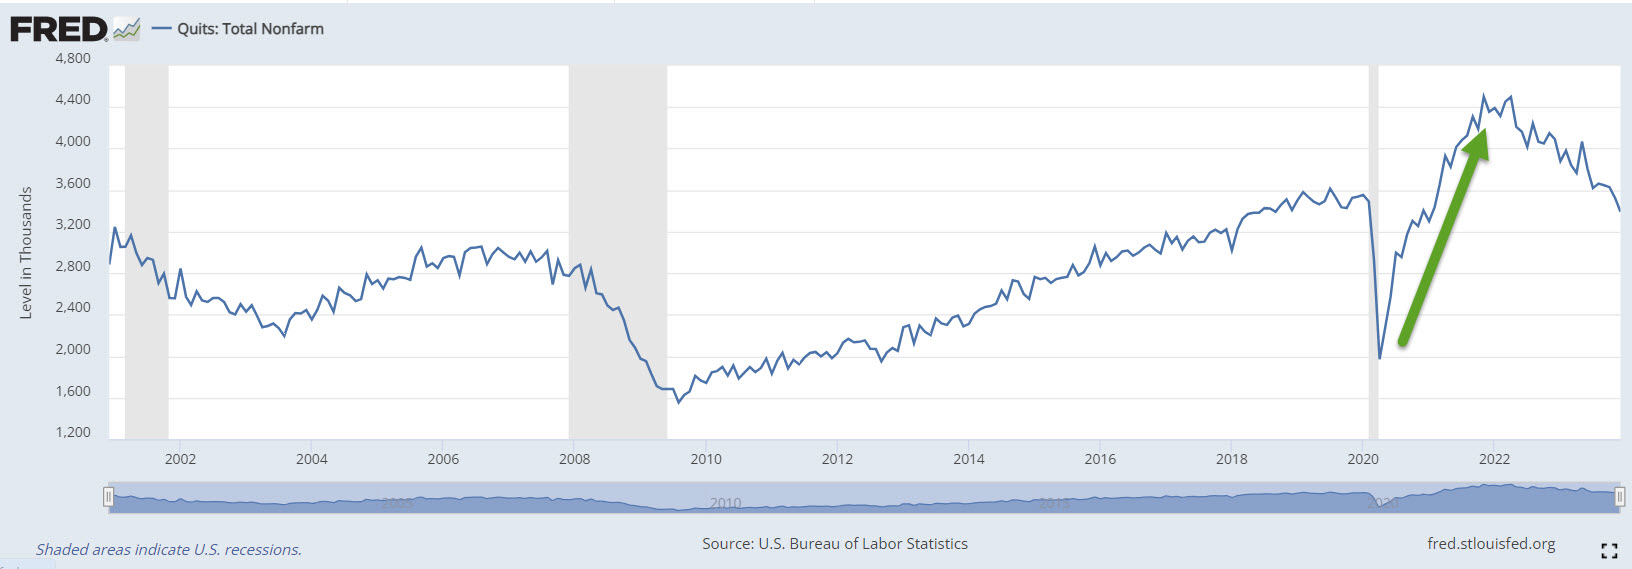 The quits rate was rising as a new economic cycle began in the wake of the COVID locks down as employees found it easy to transition to another higher paying job (green arrow). I always find this data more relatable if you put it in personal context. In another life I worked for someone and was very good at what I did. I was frequently contacted by other companies offering me more more money. My employer was eager to keep me onboard and matched or exceeded what I was offered by other companies numerous times. While I didn’t realize it until many years later, those visits by other companies looking to recruit me were far less frequent as the economy went south.
- Home price appreciation slowed, according to Case-Shiller
- Consumer Confidence jumped higher with ‘current conditions’ hitting the highest since pre-COVID-lockdowns. This likely largely reflects lower rates over the last several months making mortgages more affordable and the trend of lower oil and gas prices over the period of the survey.
Averages
The 3 major averages were mixed with a downward bias today. The S&P was flattish, while Dow Industrials outperformed led by its financial components: JPM (+2.05%), GS (+1.65%), AXP (+1.65%) and V (+1.3%) which were four of the top best performing Dow stocks today. The worst 3 performing Dow components today were Apple (AAPL -1.9%), Intel (INTC -2.1%), and Boeing (BA -2.3%).
Meanwhile, Dow Transports (-1%) notably underperformed. Dow Transports have recently shown weak intraday price action much like Small Caps with the last week seeing numerous opens near session highs and then price faded the rest of the day (covered in the Early Update this morning). This further widens the relative performance divergence between Dow Industrials and Dow Transports which I’ll touch on more below.
NASDAQ-100 underperformed as the Technology sector was the second worst performing S&P sector. Semiconductors (as seen with Intel within the Dow), underperformed even the broader Technology sector.
While Financials were in favor today, that didn’t extend to the smaller Regional Banks that have a large representation in the Russell 2000.
S&P-500 ⇩ -0.06 %
NASDAQ ⇩ -0.68 %
DOW JONES ⇧ 0.35 %
RUSSELL 2000 ⇩ -0.76 %
From a price-only perspective, I still can’t fault most of the averages’ price action, although when you look at price and volume it should be worrisome for bulls as the trend since mid-December has been to rally on declining volume and pull back on heavier volume. Today didn’t change either trend.
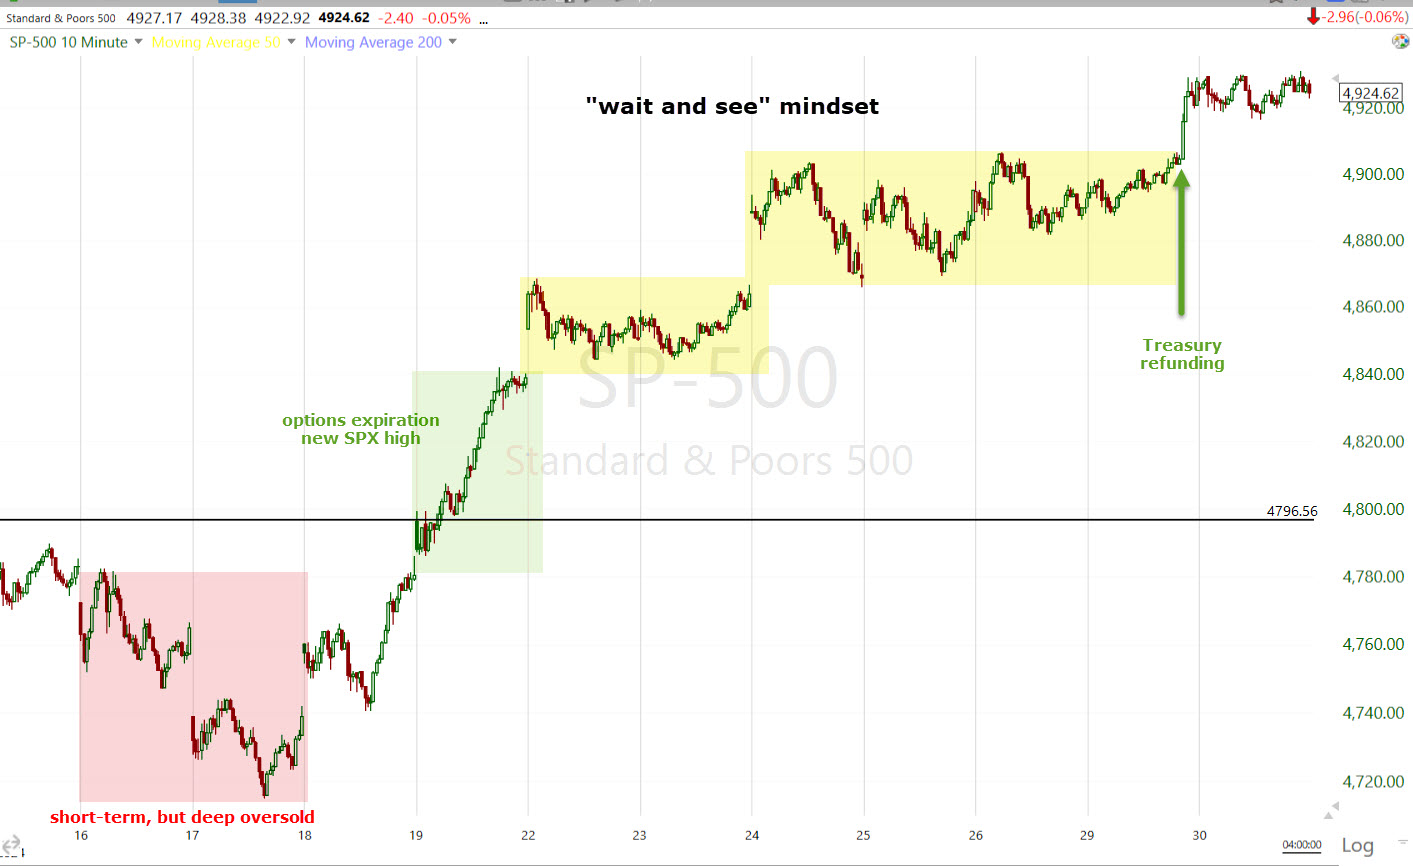 SPX (10m) and recent trade with notes of key events/drivers of price.
The two averages that don’t look as good are Dow Transports and Small Caps with the former worse than the latter. This all goes back to what I pointed out last week. If you look at longer term price charts, then the two look like they’ve been in bullishly biased consolidations, but when you look at more granular intraday data you see a trend of both averages (in the last week or so) opening near the highs of the day and fading lower the rest of the day. That’s not something typical of a bullish price consolidation.
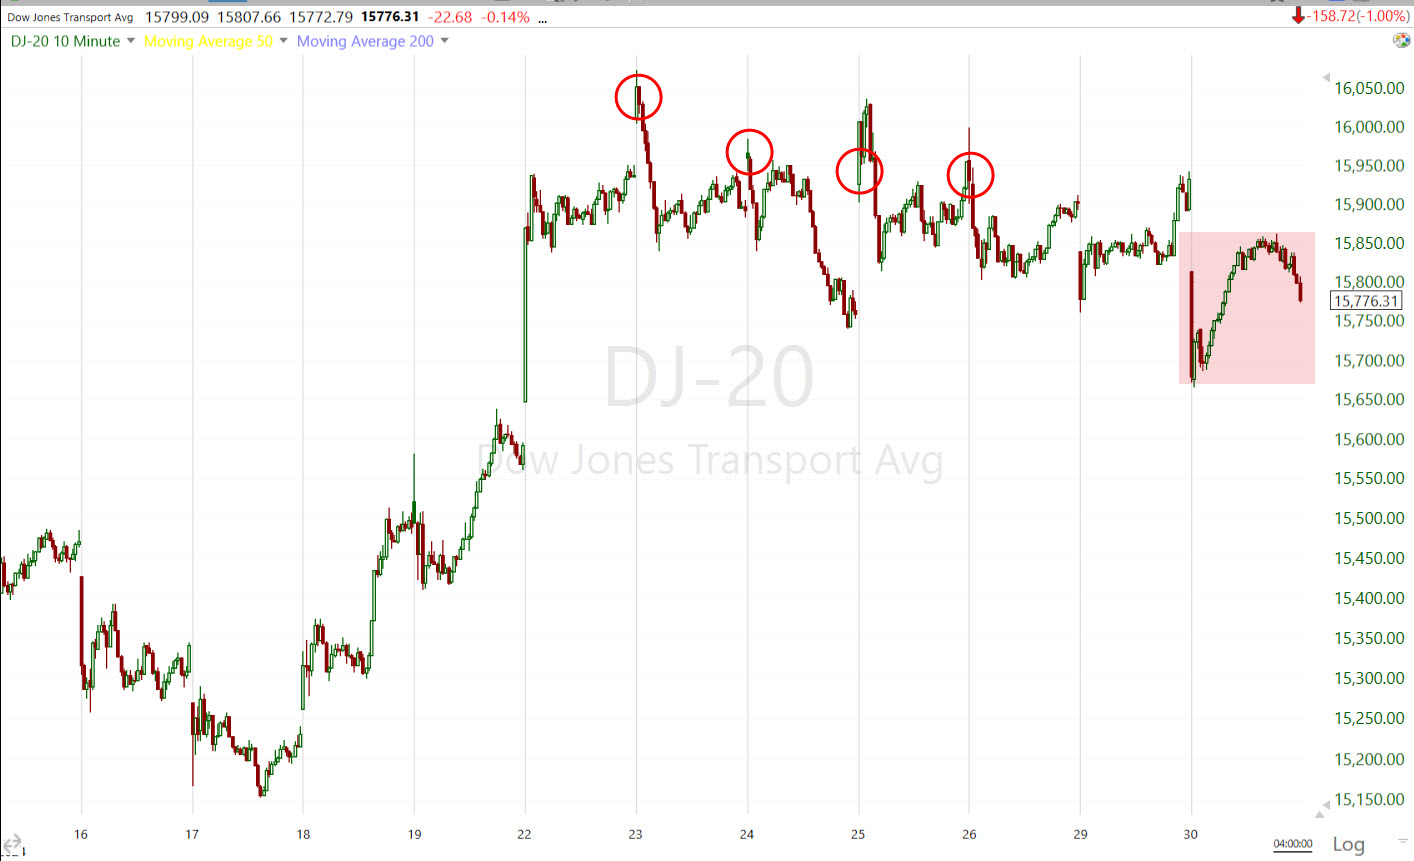 Dow Transports (15m) with last week’s opens (red circles) and fading. And today looking like the price congestion pattern may be starting to break down. If so, that’s going to increase the divergence or non-confirmation between the DJIA and Transports even more and it’s already huge.
Almost all of the concepts I use are fractal so you can use them whether you are a long term investor or a day trader. Last night I showed you how Transports more often than not lead Dow Transports with this chart. Now I’m going to show you the shorter term fractal version of the same using the exact same timeframe as the DJIA above (see the SPX chart with notes for the key price driving events), coming off the short-term, but most deeply oversold reading we’ve seen in 5 weeks.
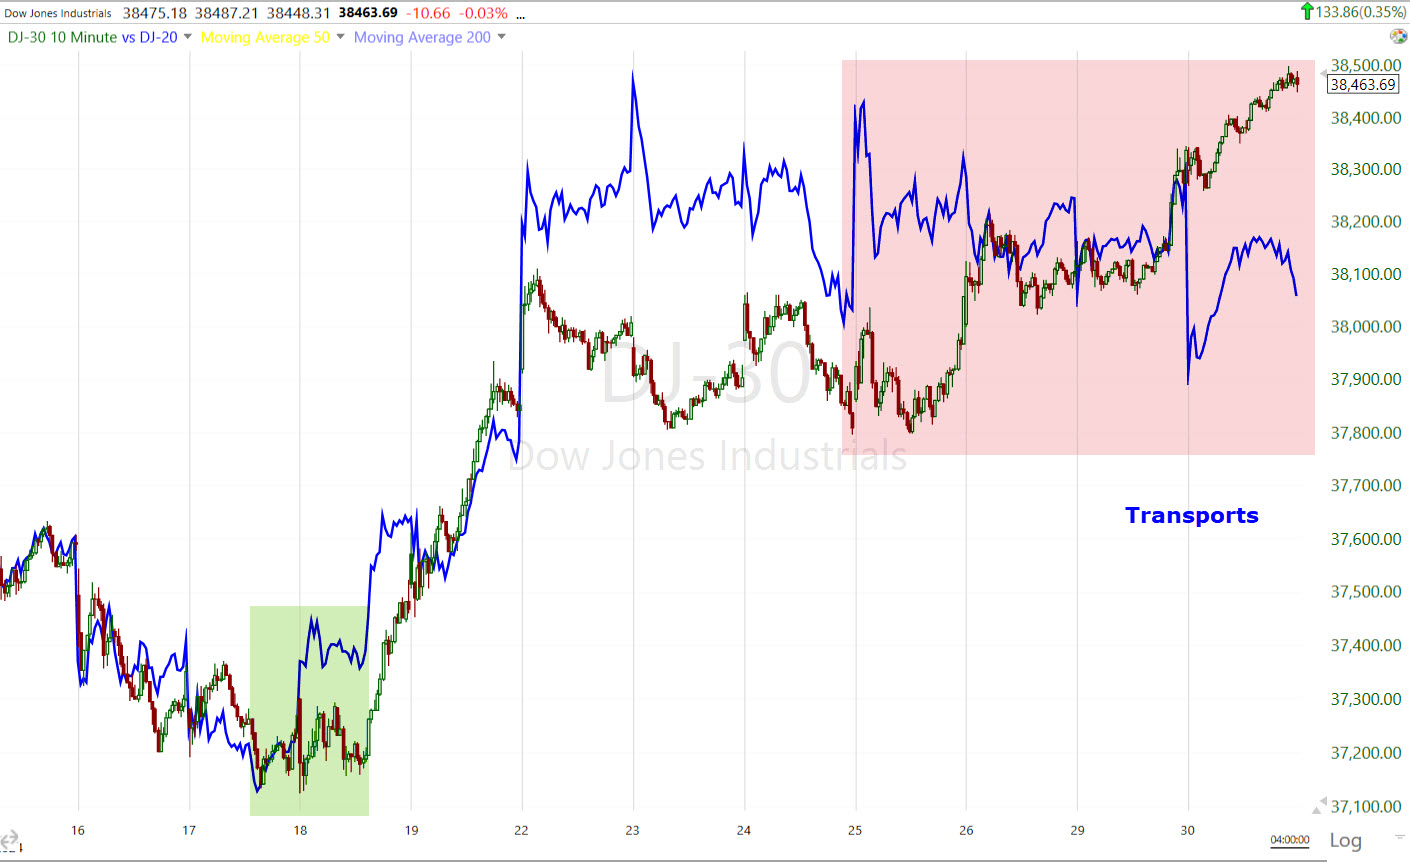 DJIA and Transports (10m) – Remember that this is not the big picture outlook, but an example of Transports leading the DJIA even on a shorter timeframe over a shorter period – the “fractal nature” of the concepts I use.
Transports lead the DJIA higher off Jan 17-18th’s short term deeply oversold low and now are starting to lead the DJIA lower. The absolute price-percentage change is irrelevant as each asset/stock/averages has its own beta. What’s important is the relative performance. Just look at how the Transports make a higher low at the 18th relative to the Dow, and lead higher (shaded green); and now how Transports are making a lower high over this period (shaded red).
I’ve talked quite a bit about how Dow Industrials and Dow Transports “should” confirm each other. This is not my own observation, but part of Dow Theory by Charles Dow who died in 1902. The Dow Industrials are not as “industrial” as they were a century ago. For example, the Dow Industrials is now filled with companies like Untied Healthcare (hardly an industrial), and Apple, which is much more a tech company than an industrial, but it is a producer of goods.
The gist of Dow Theory is that Industrials — which produce goods– and Transports — which deliver those goods — should confirm each other. In today’s vernacular, if Apple produces products, the shipper that ships those products should be doing equally as well (on a relative basis). If Transports don’t confirm Industrials, then there’s a disconnect in the economy. I’ll grant you that Dow theory is not as relevant today as it was a century ago, but from 2 decades of personal observation, I can tell you that it’s still very relevant.
Today we were given a real world, real-time example with United Parcel Service’s (UPS -8.2%) earnings. UPS earnings saw a steeper than expected revenue drop. UPS announced massive layoffs this morning – some 12,000 jobs or about 14% of its 85,000 management jobs, will be cut. More to the point, Chief Executive Officer Carol Tomé was quoted on an earnings call by Bloomberg as saying job reductions were due to sliding package demand and soaring union labor costs. The key phrase in this is “sliding package demand”. UPS is a Transport. If the economy is robust and demand for good is high, why is UPS seeing sliding package demand? Transports not only deliver finished goods and product, but supplies as well, so relative weakness in Transports can reflect either (or both) lower demand for materials from producers for use in finished products, and lower demand for finished products by consumers. Either is a yellow flag warning sign.
This really gets to the core of the Dow Jones Industrial and Dow Jones Transports’ relative price divergences I’ve been commenting on now for a couple of months. Something ain’t quite as pretty as the equity market believes.
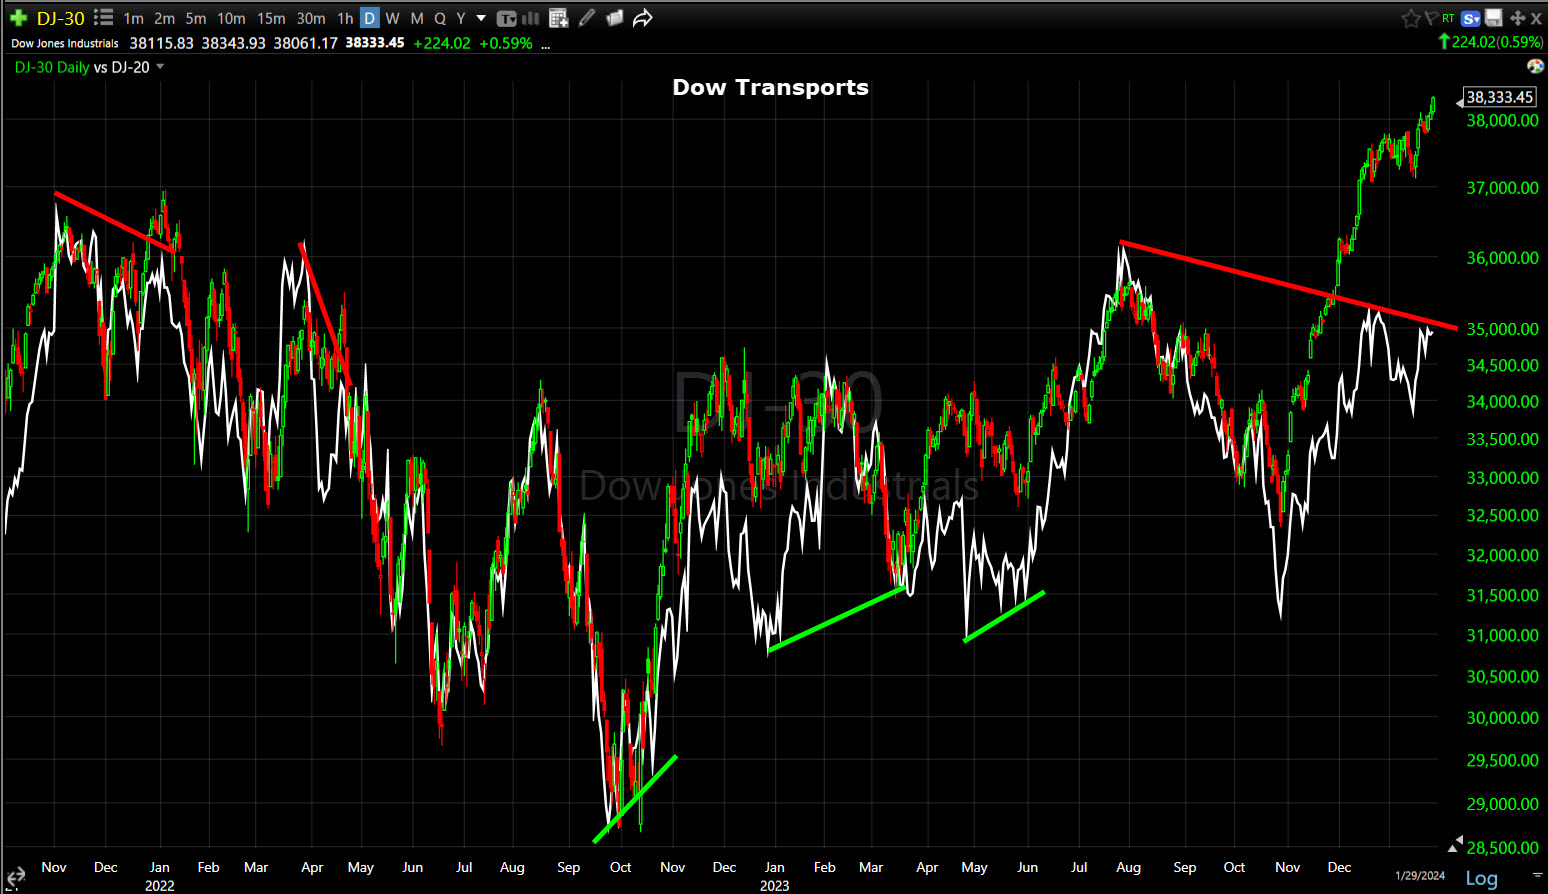
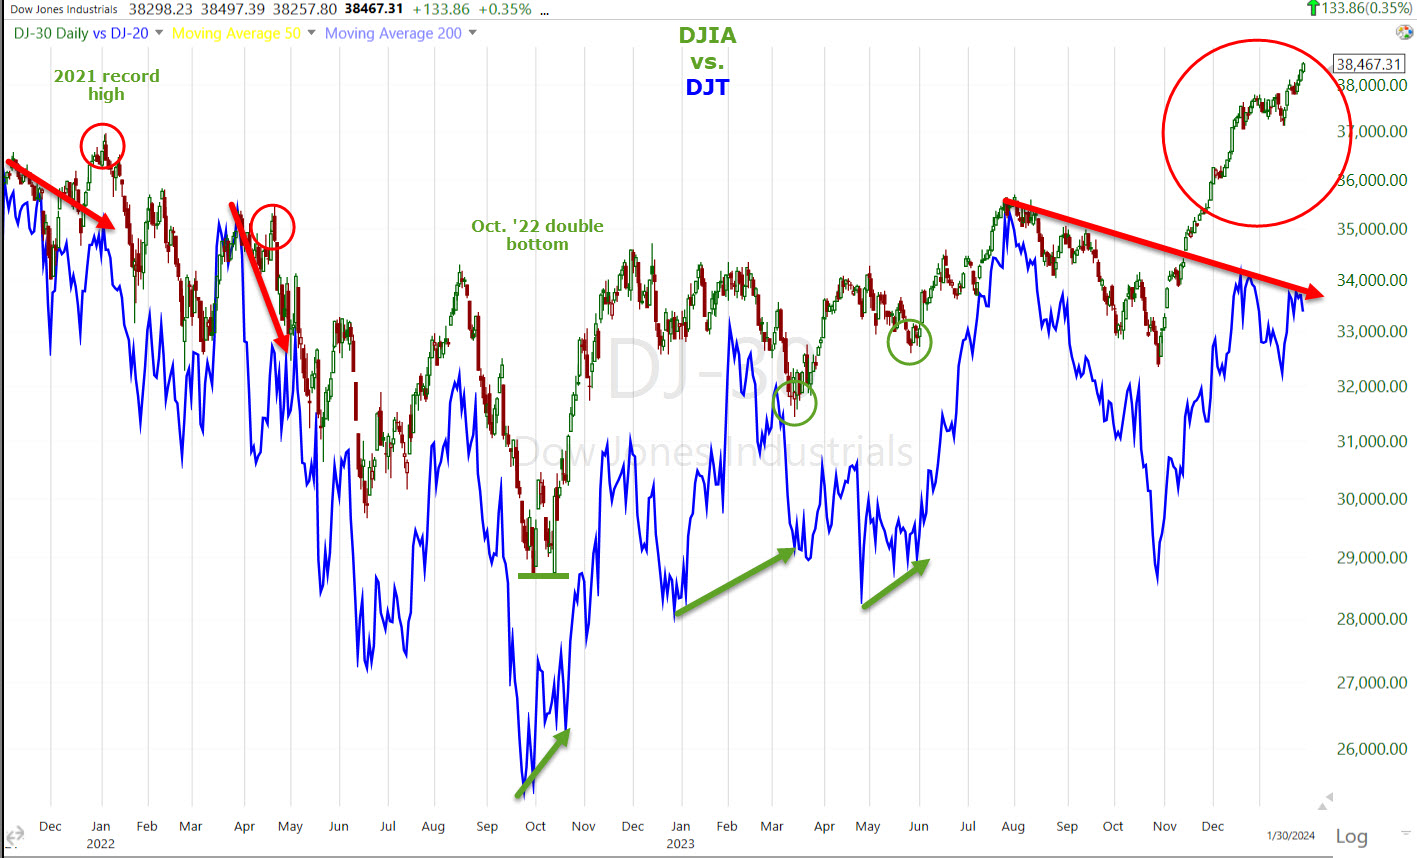 DJIA / DJT (daily) relative performance with Transports leading the DJIA both higher (green) and lower (red) via relative price performance divergences. Just look at the size of the DJT negative divergence at the all-time record highs in early Jan. 2022 and the size of the DJT neg. divergence now!
Another key divergence that I used at the time is Transports relative strength at the October 2022 bear market lows which launched the rally the market has been in ever since. If we looked from a more granular perspective, I could point out another half dozen instances on this chart alone of Transports leading the DJIA at key price pivots.
We did not see any short covering follow through from yesterday’s modest uptick in covering on my Most Shorted Index (which lifted the MSI yesterday just above the MSI’s high of last week).
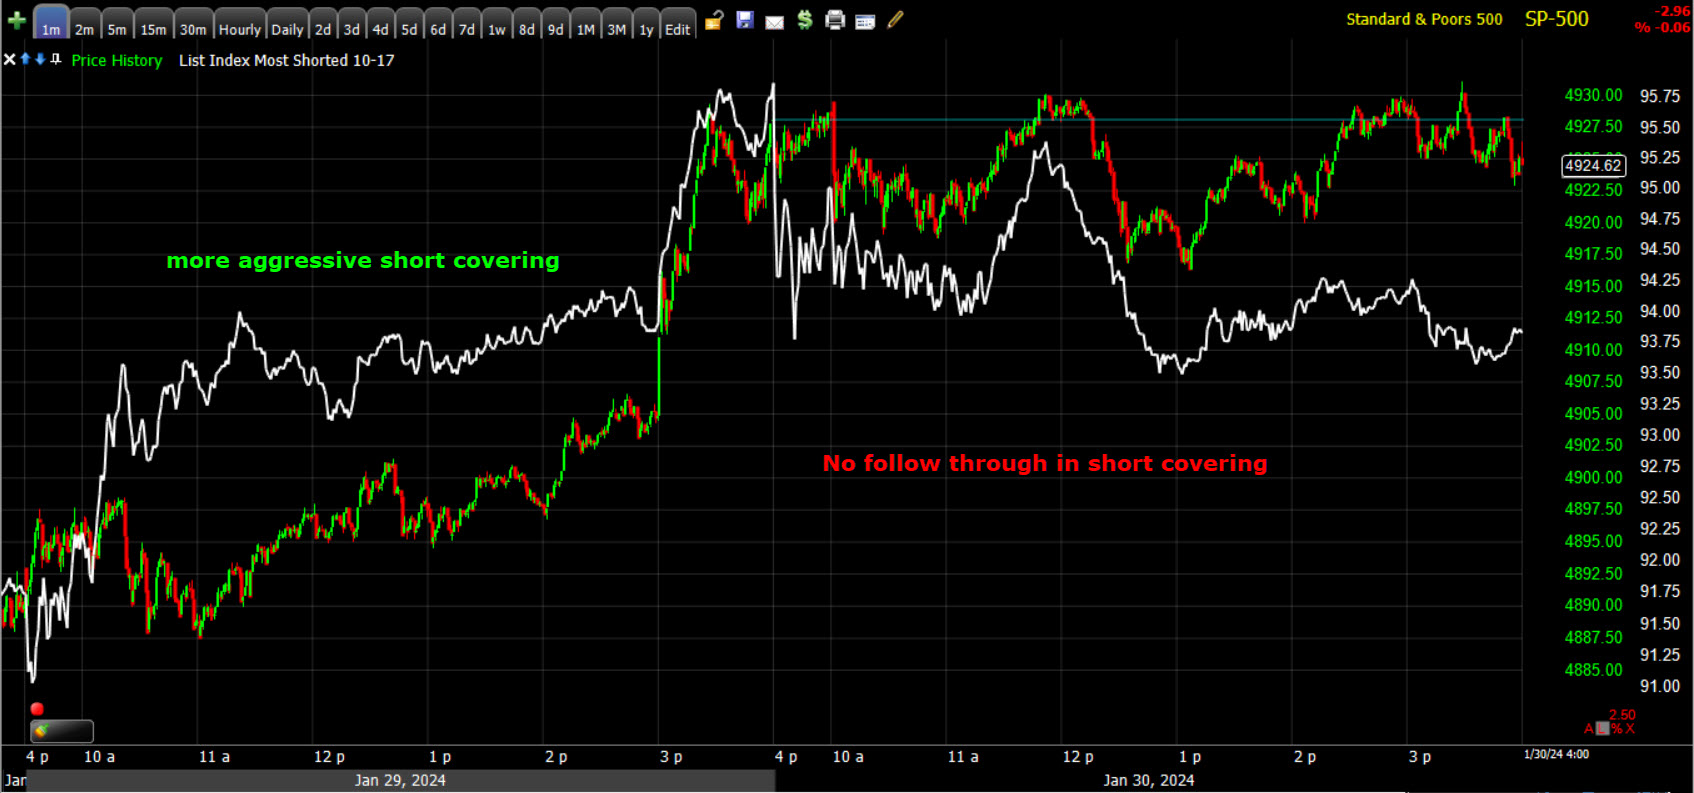 SP-500 (1m yesterday and today) and my Most Shorted Index. The lack of short covering follow through weighed on Small Caps today despite the Financial sector, and many cyclical and value stocks relative strength today.
VIX (-2.1%) opened acting normally, but faded from the open in typical pre-FOMC VIX selling pressure that starts around a day before major Fed events. Today’s modest relative weakness in VIX did nothing to change the large trend of VIX relative strength vs the SPX seen since mid-December. It’s so obvious now that in last night’s Daily Wrap, I didn’t even bother to invert the SPX’s price vs. VIX as the trend stands out.
S&P sectors
Six S&P sectors closed higher and 5 closed lower. There was a little more strength in the cyclicals today with Financials and Energy at the top of the leaderboard and the only two sectors up more than a half percent. Energy rebounded with Crude Oil prices today, just as it fell with crude oil prices yesterday.
The Financial sector outperformed, but when it came to banks, there was quite a disconnect.
The KBW Bank Index gained +0.9%, but Regional Banks lost -0.4%… a 130 basis point difference, which in part accounts for Small Caps’ relative weakness today. Another factor accounting for Small Caps’ weaker relative performance was the lack of follow through on yesterday’s slight uptick in short covering in my Most Shorted Index (MSI) as seen above.
I can’t be sure from a single day, but the Fed already officially announced that it is ending the BTFP (Bank Term Funding Program), enacted in the wake of Silicon Valley Bank’s failure over a period of 48 hours. The BTFP is ending on March 11th.
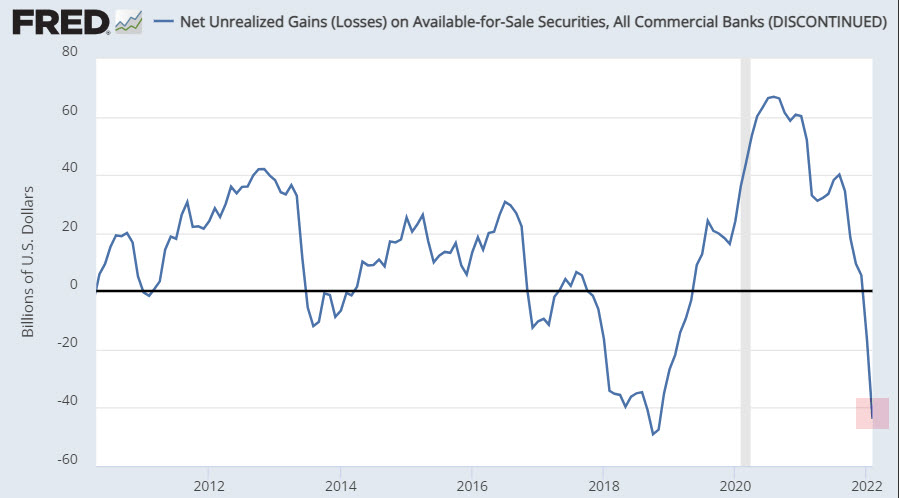
The Fed conveniently discontinued the data series, “Net Unrealized Gains/Losses On Available For All Securities, All commercial Banks” in March 2022 when they started their rate hike cycle. These are assets banks hold (mostly Treasuries and MBS) that they can pledge as collateral, but when a bank buys 10-year Treasuries at a yield of 1% to 1.5% as the Fed had had the Fed Funds Rate at ZERO for 2 years after the COVID lockdowns, those assets on the banks books are severely impaired. They can’t sell them to raise liquidity without taking massive losses, which was one of the key issues SVB faced during a 48 hour bank-run. The Fed created the BTFP to allow banks to pledge those impaired assets as collateral at Par rather than on a mark to market basis to prevent huge losses. Here’s what the banks unrealized losses looked like as of February 2022 when the data series was discontinued (I wonder why? -sarc.).
 Source: St. Louis Federal Reserve
Remember that this data series shows the banks’ unrealized losses (as they had not sold the assets, and if they had, they’d have taken a huge hit) was discontinued right before the Fed started hiking rates. As of March 2022, just before the Fed started hiking rates the yield on the 10-year was around 1.75% to 1.80%. The 10-year is at 4.06% today. Bond prices move opposite yields, so as bad as the banks’ unrealized losses were then, can you imagine how bad they are now? That almost certainly explains why the Fed discontinued the series a month before starting rate hikes.
Remember that I reached out to the St. Louis Fed and asked, “Why did you discontinue this series?” Here’s their reply to me…
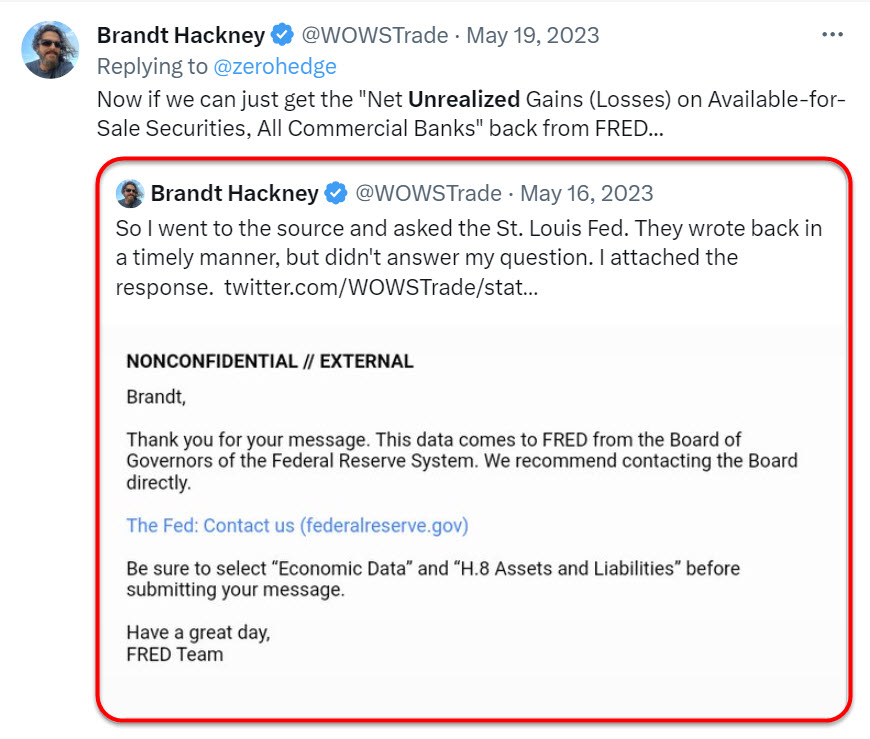
The keepers of the data could not tell me and I had no luck trying to get an answer from the Board of Governors.
In any case, the point is, that huge liquidity hole on banks’ balance sheets, that the Fed plugged for a year to avert a contagion effect among banks as SVB was the second largest bank failure in U.S. history, is going to be front and center again, especially for the smaller Regional Banks come March 11th when the Fed discontinues the BTFP.
I don’t know if that is partly why we saw relative weakness in Regional Banks vs. lager banks today, as a day is not a trend, but come March if the Fed doesn’t do anything to address this issue we’ll be right back to the same circumstances that led to SVB’s 48 hour crash into oblivion. It’s not often that the KBW Bank Index and Regional Banks have such a wide disparity in relative performance as we saw today.
The mega-caps (MGK -0.6%) underperformed the S&P Equal Weight index (+0.05%) by 65 basis points, which isn’t a big margin, but looking at a few of the mega-caps price charts reveals uglier price messages than the mega-cap index portrays. We’ll take a look at a few below and then we have two mega-caps that reported tonight and received less than favorable responses in afterhours trade.
Semiconductors (SOX -1.6%) underperformed the Technology sector — which was the worst performing S&P sector of the day — by 80 basis points. Semis aren’t leading the Tech sector lower, but the AI narrative, which I think is an important development looking forward, is early in its infancy. Like the Dot.Com craze when keen investors knew the internet would change the world, there was still a phase when everything with a “Dot.Com” behind its name was bought regardless of potential. “AI” now feels a lot like “Internet” circa 1999. It’s going to be a life-changing technology, but no one quite knows what its going to change, how, and who the long term winners and loser are going to be and how to price it. There were more Dot.Com losers than winners when everything shook out, and a lot of investors indiscriminately buying internet stocks lost their shirts back then.
Materials ⇧ 0.46 %
Energy ⇧ 1.03 %
Financials ⇧ 1.26 %
Industrial ⇧ 0.04 %
Technology ⇩ -0.83 %
Consumer Staples ⇧ 0.56 %
Utilities ⇩ -0.03 %
Health Care ⇧ 0.23 %
Consumer Discretionary ⇩ -0.06 %
Real Estate ⇩ -0.93 %
Communications ⇩ -0.68 %
Looking more closely at the Mag 7 mega-caps…When you only have 7 Magnificent Seven mega-caps providing the market support and leadership, it’s a pretty big deal when two of them — Apple is the first — aren’t leading, but lagging.
For example, Apple (AAPL -1.9%) is the most influential stock in the world, yet it acted much worse than the broader group of Mag-7 stocks and it’s been acting increasingly worse over the last several days.
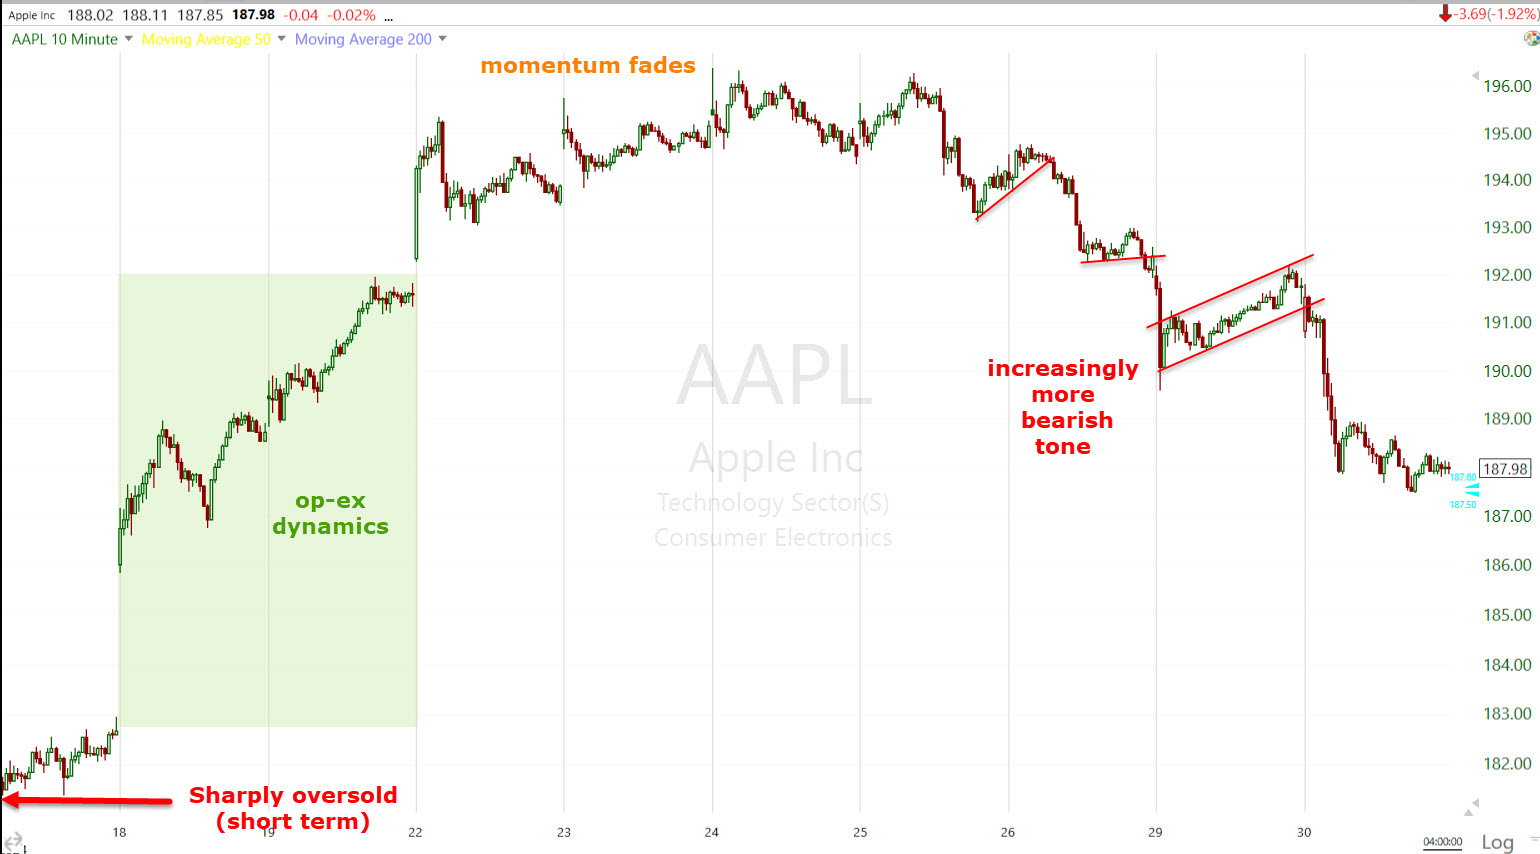 AAPL (10m)
And then there’s Apple’s lack of confirmation of any of the averages new record closing highs.
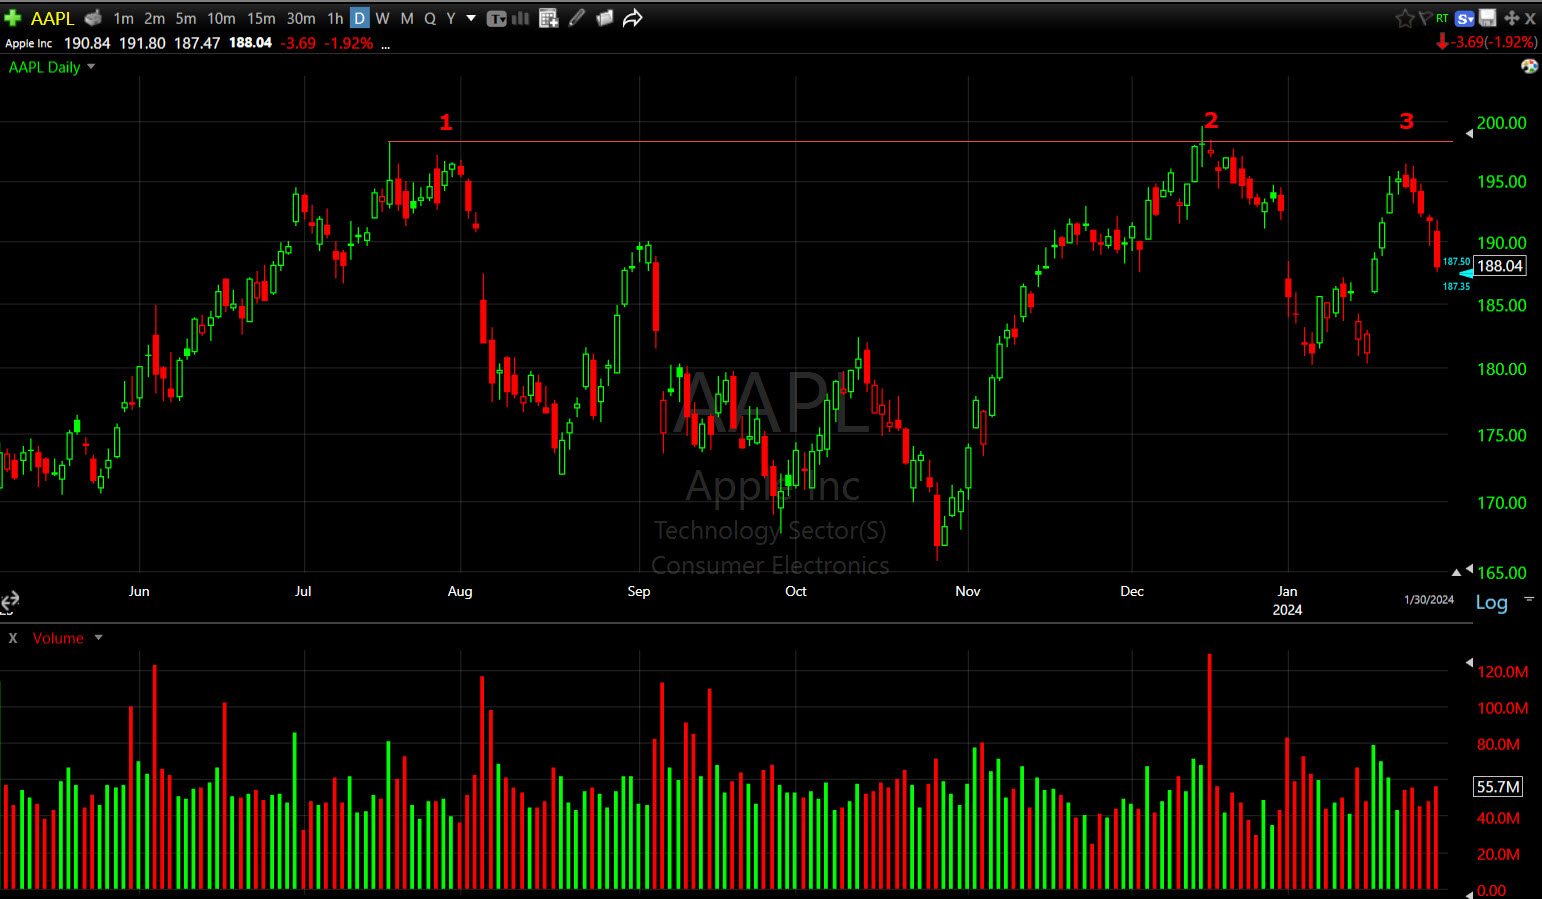 AAPL (daily) has struggled and failed to even trade above the July H&S top highs, much less make a series of higher highs with the major market averages. I want to say this is the most important stock in the world, but to be technically accurate, Microsoft’s (MSFT -0.3%) occasionally modestly surpasses Apple’s market cap – both around $3 trillion each. Still, I think the point stands.
Another one I’ve pointed out recently is Tesla (TSLA +0.35%).
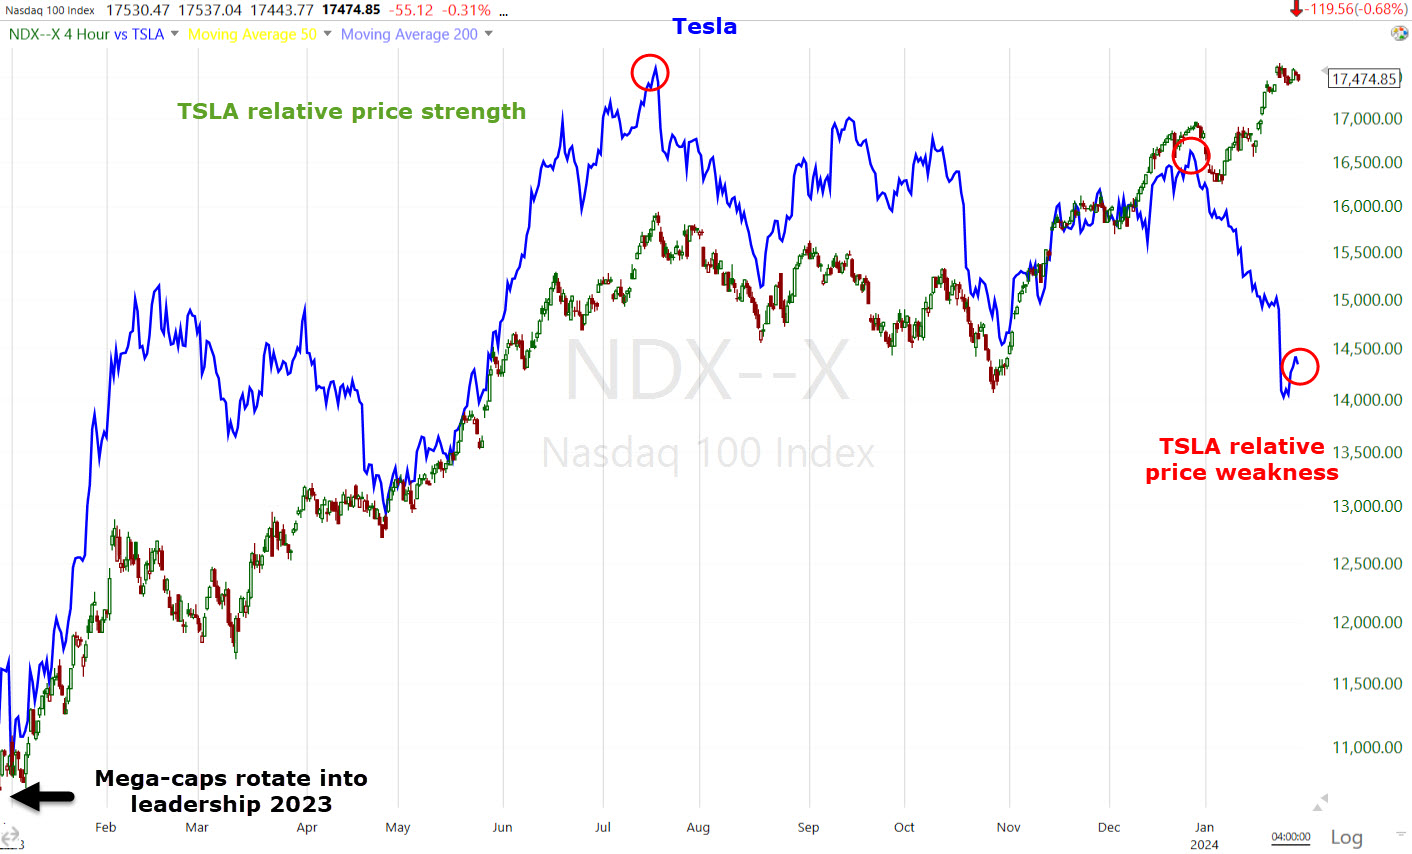
NASDAQ-100 vs. Tesla (4H) from the Jan. 2022 mega-cap rotation to leadership. Remember my late October video, Cracks, dealing specifically with signs there were cracks emerging in 2023’s sole leadership for the market? At that point I was seeing distribution cycles and some other bothersome signals, but after October we can see the literal cracks emerging, such as Tesla’s relative price trend weakness. Tesla fails to make a new closing price high with the NASDAQ-100, but even worse, and like Apple, Tesla can’t even make a higher high relative to the July market pivot high. More worrisome is the recent relative weakness in Tesla in the new year.
I pointed out Tesla’s price chart weeks ago, independent of relative performance considerations, and it was troubling on its own…
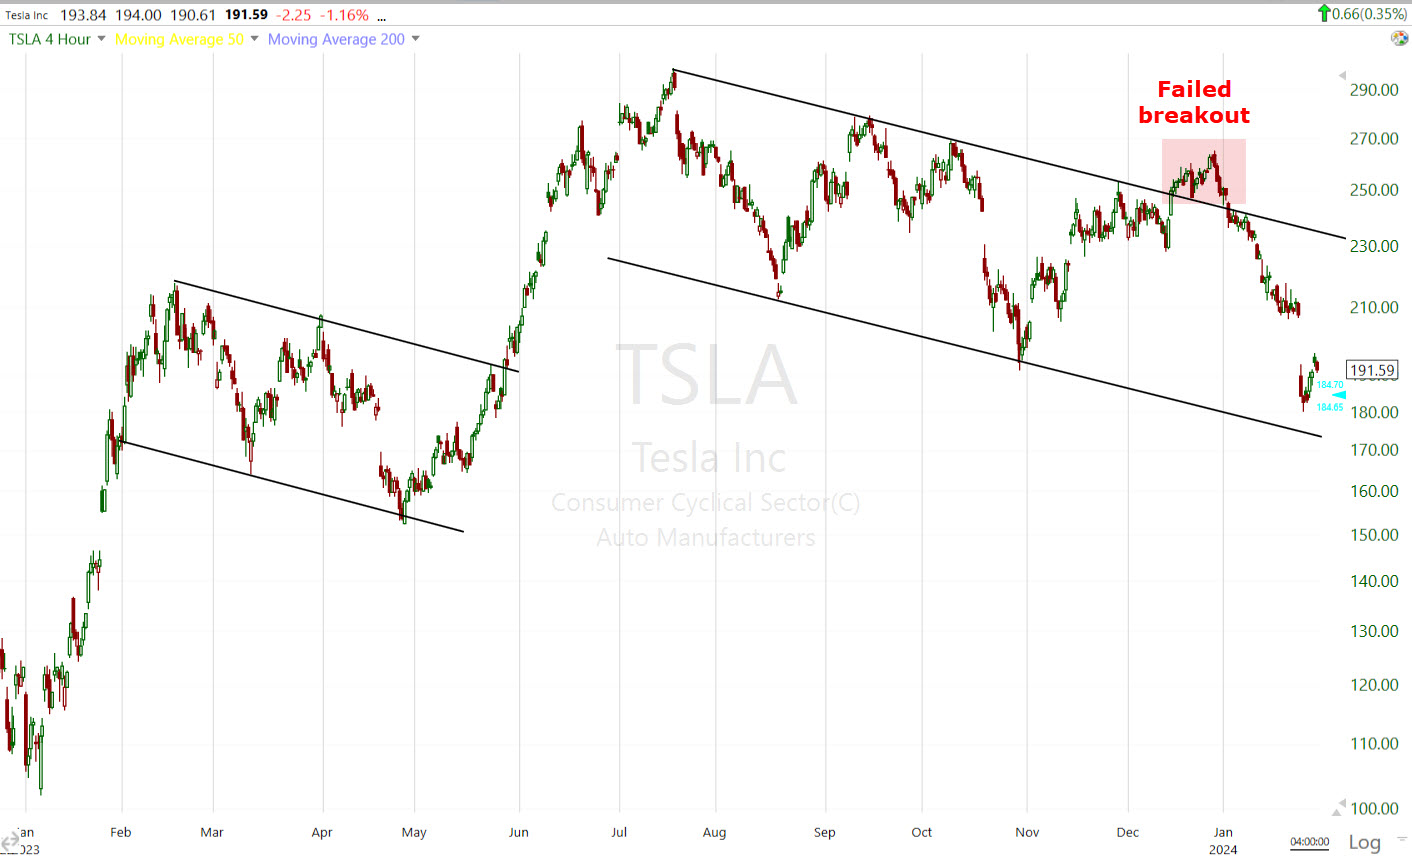 TSLA (4H) This is too big to be a bull flag, but it is a price channel and was still bullish until the failed breakout. There are two concepts here, neither good: 1) Failed breakouts lead to fast price reversals (which we already see) and, 2) The Channel Buster. With Channel Buster dynamics, price is not only likely to head to the the lower channel, which it has almost met since I first posted the failed breakout, but break below it.
Even the short-term price action of the last several days, in which Tesla has bounced the last 3 days, looks to be well within the norms of a typical bear flag consolidation.
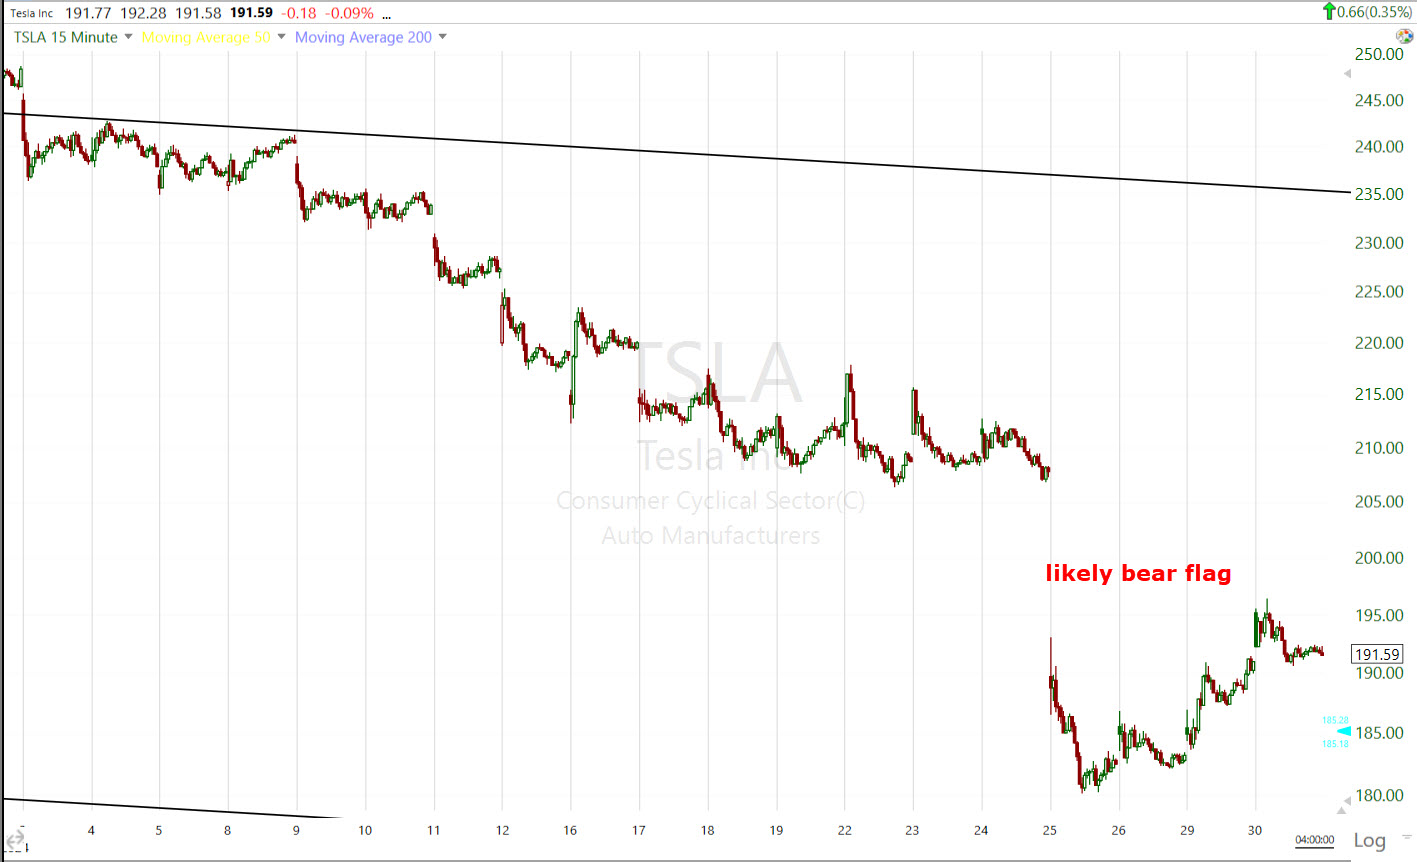 TSLA (15m) There’s no absolute certainty in the market, but there are probabilities and a bear flag is a high probability bearish pattern. The measured move upon a breakdown of this consolidation is nearly -13.5% lower, which would easily take price down to and below the large channel’s lower trend line.
Of the 7 mega-caps that have been responsible for virtually all of the market’s gains, two of the seven, and one being arguably the most important and influential stocks in the market, look bad… and we haven’t even seen higher yield put pressure on their ultra-high valuations.
As it’s earnings season, let’s take a look at the mixed earnings responses for the companies that reported since yesterday’s close. General Motors (GM +7.8%) and HCA Healthcare (HCA +5.2%) logged big gains following pleasing earnings and/or guidance while shares of UPS (UPS -8.2%) and Whirlpool (WHR -6.6%) sank following their results.
Two of the recent usual suspects when it comes to short squeezes that outperformed yesterday, Non-Profitable Tech (-2.6%) and Biotechs (-2.25%), both underperformed today. Among the half-dozen or so groups regularly associated with the Most Shorted Index, these wee the only two that outperformed amid yesterday’s covering in my Most shorted Index, and underperformed today.
Internals
Market breadth was negative, but modestly so with NYSE Decliners (1441) having a slight edge over Advancers (1339) today. This is pretty classic behavior after 1-day overbought internals such as we saw yesterday. Volume was below-average at the NYSE at 852 mln shares.
NASDAQ-100’s A/D line, which very rarely diverges from the index, was negatively divergent today. The broader NASDAQ Composite’s A/D line was even more divergent (which is a regular occurrence).
Since neither S&P sector performance or internals qualify for 1-day overbought/oversold internals, the Dominant price/volume relationship is irrelevant today as there’s not going to be any signal, but I ran the scan and looked anyway. The only average that had a dominant theme was the only average that closed higher, the Dow. It’s dominant theme was Close Up/Volume Down with a vast majority (13 of 30 stocks) falling into the category. This is the most bearish/suspect of the 4 possible relationships and continues the trend since mid-December of markets rising on lower volume and declining on heavier volume. Not constructive.
Overall market breadth (via my breadth oscillators) remains sharply overbought at 93 (scale 0 to 100).
I have about 30+ breadth indicators I track every day. I can’t post them all, but I try to give you a broad sampling of them with each night’s post. Here’s the Percentage of NYSE Stocks Above their 40-Day SMA vs. the SPX.
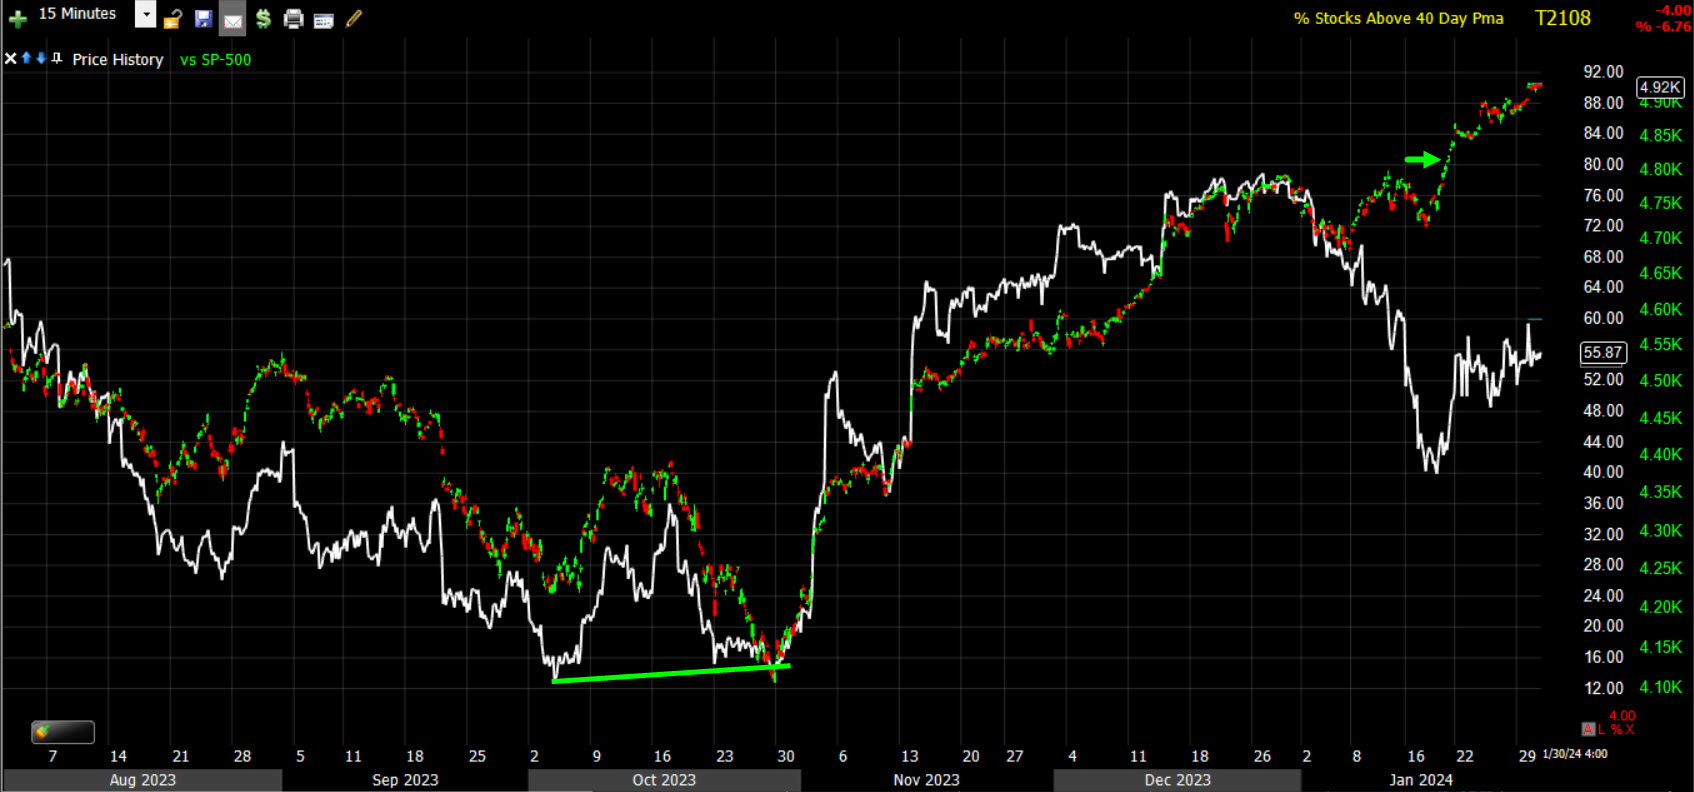 SPX (15m) The green positive divgernece in the breadth indicator was the first positive divgernece (green) since the July high (mid-size H&S patterns) and 3 month downtrend. That divergence (green) just so happens to be into the October market lows as the S&P hit its H&S downside measured move at $4100. Then the market launched into a huge short squeeze rally. Notice anything out of place since the new year? It’s a huge negative divergence, which reflects the 2024 trend…
- Cyclical sectors sold coming into and pretty much throughout 2024
- Defensive sectors tried to rotate into leadership late 2023 into 2024, but the rate sensitive defensives (Utilities, Consumer Staples and Real Estate) were stymied by yields bottoming and starting to turn higher.
- The mega-caps were being sold toward the end of December right into the start of January, resulting in the worst start of a new year in more than 2 decades, but as cyclicals were not finding buyers and defensive sectors’ shot at rotating into leadership was cut short by modestly higher yields, the market went back to what it knows best, its knee jerk reaction we’ve seen over the last 15 years, straight back to mega-caps.
As such, what the breadth chart above is reflecting is cyclicals and defensives faltering while a handful (less than half a dozen now) of mega-cap stocks producing all the gains, while the rest of the market slowly weakens creating a hollowed out market, or “Ginger bread house” with increasingly thinner participation. Or what I’d call, a “fragile market”. This is the same dynamic that we saw in 2021 that lifted the major averages to new record highs, but the fragility of the market was exposed and quickly led to 2022’s bear market.
We can see this from a different perspective when comparing the benchmark (market cap-weighted) S&P-500 vs. the S&P Equal Weight Index.
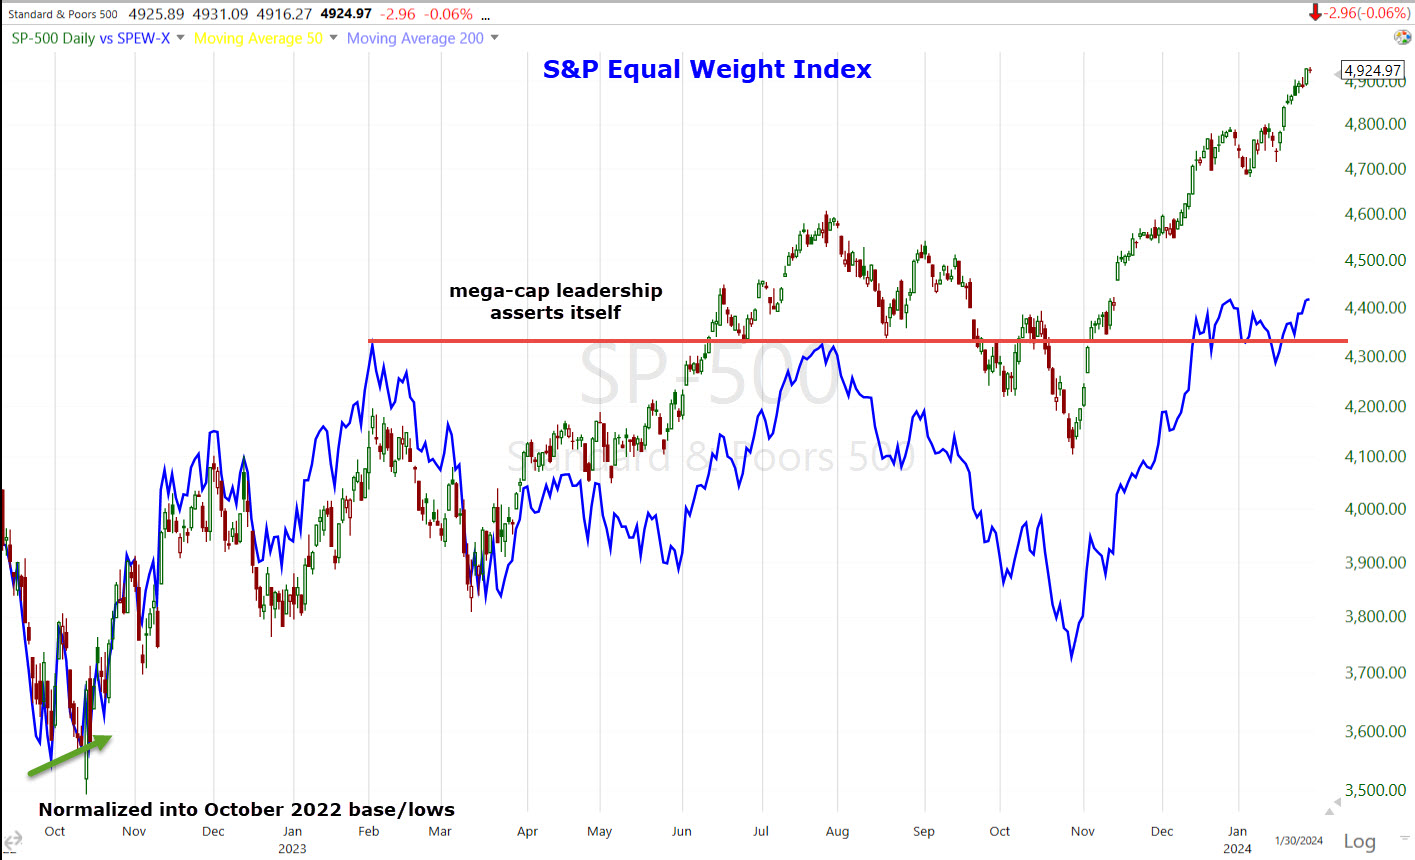 SP-500 and S&P-500 Equal Weight (blue) on a daily chart normalized on a percentage bases coming into the bear market lows of 2022 and October 2022 bases. Notice that the cyclicals/Dow led the first leg of the rally, and as such, the Equal Weight Index positively diverges at the Oct. 2022 low (green arrow), but as the mega-caps assert more and more leadership and traders crowd into the mega-caps, we see the Equal Weight Index fall behind. Something similar is happening the last couple of weeks as mega-caps rotated into leadership after the defensive sectors’ failure to do so.
To put an exclamation mark on this example, the S&P Equal Weight Index is trading just +2% above it’s February 2023 high (in almost a year, it’s gained just 2%). In contrast, the benchmark (cap weighted) S&P is +17.8% above the same level. What this reflects is the S&P’s gains over the period coming virtually exclusively from a handful of heavily weighted mega-caps, while the broader “market of stocks” — or what we used to call the “Stock Market” before 7 stocks took over all gains/losses — has done next to nothing.
Treasuries
The Treasury market saw mixed action today. The Fed-sensitive 2-yr yield, which was at 4.30% before the 10:00 ET data, peaked at 4.37% today before settling at 4.36%. The economically sensitive 10-yr yield, at 4.04% before the reports, peaked at 4.10% before settling at 4.06%.
The 10-year yield is trading slightly below the 200-day as it’s been pinched between the 50 and 200-day, treading water ahead of the FOMC tomorrow.
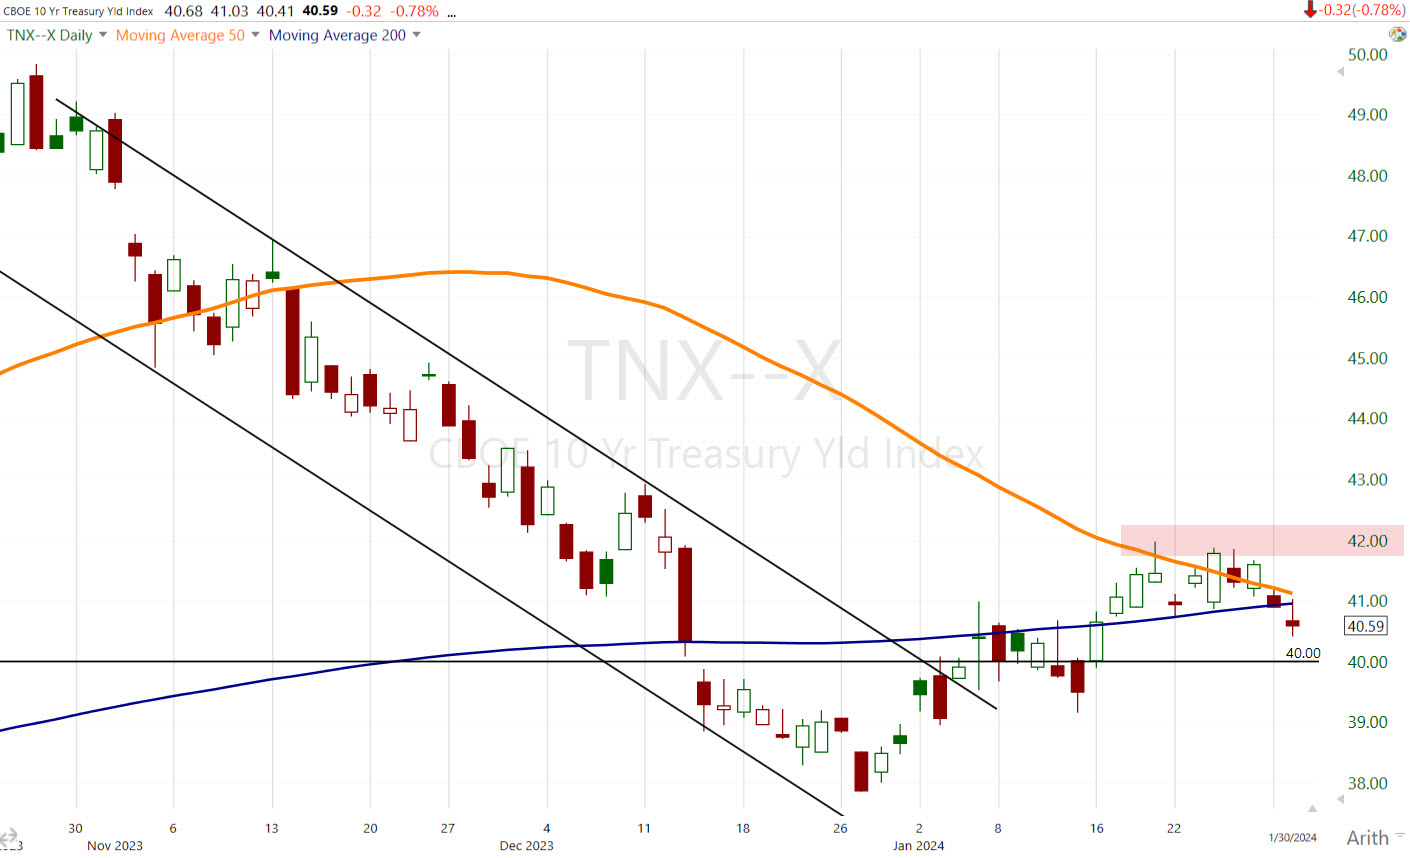 10-year yield (daily) with 50-day (orange) and 200-day (blue) simple moving averages. I continue to see 4.20% (red) as the key level in which higher yields start to weigh on the valuations/prices of the only consistent support the averages have – the mega-caps, if earning doesn’t do them in first. This applies to most stocks as well, but the mega-caps are really the only driver of upside gains at the index level.
Market implied March rate cut expectations dropped further below a coin toss today (from a virtual certainty priced-in during December) to 42.8% from 46.2% yesterday.
I won’t post HYG/SPX’s larger divergence again since I just did last night, but I will show you the very clear relative weakness in HY Credit vs the SPX today.
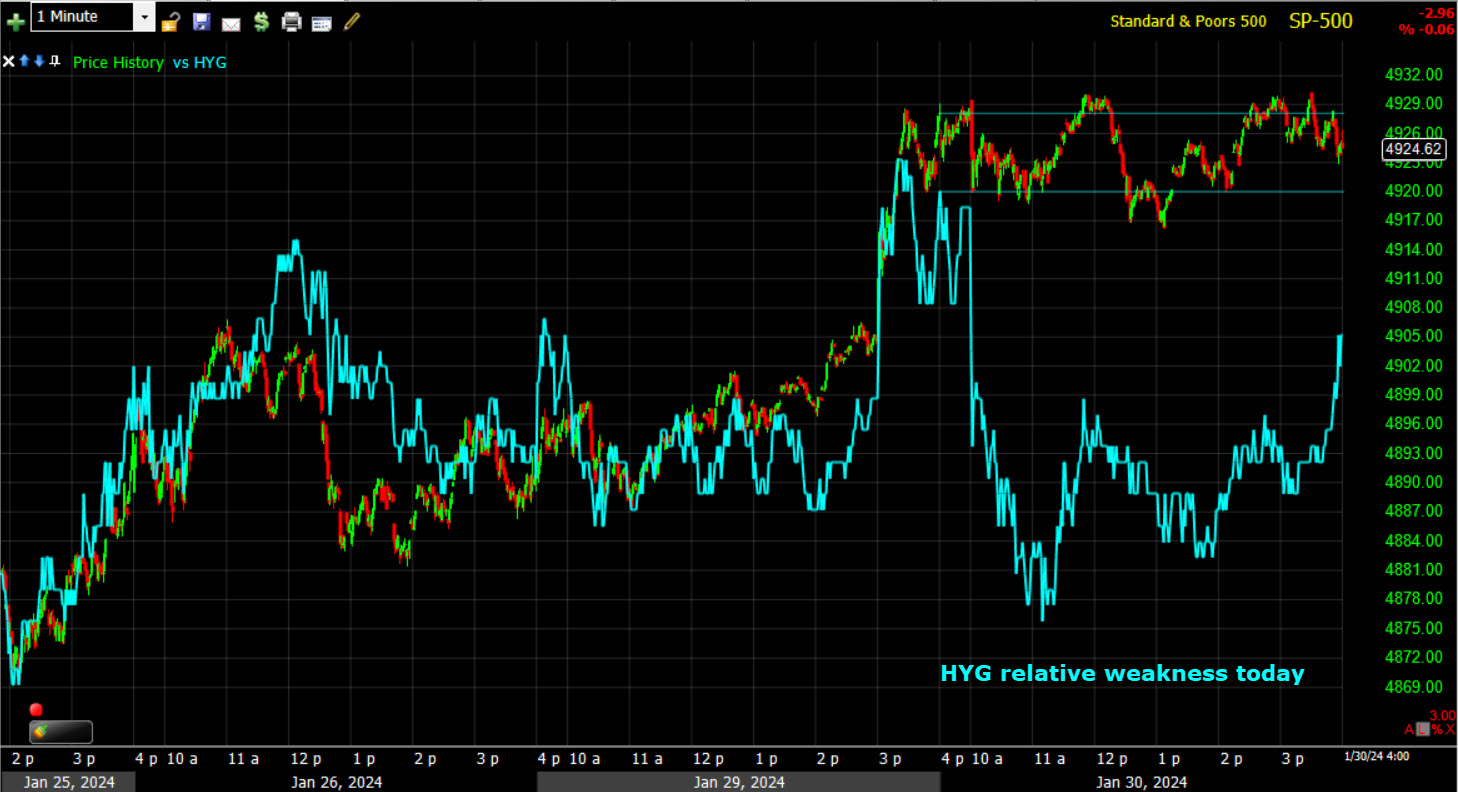 SPX/HYG (1m) In the not too distant past a divergence like this would be enough of a signal to tell us that probabilities are for a lower market the next day, but what’s been building recently is far, far larger than anything I can recall seeing in more than a year.
This is yet another example of the fractal nature of the leading market signals, indicators and concepts I use. Learn them, but then make them your own.
Currencies and Commodities
The U.S. Dollar Index closed down about -0.1% today, but off the pre-market lows after economic data came in better than expected. In context of the bigger picture, today was irrelevant.
After a pull back yesterday upon meeting technical resistance at its 200-day, WTI Crude oil closed higher by +1.3% at $77.84/bbl., finding support at the former resistance zone (top of lateral range) and bouncing off of it. Price is challenging the 200-day again after just 1 day of pulling back from the influential technical level.
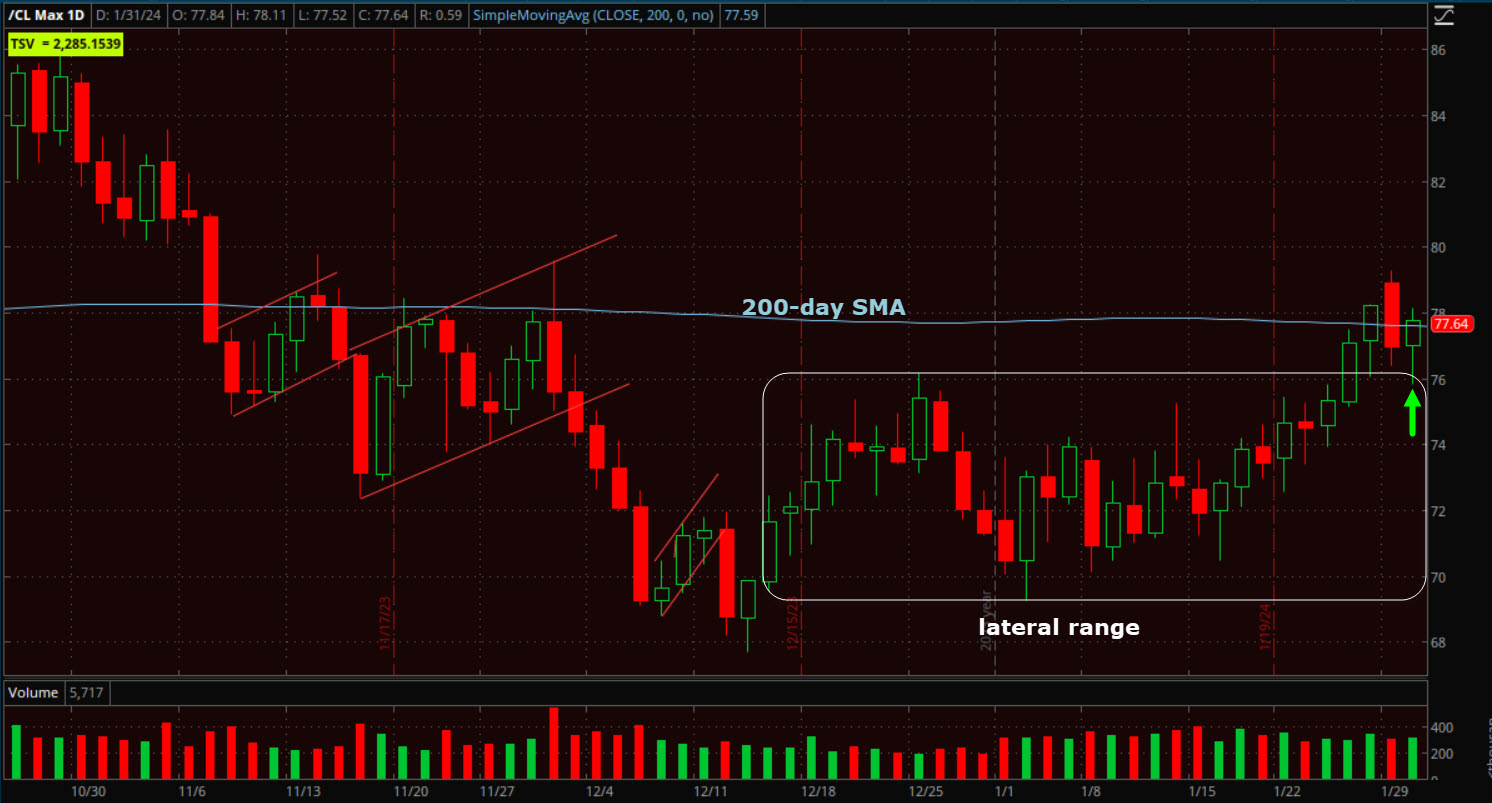 WTI Crude Oil futures (daily) with the 200-day. I know I say it everyday, but if Crude oil breaks out above the 200-day in a definitive manner, expect the 10-year yield to track higher with an average 2 to 4 week lag. That’s going to start to bump inflation expectations higher. It’s going to cause the Fed concern about a repeat of the double rip inflation of the 1970’s and early 1980’s, or Powell’s much feared “Volcker mistake”, and it’s going to rapidly shift down rate cut expectation/timing that the market has been rallying on since the December FOMC.
UNG gained +1.4% today. As I said last night, UNG’s price/volume action and 3C signals both suggest that price should be acting better than it was yesterday. In the Early Update I said the first thing UNG needs to do is close back above last week’s low of $19.40. It closed at $19.40 today. I’d like to have seen a little stronger close and volume today.
URA gained +1.75% today and as suspected yesterday, is starting to breakout of its bull flag.
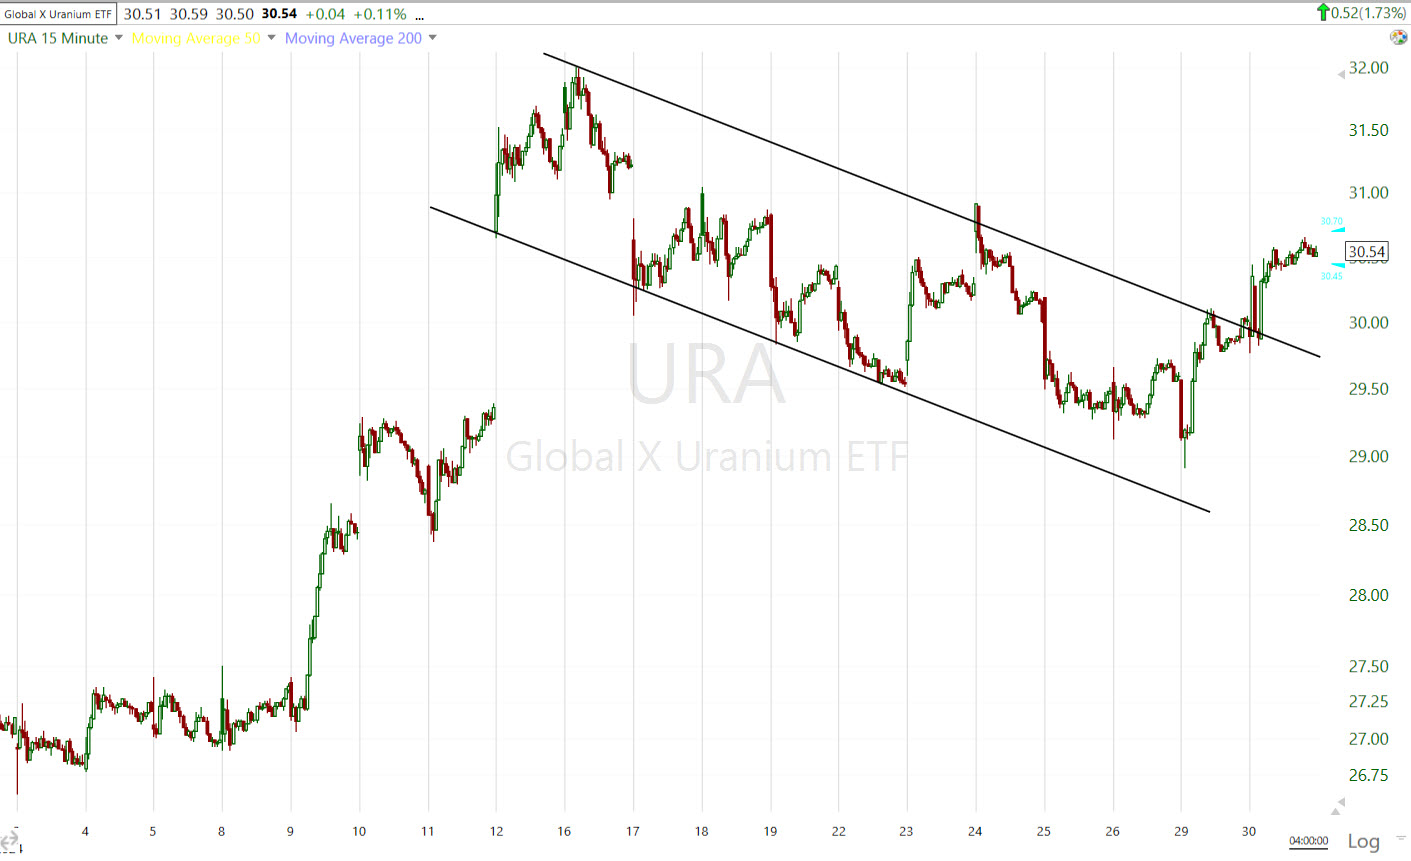 URA (15m) – Today was not a definitive breakout in either price or volume, but perhaps it’s the start. The bull flag’s upside measured move upon a breakout is +17.5% (from the upper trend line), which would be approximately $35.20 for this leg, but I see this as a much more attractive prospective longer term position rather than just a +17% quick trade. Play it as you feel appropriate.
Gold futures gained +0.3% to $2,050.90/oz. From a closing stats perspective, not much happened in gold today, but intraday around this morning’s economic data, gold price was very volatile. I’m not concerned with that, just that gold continues to consolidate in a bullish manner as it has been doing and continues to do.
I like gold’s potential (long) for 2024, especially if we get the recession that historical probabilities are screaming we should get this year. Being bullish on gold, I did not like gold making new record highs. I kept saying the only thing I wanted to see gold do was consolidate in a bullish pattern and build a nice strong base from which to rally from. It took a little time, but here it is…
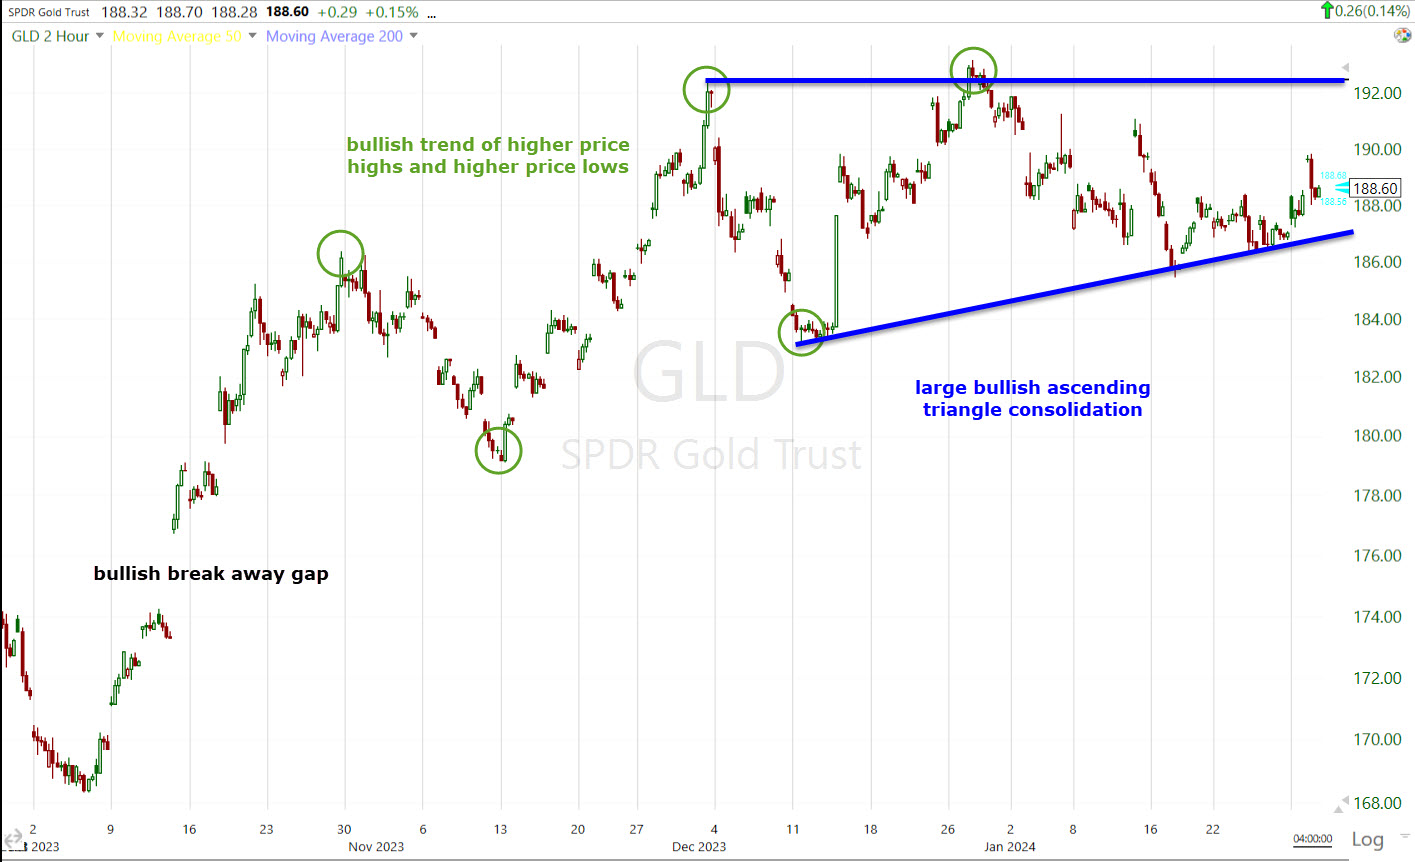
GLD (2H) Not only do we have a nice big bullish ascending triangle consolidation, but the price trend preceding it was stellar with bullish breakaway gaps and a trend of higher highs/higher lows. I am not bothered at all if gold is up or down a half a percent or so a day, so long as it does not trade below the December 11/12 low and make a lower price low.
Based on the price pattern’s apex, I estimate that gold breaks out by March, but we’ll continue to read the message of the tape and adjust as necessary. As it stands now with the size of the consolidation and preceding trend, Gold should easily see a next leg up (upon a breakout) of 14% or so, but that’s just a next leg up, not the extent of gains possible should we enter recession and real yields tumble.
A day is not a trend, but Bitcoin’s recent bounce seems to be stalling.
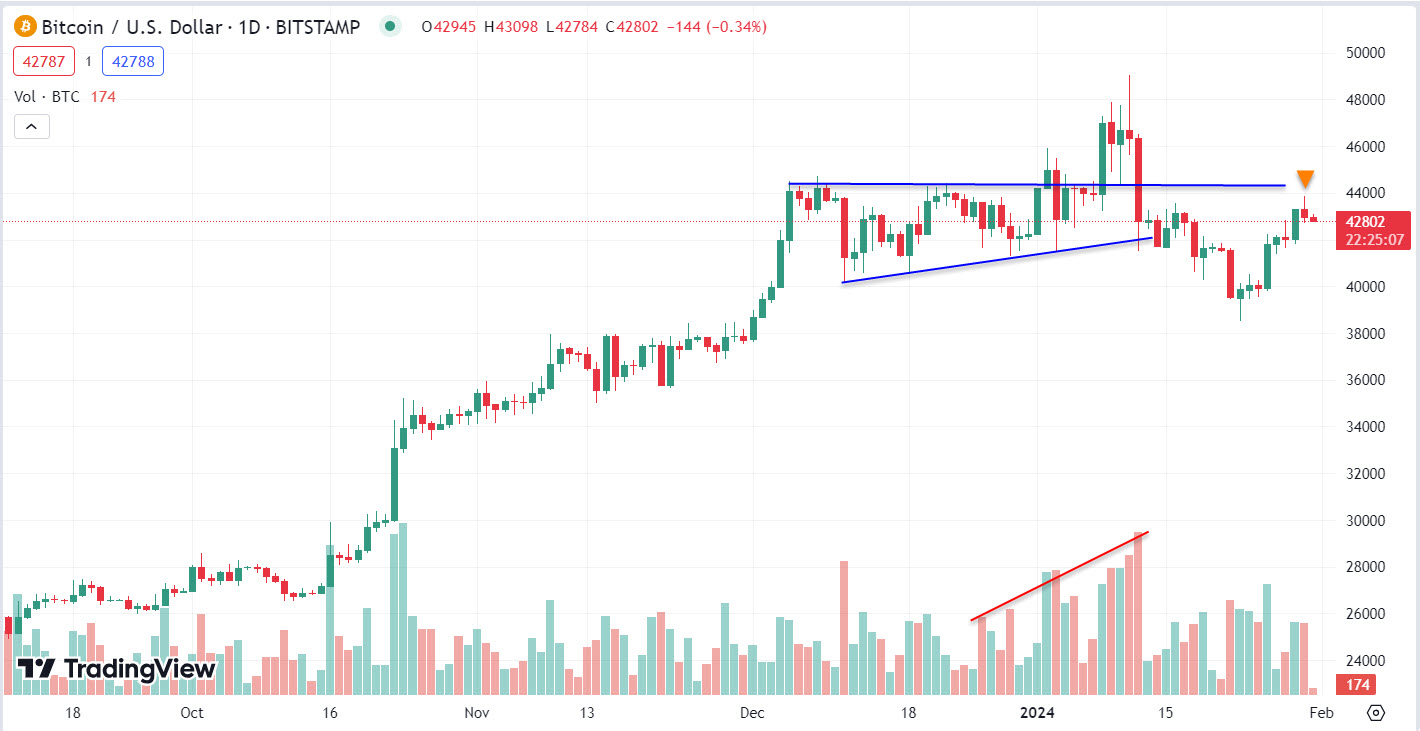 BTC/USD (daily) with a long upper wick on today’s price candle indicating higher prices failed to hold.
Summary
In June of last year we started to see the start of the distribution process in mega-caps, specifically starting with Apple in mid-June and by July we had a price high (SPX $4600) and mid-size H&S patterns that fulfilled or surpassed their measured moves (SPX $4100). By my October video, Cracks, it was apparent that mega-caps had lost their leadership role. Sure they rallied in November – December as short covering in the worst performing stocks of the year drove gains. “A Rising Tide Lifts All Boats”, but they no longer displayed any hint of leadership, until the second week of January.
Considering the entire market is being propped up by the Magnificent 7, what stands out now to me this week more than anything is the true cracks in mega-caps. Of the Mag-7 stocks, it’s now pretty much the Mag-5 as Apple and Tesla are displaying notable relative weakness. Tonight we got earnings from 2 more and the initial reaction wasn’t great. We’ll get more through the end of the week. The other notable risk is a Fed that the market takes more hawkish than expected, sending yields higher and specifically the 10-yr above 4.20%; a level I think starts to weigh down the mega-caps due to valuation concerns. Crude breaking out definitively above its 200-day seems far removed from what mega-caps do, but if crude breaks out and starts trending higher, so do yields and inflation expectations. That too is a risk for basically the 5 heavily weighted stocks still supporting the market.
That’s to say nothing of the price/volume action (bearish); the leading market signals all negatively diverging with equities from rates to credit, to FX, market breadth and the alligator “Jaws of Death” divergences in 3C – which were featured in last night’s Daily Wrap.
Tomorrow we get the FOMC decision at 2 p.m. ET, which is followed by Fed Chair Powell’s press conference at 2:30 p.m. ET. The market expects that the committee will leave rates unchanged, but participants are anxious to hear any tonal shifts in rhetoric from Powell. As always, be aware of the knee-jerk reaction in stocks, and we may get two or more (FOMC and Powell’s comments and Q&A). I always watch yields and the Dollar. If they move higher then the FOMC is more hawkish than expected (not good for stocks), and lower means more dovish than expected (good for stocks).
Overnight
S&P futures are down -0.4% and NDX-100 futures are down -0.85%. Dow futures are flat and R2K futures are up +0.25% (continuation of today’s leadership in Cyclical and Value style factors).
Alphabet and Microsoft reported earnings after the close. Alphabet beat on EPS and revenue, but missed on ad-revenue, “search” revenue and operating income. When an economic downturn materializes, one of the first areas hit hardest is advertising and Alphabet is reflecting that. The results sent shares of Alphabet lower in afterhours by -6.8%.
Alphabet/Google may be behind the curve on “AI” with ChatGPT putting Google behind the 8-ball to defend its core search advertising business; and that comes on the heels of a landmark antitrust trial centered on that very business.
Microsoft, one of the current stars of the “AI” narrative that’s allowed Microsoft’s market capitalization to modestly exceed Apple’s (also driven by Apple’s relative price weakness), beat on both the top and bottom lines, but the market was unimpressed and sent shares lower in afterhours trade by -0.6%. Afterhours trade has been volatile. MSFT was down as much as -3% after reporting earnings, but retraced a good portion of the losses to sit with a -0.6% loss.
Advanced Micro Devices (AMD), a semiconductor, reported and fell on weak forward guidance. AMD trades down -9.5% in afterhours trade.
The U.S. Dollar Index is up +0.2%, which is modest downside pressure on stocks.
WTI Crude Oil futures are down -0.4% to $77.52/bbl. as price wrestles with the 200-day.
Gold futures are unchanged.
Bitcoin futures are down -1.25%.
The 2 and 10-year yields are down around -4 bp each so the weakness in NASDAQ-100 futures is earnings related, otherwise NDX would usually perform better with lower yields.
Boeing (BA -2.4%), Thermo Fisher (TMO+1.6%), Mastercard (MA +1.1%), Aptiv (APTV -075%), and other report earnings ahead of the open tomorrow.
Wednesday’s economic calendar features:
- 7:00 ET: Weekly MBA Mortgage Index (prior 3.7%)
- 8:15 ET: January ADP Employment Change (prior 164,000)
- 8:30 ET: Q4 Employment Cost Index (prior 1.1%)
- 9:45 ET: January Chicago PMI (prior 46.9)
- 10:30 ET: Weekly crude oil inventories (prior -9.23 mln)
- 14:00 ET: January FOMC Decision (prior 5.25-5.50%)