Market Update – Not Everything Went Back To What It Was
2:45 p.m. ET
The majors are still little changed since the last update. Small Caps’ relative weakness is becoming more pronounced. SPX and Dow +0.35%, NDX +0.65% and Small Caps -0.2%.
S&P sectors are roughly evenly split. The heavily weighted Technology +0.75% and Communications +1.2% sectors (two that either don’t have resistance, or it was further away) lead.
A theme among sectors is resistance areas in play. Another is mirroring the weakness in small caps… some of the cyclical sectors and growth/high beta areas within them, are showing weakness. Yesterday we saw that with expensive software stocks, today in relative weakness in Materials -0.35%, Energy -0.75%, Regional Banks -0.6% (recently flattening yield curves), Transports -0.4% and Semis -0.15%.
While the market is quiet I thought I’d get these charts out…
The major averages retraced all of the corona-virus losses yesterday, but not everything went back to the way it was before the virus. There are obvious areas like Crude, copper and bond yields. Then there are less obvious areas that mirror those assets.
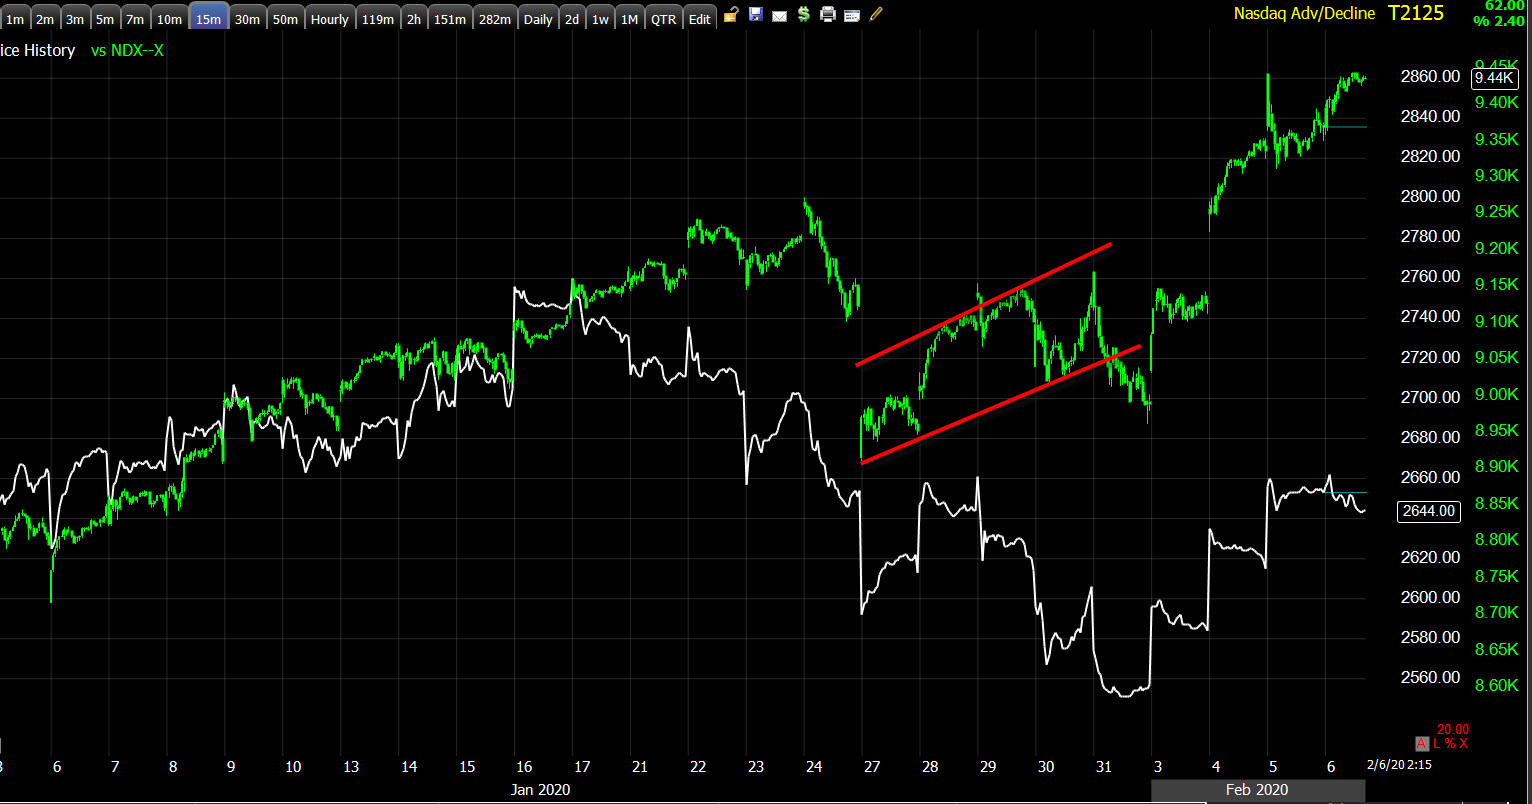 NASDAQ 100 (15m) and NASDAQ Composite’s advance/decline line. The A/D line (participation) mirrors the period before the last decline. The takeaway is that the most heavily weighted stocks drove the major averages, but the vast majority are under-performing, even after the last 4 days. This is the worst breadth divergence of 2020. I’ll have to take a closer look after the close, but a quick eyeball of the chart says it may be the worst in more than a year.
It’s not exclusive to NASDAQ stocks…
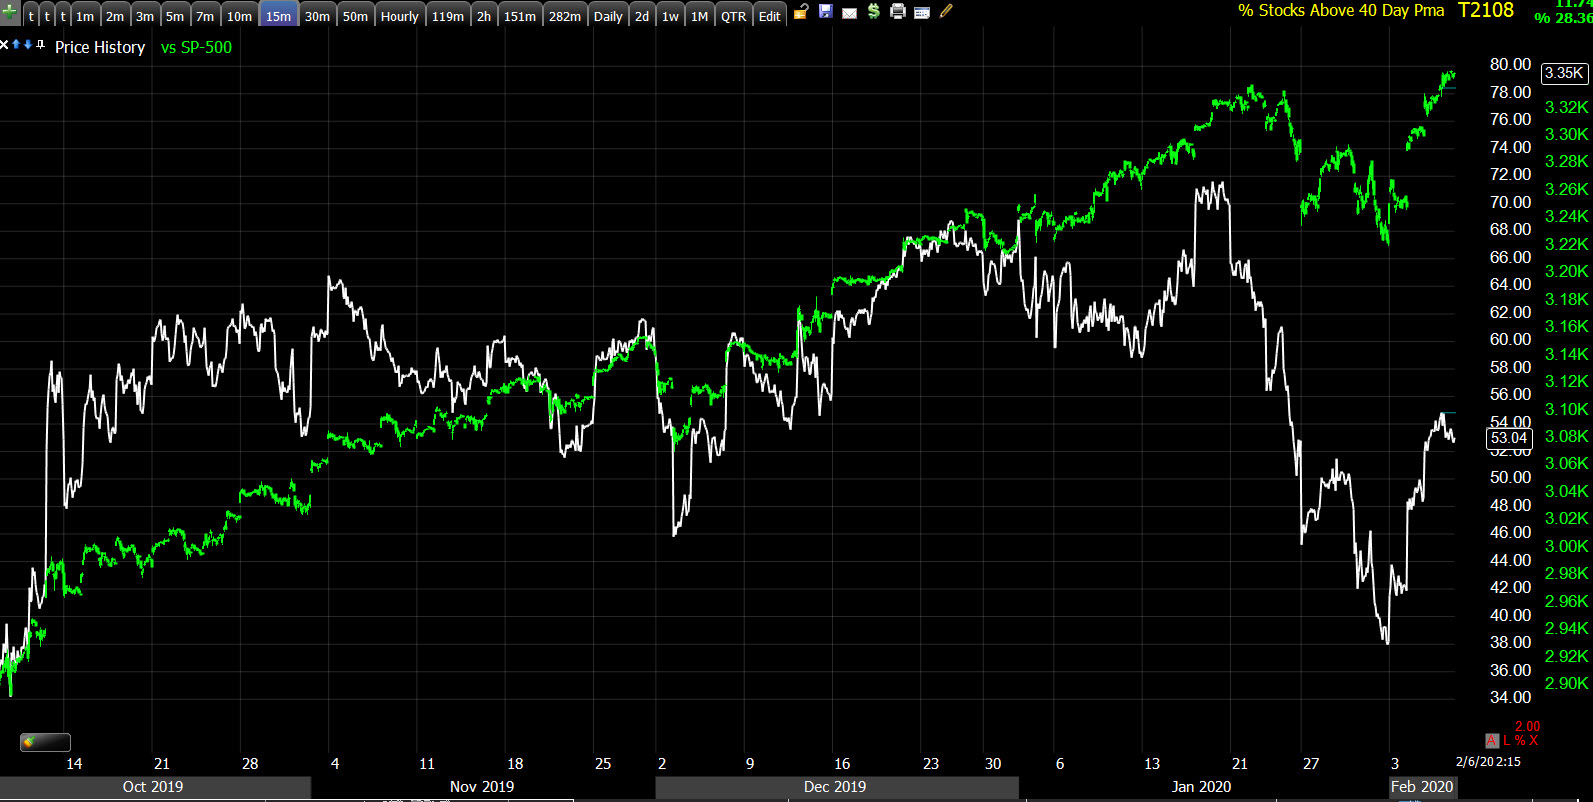 SP-500 (15m) and the percentage of NYSE stocks above their own 40-day moving averages is the lowest since before the trade deal announced in mid-October.
The takeaway is not surprising, the liquidity driven gains after China’s central bank printed more than 80 billion (USD), largely went to the most heavily weighted stocks that could move the major averages the most. It’s a lot easier and more effective to move the Dow, S&P and NASDAQ by buying one stock like Apple, than buying 100 or more individual stocks. As a reminder, there has been some evidence this week in stocks like Apple and Microsoft, that the rally is being used to sell in to by pros.
Here’s why I say that the market breadth weakness mirrors the assets above (Crude, copper and bond yields)…
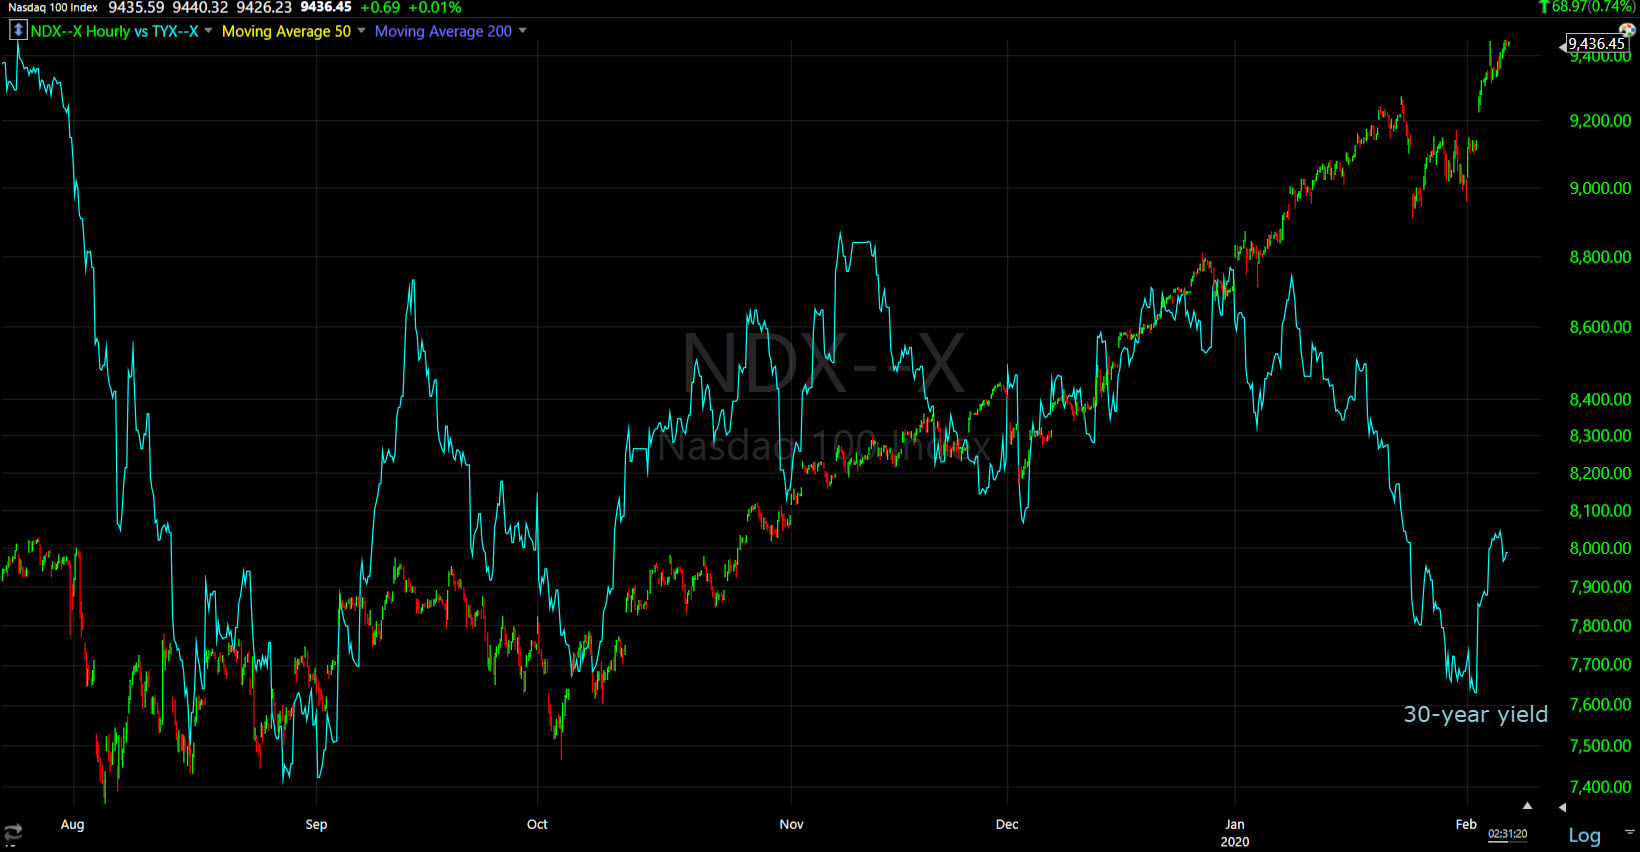 NASDAQ 100 (60m) and 30-year yield
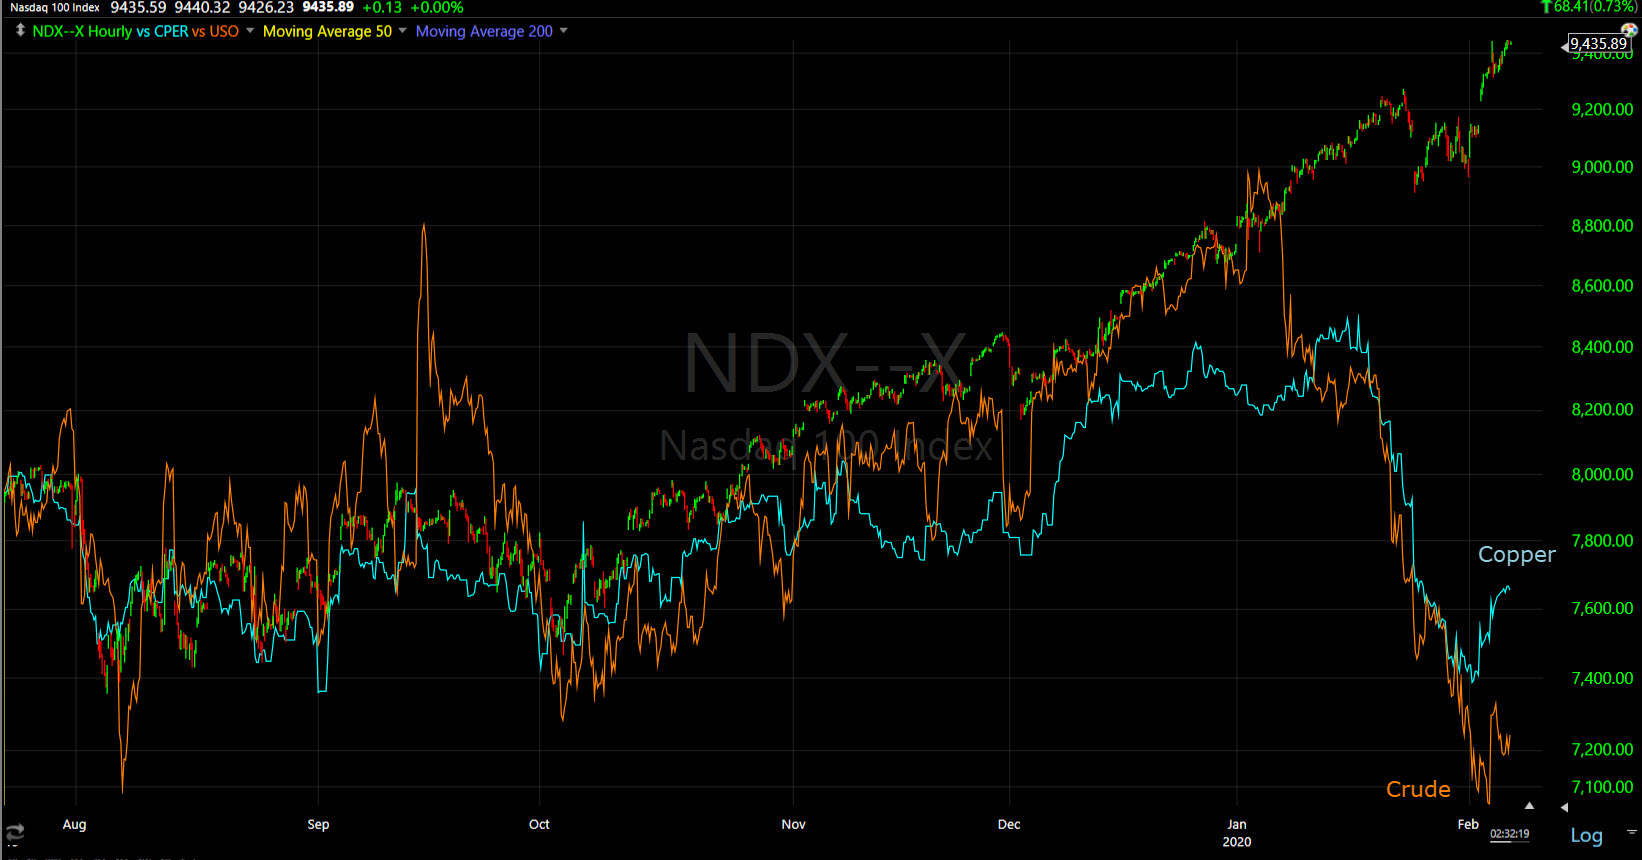
NASDAQ 100 (60m) and Crude and Copper.
The takeaway from the two charts above is that the 3 asset classes sent a big warning shot across the bow. That warning shot is still out there for all to see… if they’re not blinded by the short term headlines of “new record highs”.
Lets see if the final hour reveals any more.