One Measured Move Down – Semiconductors
12:07 p.m. ET
Sorry everyone, but after a frustrating week of looking for second leg down measured moves out of bear flags to be met while Technical support levels were keeping that from happening, I’m feeling a little giddy as I’m seeing the targets either much closer to being met, or in the case of Semiconductors (SOX Index -2.3%), having just been met.
Semiconductors had one of the larger measured moves of about 5% down on a second leg, which means that since August 1st, the SOX Index has had 2 legs down with a bear flag in-between them, and has fallen over 9% and this morning’s low, and has now fulfilled the measured move target for the second leg down out of the bear flag.
The semiconductors alone have been a developing story. They’re an important group as they tend to lead the Technology sector, so I’ve been watching them closely the last 3 or so weeks.
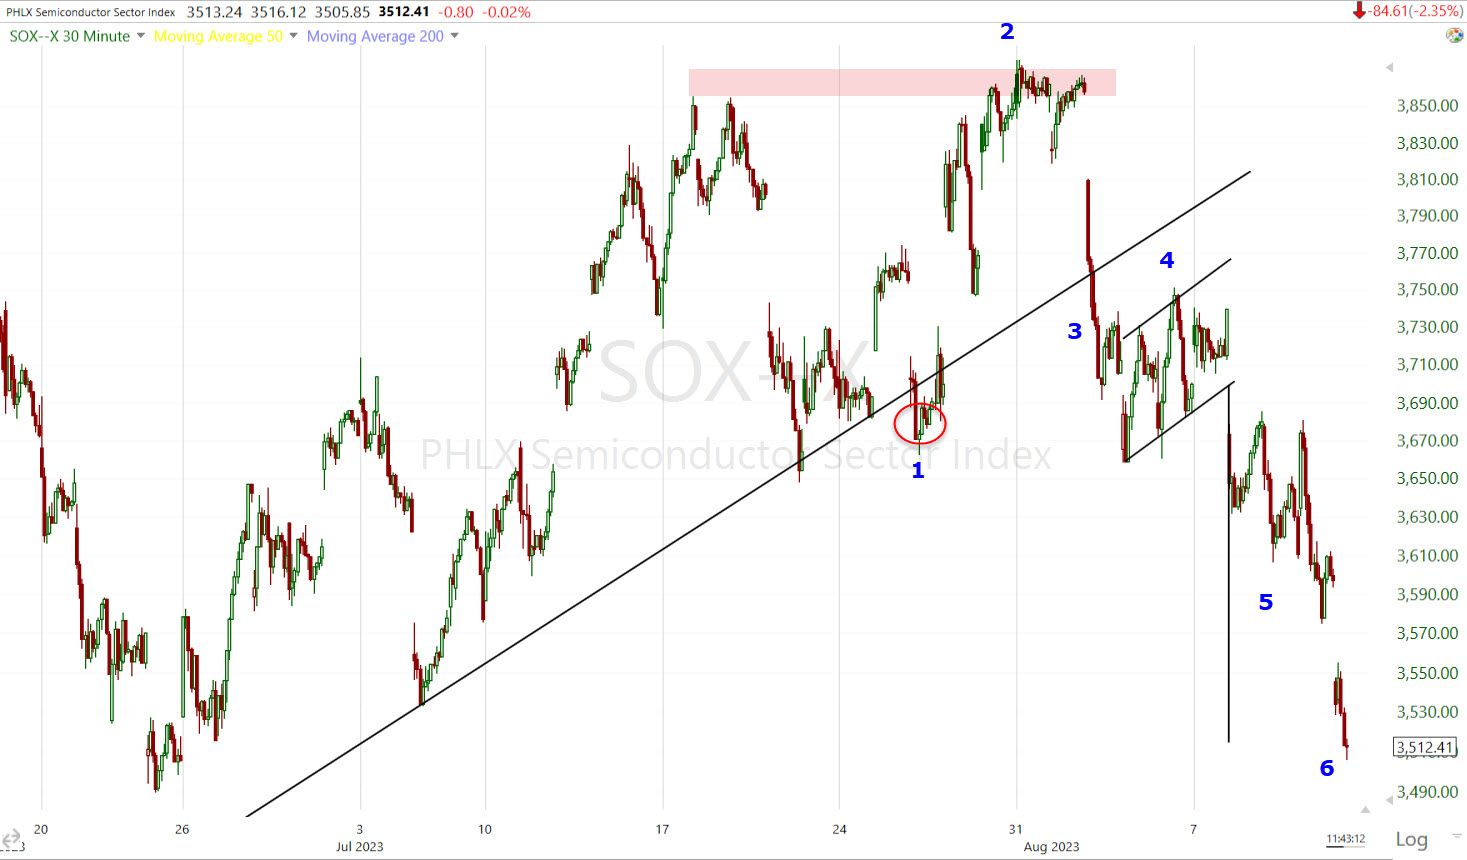
SOX (30m) 1) an initial break of a multi-month up trend; 2) a rebound back above trend, but meeting resistance; 3) a first leg down that breaks the trend; 4) followed by a bear flag suggesting a high probability of another decline, or second leg down; 5) the second leg down begins; and 6) the second leg down measured move is tagged this morning.
More often than not, price will consolidate or even correct (bounce) after a measured move is met. Sometimes the measured moves are exact, sometimes they are a little further or in this case, deeper, but they usually come back to the target zone area to consolidate. This measured move is now met. While prices can exceed measured moves, I usually take profits on a trade when the measured move is met. I might give up a few extra percent of downside, but I’d rather that than give back profits because price bounced or corrected shortly after meeting the measured move. That’s just my preference, it’s not to say that it should be everyone’s.
Now, we watch for what comes next. Do we get another bearish consolidation suggesting a 3rd leg down, or does price look more like a short term bottom for a corrective bounce?
Semis aren’t as close to technical levels (moving averages) as some of the other assets/averages that had downside measured moves to be met like the S&P-500 or NASDAQ-100, so this one isn’t as clear, or rather may not play along with m expectation that measured moves are met, and prices return to technical levels because of their magnetic attraction for traders.
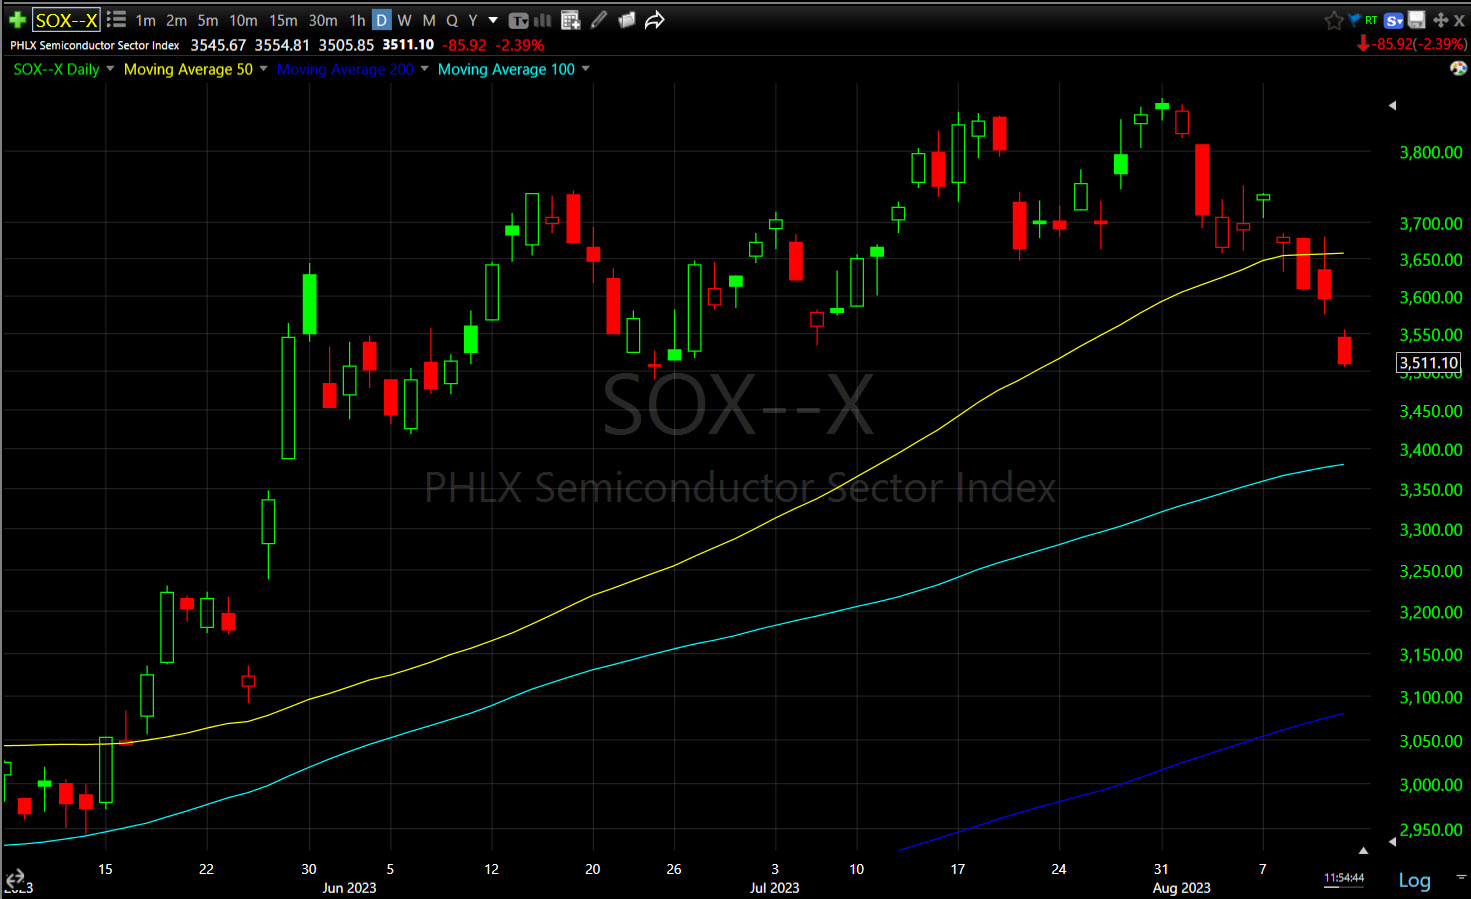
SOX (daily) – price is about -4% below the yellow 50-day sma so that seems like a bonce that we will not be getting today, and perhaps not at all. Price is about 4% above the light blue 100-day sma. Currently the daily candle is bearish, trading near session lows, but it will be important to see how it closes the day. A larger downside candle closing near or at session lows suggests we’ll have more downside to go, whereas closing well off session lows and putting in something like a bullish hammer candlestick on the daily chart would suggest that we’re abut to move to the consolidation/correction stage near the measured move target.
Since SOX is an index, I can’t pull up 3C charts for it so I have to look at the ETFs and the key semiconductors in the group like NVDA (-3.5%). As I mentioned last night, Apple has a short term positive 3C divergence near its 100-day sma that is evidence of technical traders stepping in at the level. That doesn’t mean that their buying can’t be overwhelmed by institutional sellers, but right now it looks like Apple wants to hold around that 100-day. In NVDA’s case, which was near to its 50-day the last 2 days, I saw no such positive 3C signals and the stock is -3.5% lower today, while Apple is only down -0.1%.
I still don’t see any positive divergences for NVDA, so I don’t think we’re seeing buyers step in yet.
As far as what Semis are signaling relative to the Tech sector, Semis have actually had strong relative performance vs. Tech from mid-May due to the whole “AI” narrative driving buying in the group. Year to date, Semis are a little better than Tech, but not a huge difference. What I’m interested in is the more recent changes in character so here’s the two normalized as of August 1st.

SOX (5m) in blue are a bit weaker than the Tech sector here, but I wouldn’t consider this all that insightful at the moment. Had Tech been holding up and semis were puking, that would be a very negative signal for Tech.
I’ll let you know if anything changes on the charts and it looks like semis are finding some buyers. For now, I’m just excited to see one of the larger downside measured moves now met.