Some Revealing Intraday Price Action In The Averages
I’m reposting a few screen grabs of intraday market updates for subscribers from earlier today. The same concepts that applied to today’s intraday price action, apply to daily or weekly charts, they apply to stocks, Bitcoin, currencies, commodities, basically anything that trades. If you understand the concept, you can apply it virtually in any kind of trading and any kind of asset.
Here’s the first screen grab…
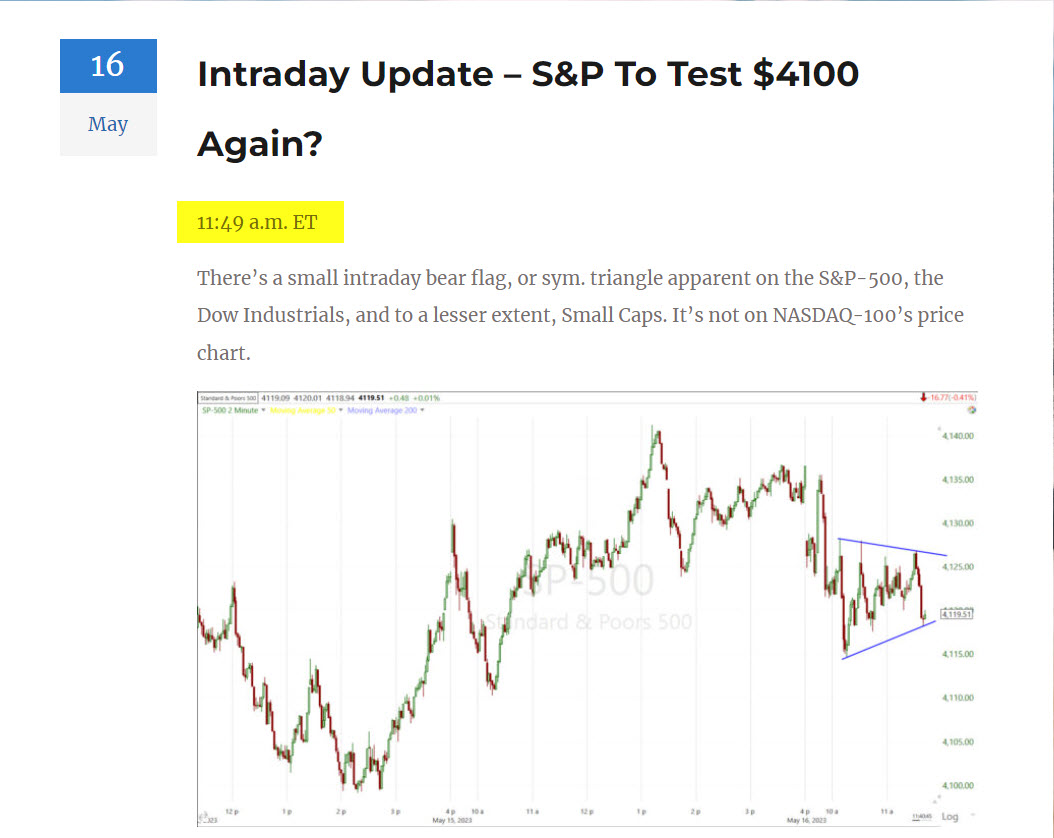 This is from 11:49 a.m. ET as some bearish price action starts to unfold intraday.
Here’s an update following up on the intraday price action, posted at 2:15 p.m. ET
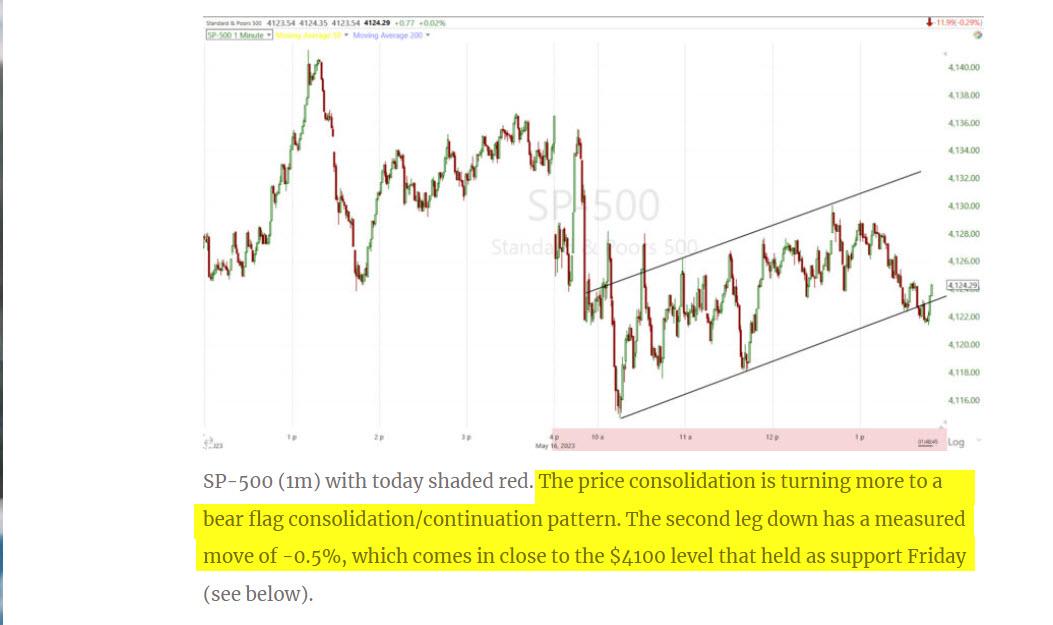 The price consolidation intraday has become a clear bear flag at this point, with the same measured move upon a break below the bear flag for a second leg down.
Here’s a chart of the S&P by the close…
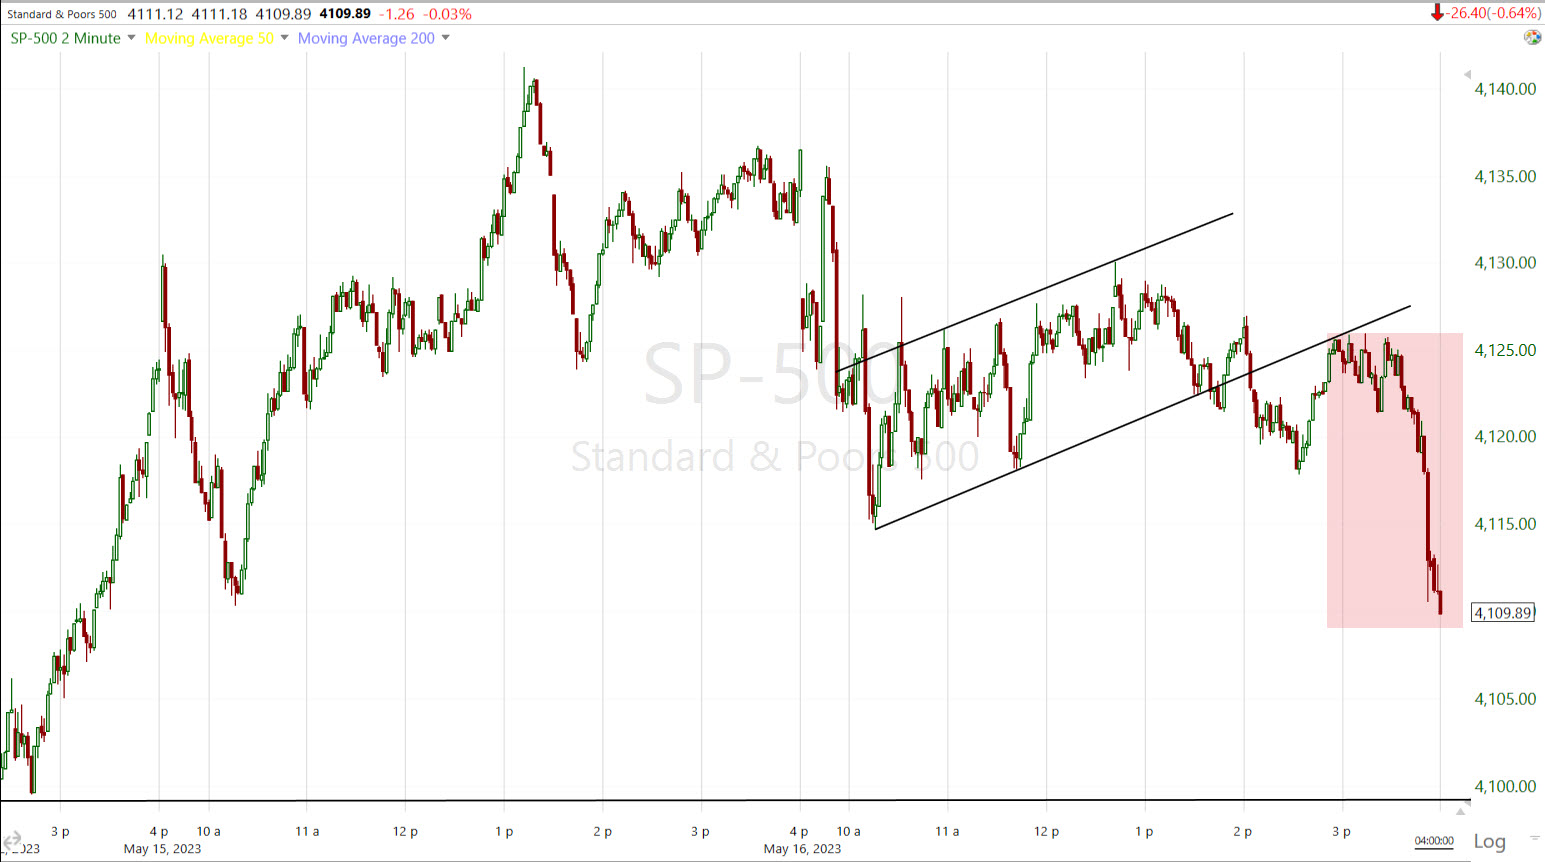 SP-500 (2m) with the second leg down starting as the bear flag broke, then briefly back-tested the now broken former support trend line of the flag from below, and traded to session lows.