Stock Analysis and Assessment
This morning had similar tone to yesterday as S&P futures were near unchanged, but appeared to be consolidating in a bullishly biased correction. Once again, around the European close buyers stepped up, but unlike yesterday gains weren’t faded into the cash close, despite the fact that Treasury yields pushed higher.
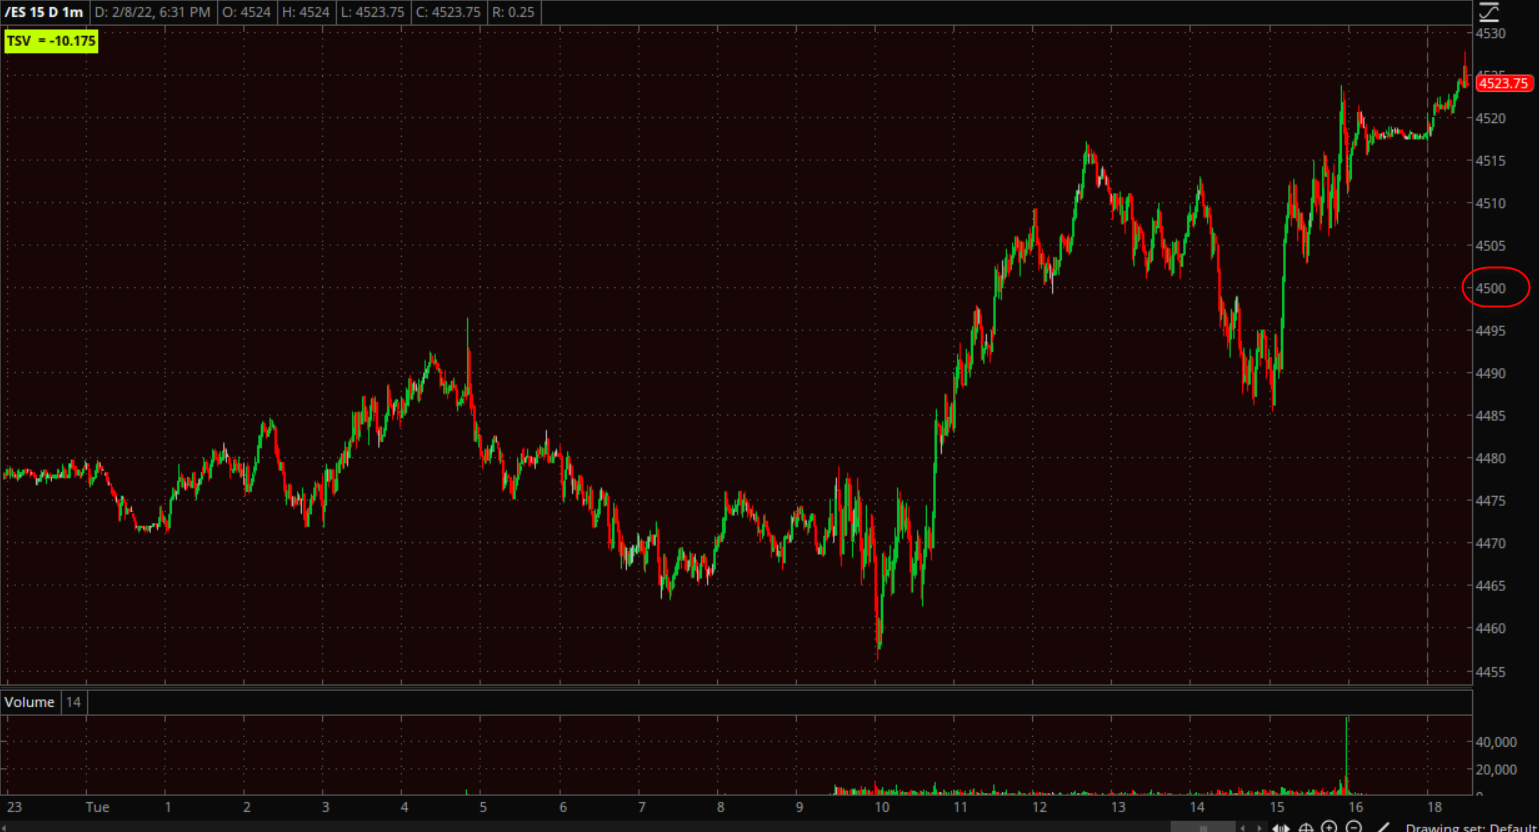 S&P futures (1m) bid up near the European session close and trading above $4500 where there has been some more tentative price action recently. Unlike yesterday, the averages held their gains into the close.
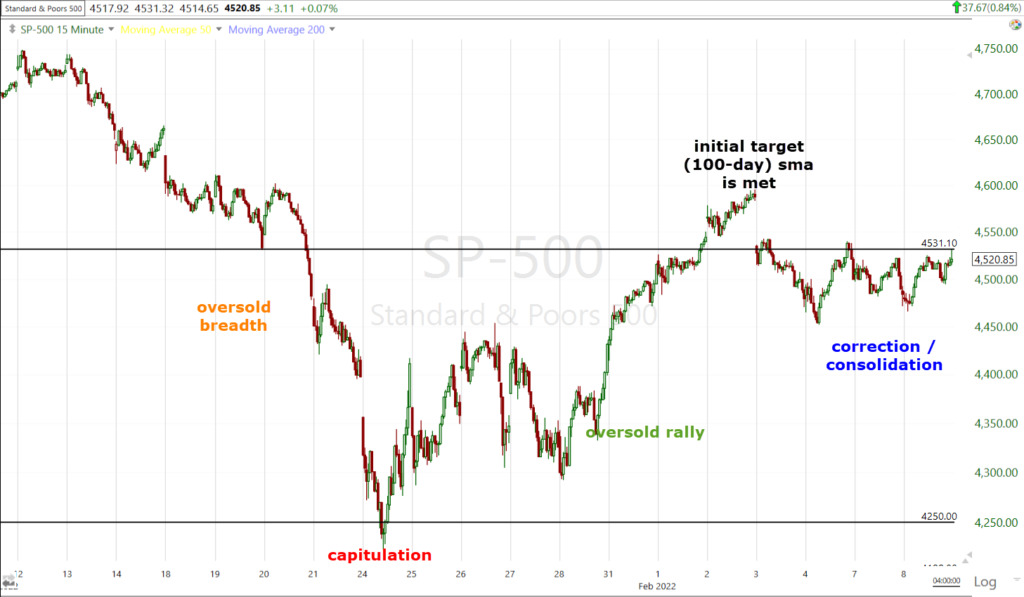
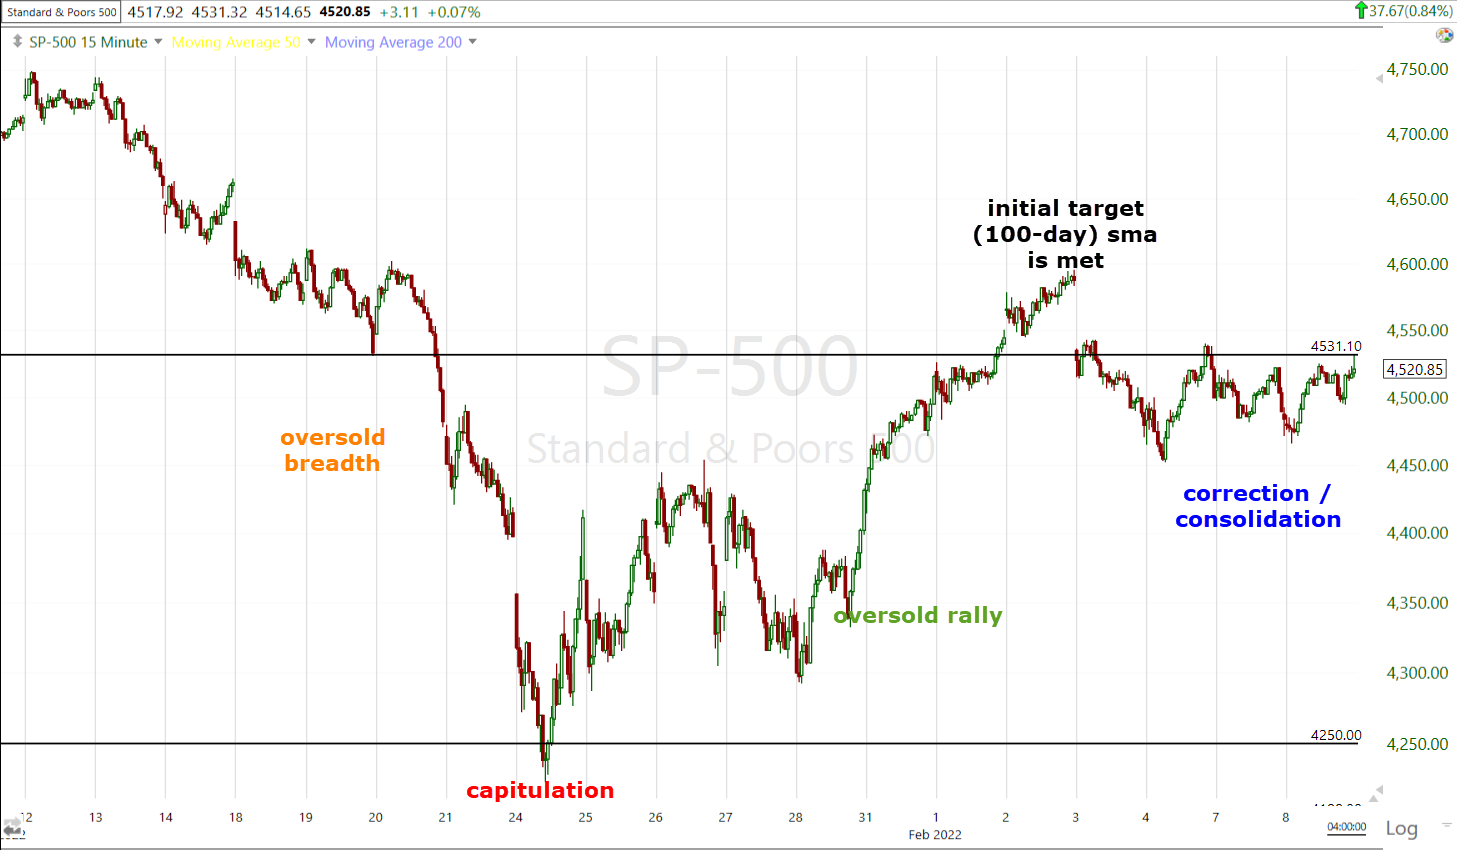 SP-500 (15m) just yesterday I noticed these last few days of price action ook more like a bullish consolidation and today further pressed home that view.
Averages
While all of the averages put in respectable performance today, Small Caps’ leadership and relative strength is a positive near-term signal as the domestically-focussed and economically sensitive index tends to lead risk sentiment, in similar fashion to what I pointed out yesterday in that bitcoin, being a speculative asset, seemed to be leading better risk sentiment.
S&P-500 ⇧ 0.84 %
NASDAQ ⇧ 1.21 %
DOW JONES ⇧ 1.06 %
RUSSELL 2000 ⇧ 1.63 %
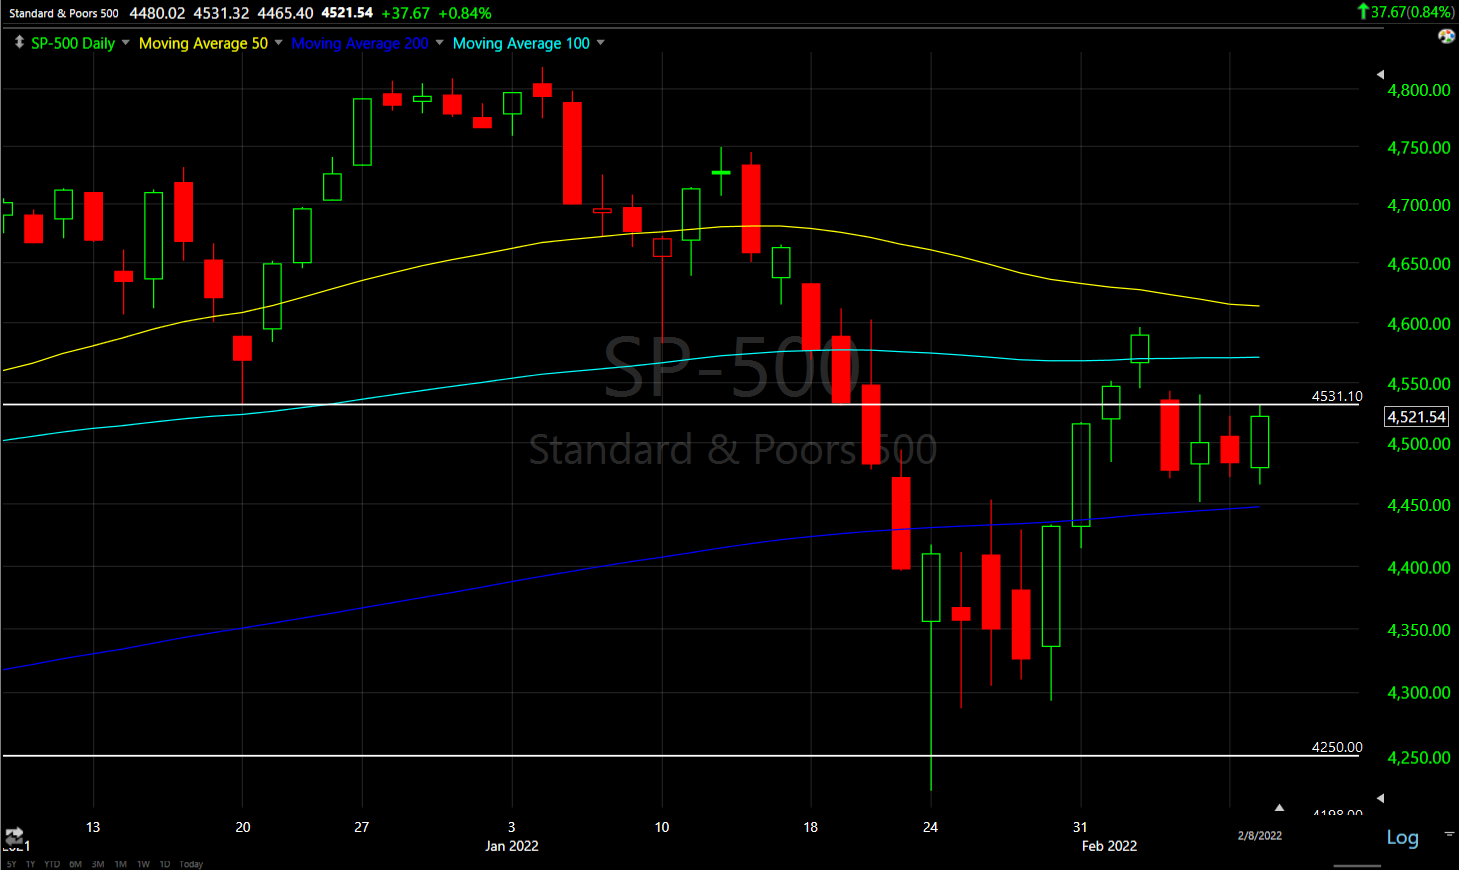 SP-500 (daily) with a stronger close near session highs and a key level of resistance where prices gapped below last Thursday after meeting my initial pside target (light blue 100-day sma).
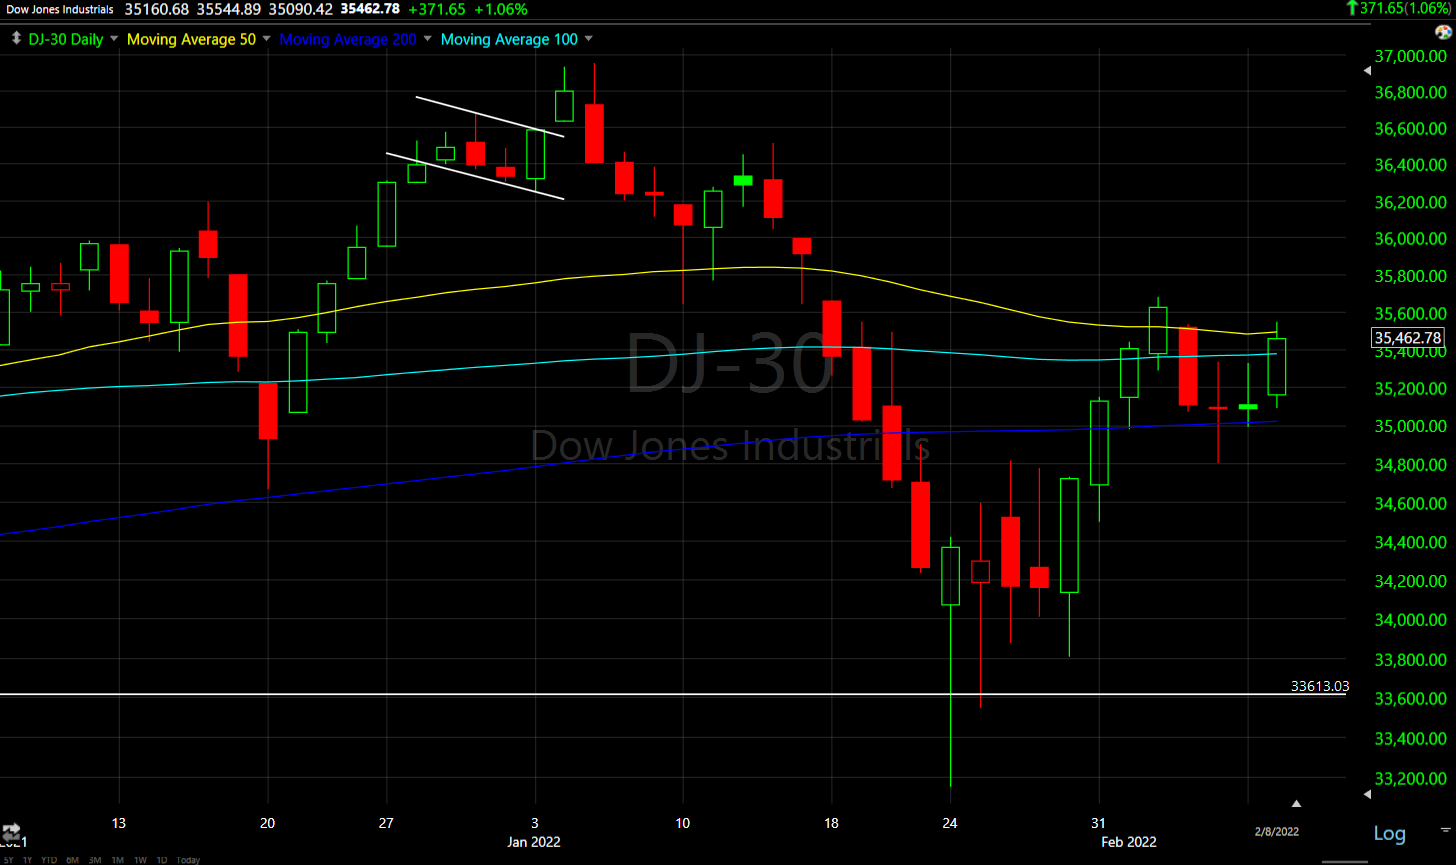 Dow (daily) trading above its 100-day and up to its 50-day (yellow) with a stronger cash close
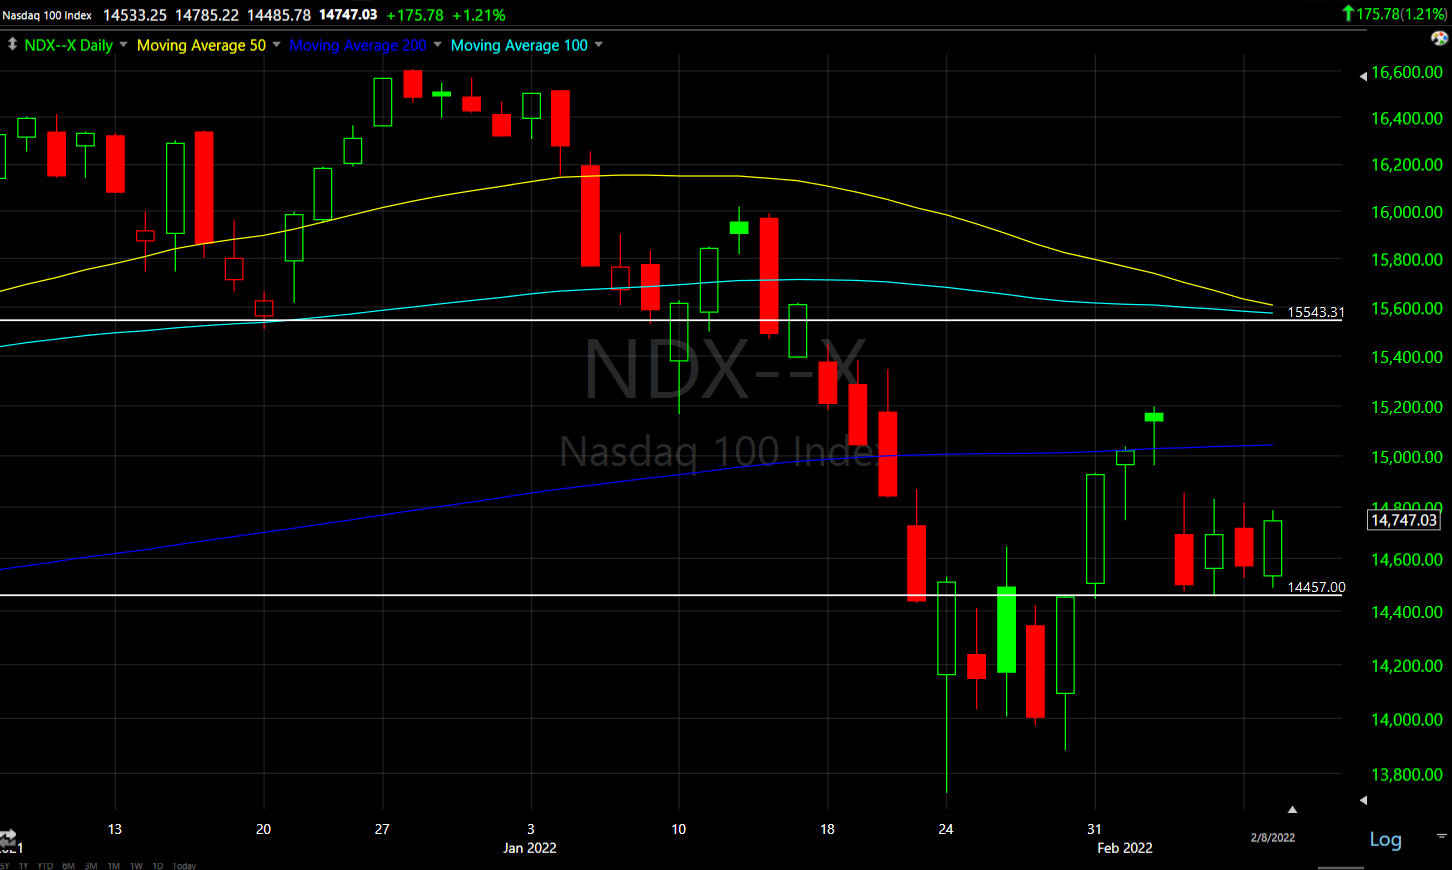 NASDAQ-100 (daily) continues to find support at the trend line, even as yields push higher.
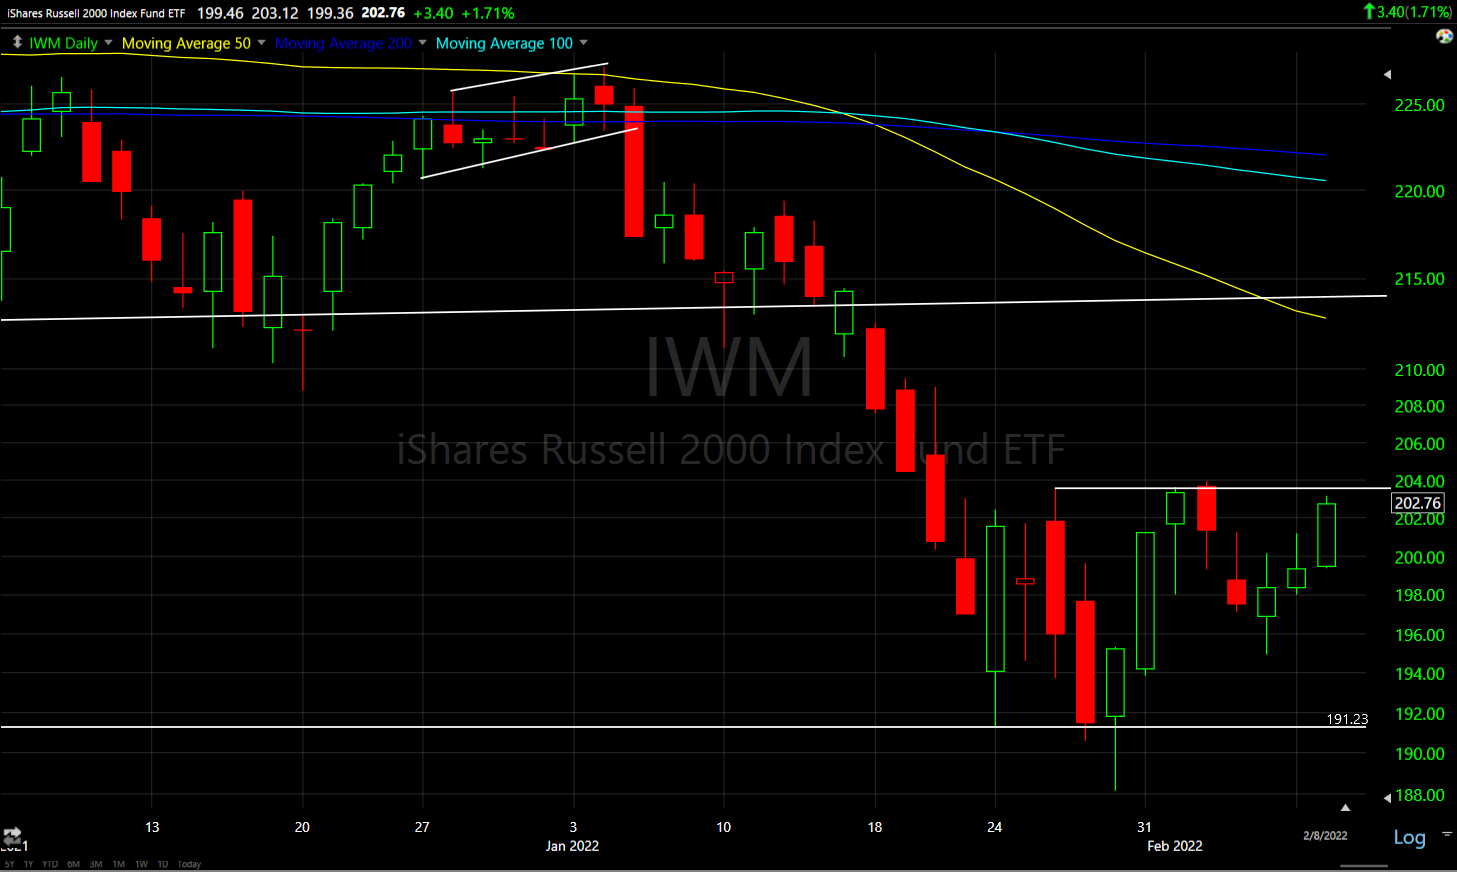 Small Cap IWM (daily) still trading within the range, but challenging resistance. Beyond the very end of January and first day of February , there has been no notable short-covering activity that tends to benefit small caps. A close above the range could very well spark shorts to buy to cover to small caps’ benefit.
One other notable development today was the positive change in character on Index futures 3C charts.
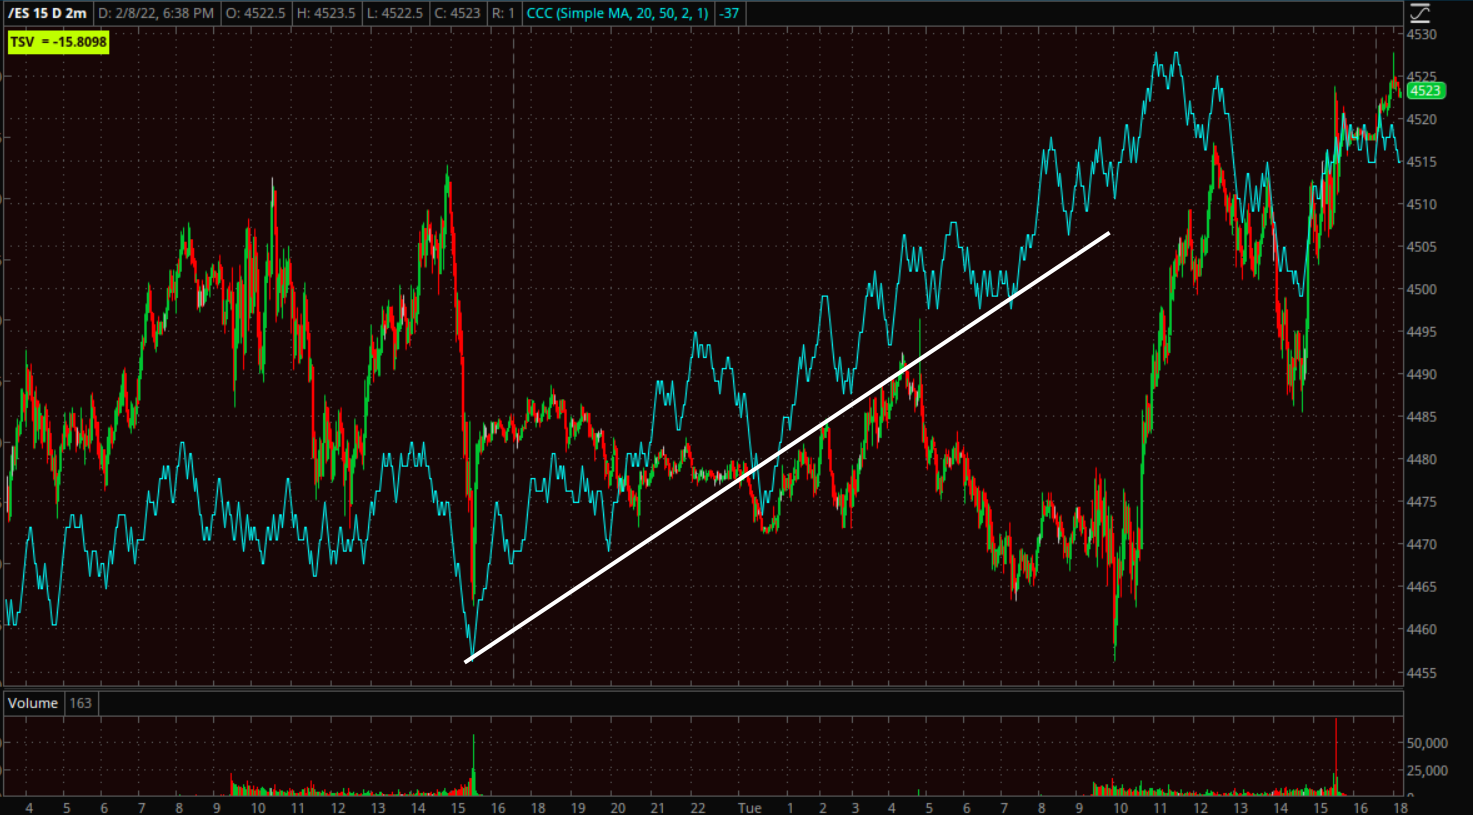 S&P futures (2m) with a positive 3C divergence since yesterday’s close
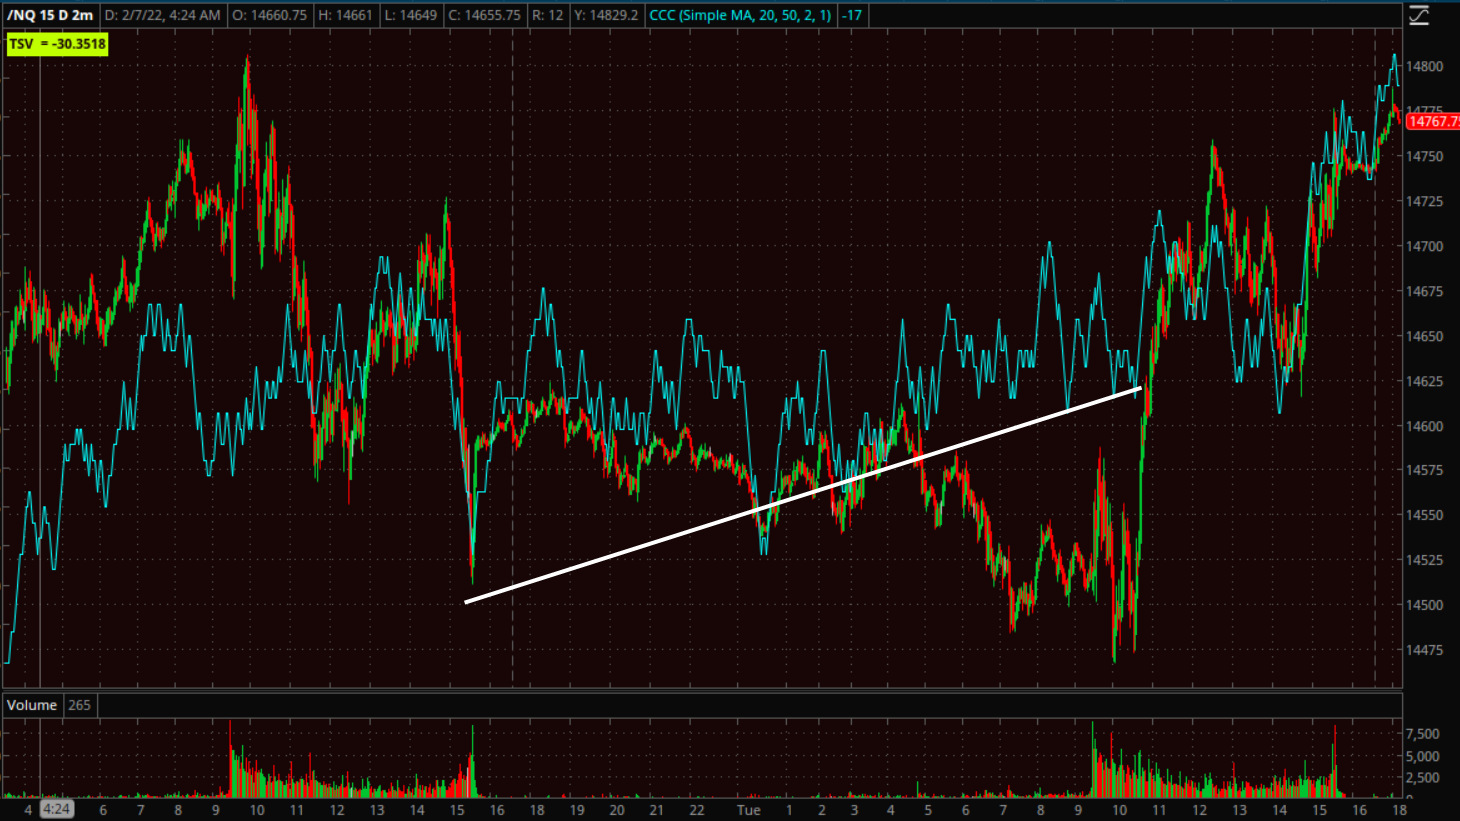 NASDAQ-100 futures (2m) with the same despite higher treasury yields
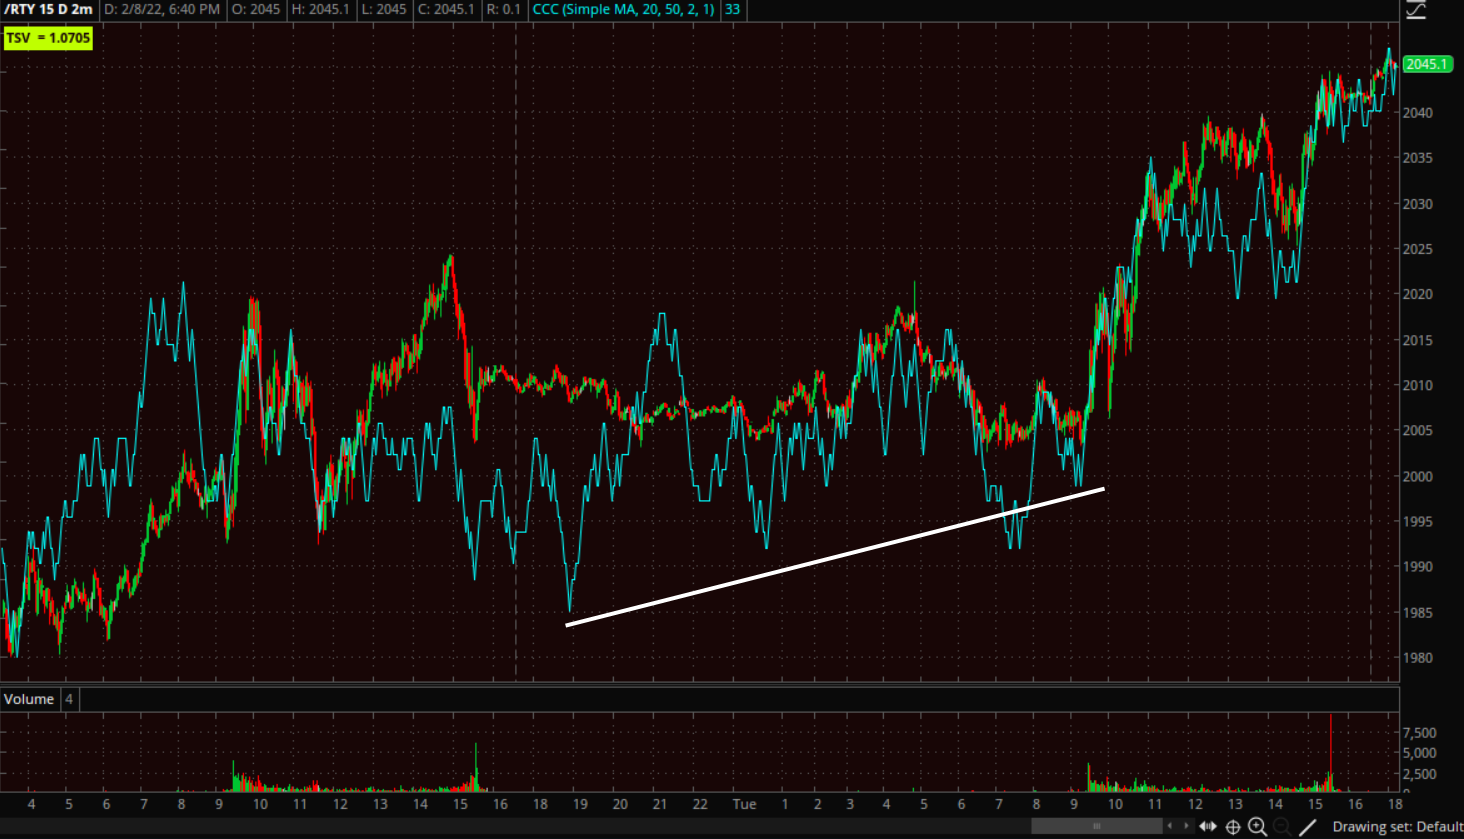 And the same for Small Cap Russell 2000 futures (2m)
Most of the 3C improvement was overnight and not the cash session, but there are a few notable cash charts I’ll touch on in the summary section below.
VIX (-6.2%) displayed more notable relative weakness today as VIX futures’ displayed signs of selling pressure via 3C.
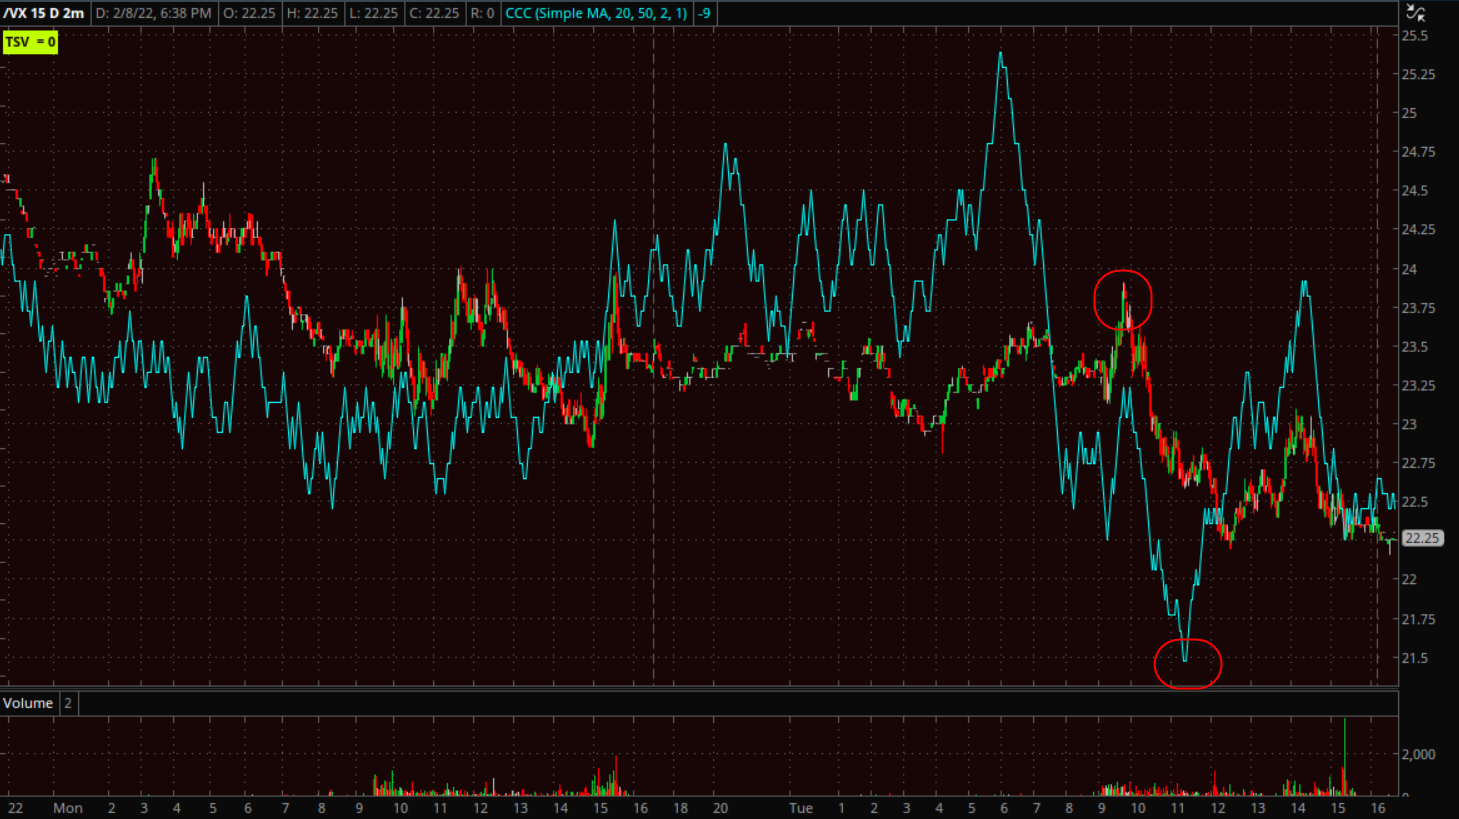 VIX futures (2m) with 3C leading negative into the cash open. Lower volatility is helpful for equity gains.
The Absolute Breadth Index is steadily pulling back at 29 today, but it’s not a sharp move and it’s not yet a meaningful signal. However, on this trajectory, we could see a meaningful signal in the next week or so which could give the averages a little time to try to add to recent gains.
S&P sectors
Eight of the 11 S&P 500 sectors closed higher, including five that gained at least 1.0%. The Materials sector was the top-performer, and the heavily-weighted Technology sector wasn’t too far behind despite higher yields. There was a nice and interesting mix of value/growth sectors that gained today.
The Energy sector, on the other hand, declined -2% as oil prices fell -2.0% amid speculation that the U.S. could allow Iran to increase its oil exports. Reports indicated that U.S.-Iran nuclear talks have made progress.
Materials ⇧ 1.55 %
Energy ⇩ -2.15 %
Financials ⇧ 1.39 %
Industrial ⇧ 1.00 %
Technology ⇧ 1.24 %
Consumer Staples ⇧ 0.38 %
Utilities ⇧ 0.07 %
Health Care ⇧ 0.82 %
Consumer Discretionary ⇧ 1.41 %
Real Estate ⇩ -0.90 %
Communications ⇩ -0.04 %
There were some interesting areas of relative strength. the KBW Bank Index (+2%) and Regional Banks (+2.5%) outperformed with higher yields, without hampering growth stocks.
Semiconductors (SOX +2.4%) tend to lead and outperformed the Technology sector today- again despite higher yields.
Peloton (PTON +25.3%) made headlines today as the company fired the CEO, announced layoffs, dumped the company’s hardware chief, and announced major cost cutting initiatives.
As shown yesterday, mega-caps are at least holding stable despite higher yields, and cyclical sectors have taken up the slack to some degree. Mega-caps acted better today, which was surprising given the spike in yields (Mega-cap Index MGK gained +0.9%). Meta Platforms (FB) was the laggard as expected post earnings with another loss of -2.1% in the wake of poor after hour earnings last week. On a related note, the company said it’s absolutely not threatening to leave Europe over data issues, as previously speculated.
Internals
NYSE Advancers 1943 outpaced Decliners (1313) on slightly heavier Volume of 890.4 mln.
There was no Dominant price/volume relationship and no 1-day overbought conditions.
With better performance from S&P sectors, reflected in better performance of both growth (+1%) and value (+0.7%) style factors, along with better relative performance in Small Caps, it’s no wonder internals are stronger as represented in advance/decline lines that have improved across the board this week (NASDAQ-100, NASDAQ Composite and NYSE).
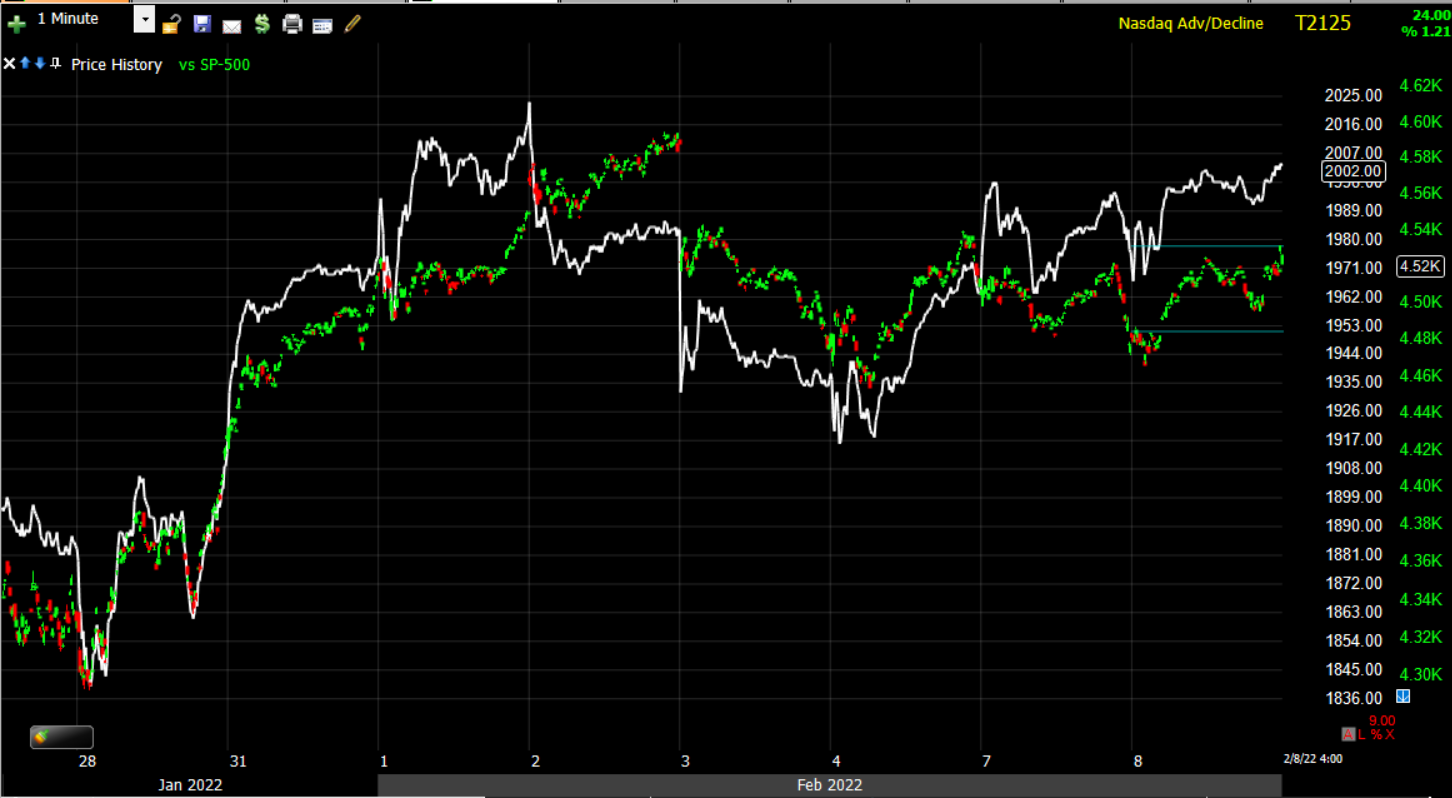 SP-500 (1m) and NASDAQ composite’s A/D line leading price gently higher.
I don’t see any major downside to market breadth (short term) at the moment. It’s not so strong that it’s burning itself out in a day (overbought), but it is making steady progress indicating more stocks across a broader swath of sectors and style facts are participating. that’s not t say that the broader participation breadth trend from most of last year is any better. It’s not, it’s horrible, but that’s a different scale/timeframe than what we are presently looking at right now.
Treasuries
The 10-year yield came within three basis points of the 2.00% level before settling at 1.95%, or four basis points above yesterday’s settlement. The 2-year yield rose five basis points to 1.34% amid lingering expectations for five rate hikes this year. Short-term interest-rate (STIR) markets are now pricing in a 40% plus chance of a 6th rate-hike by year-end and a 35% chance of 50 bps surprise hike in March.
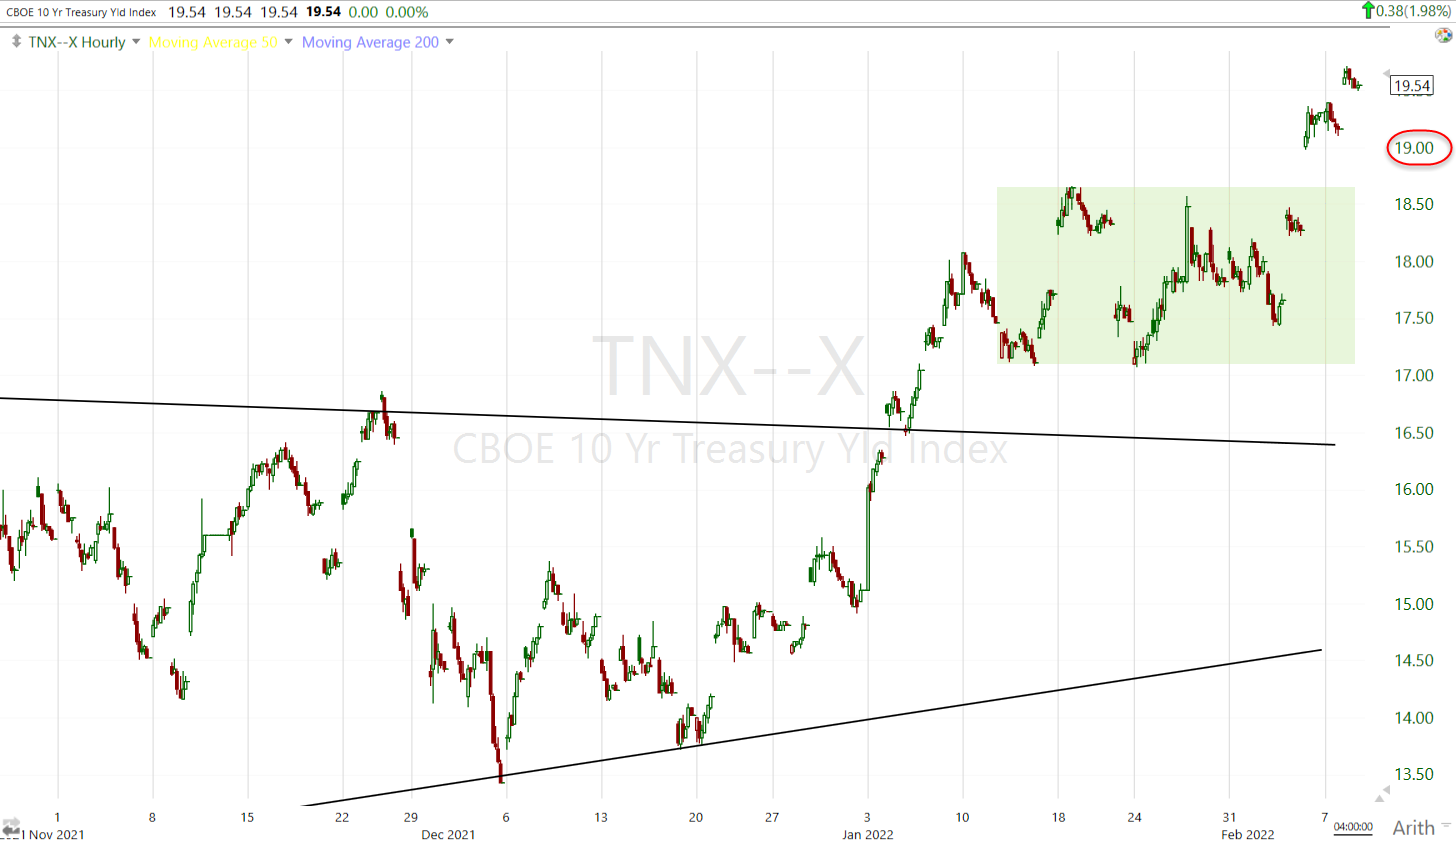 10-year yield (60m) has solidly broken out above the consolidation that offered a window for stocks to rebound off January’s deep oversold levels. I am surprised that growth, large-cap Tech and mega-caps are holding up as well as they are with yields breaking out higher, but I do have a theory I’ll touch on below. Regardless if it’s correct, for the moment the rise in yields is not hampering the attempt of the averages to add to gains, but I do think this will absolutely become an issue for stocks again, and probably not too far off (I’d think within the next week unless Thursday’s CPI report is much better than expected).
The 5s-30s yield curve is nearing January 2022 levels (flattest since January 2019), which tells me that from a monetary policy perspective, the bond market’s view is unchanged. The bond market is very concerned the Fed’ inflation fighting measures will result in a policy error, not a soft-landing.
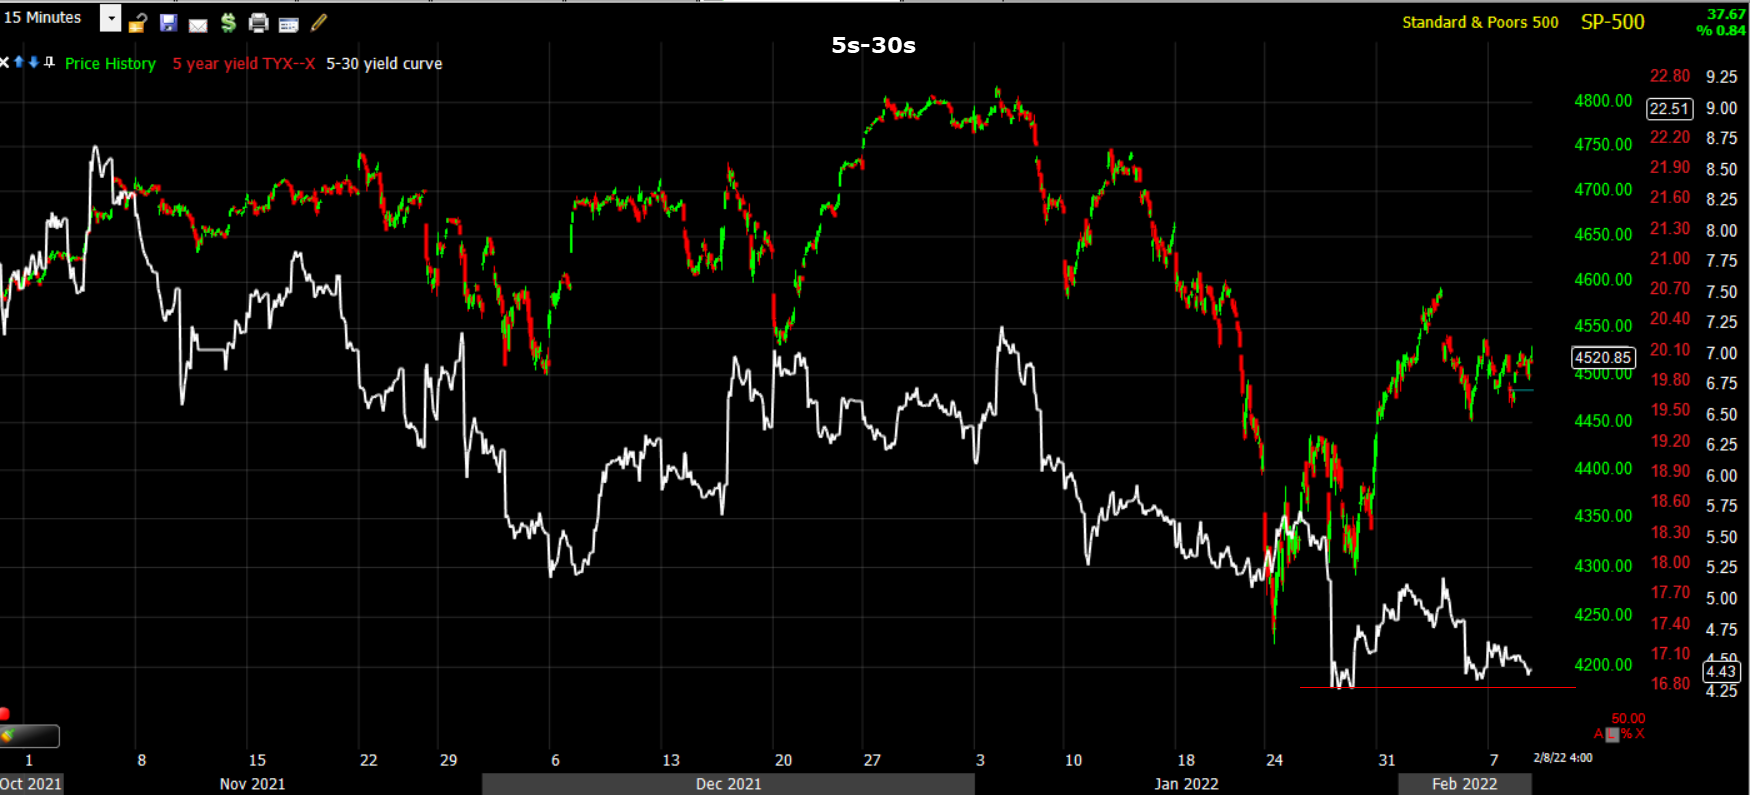
SP-500 (15m) and 5s-30s yield spread.
European sovereign spreads widened further today after blowing out post BOE and ECB last week.
While stocks have not had an notable adverse reaction to higher yields, it’s certainly not helping HY Credit.
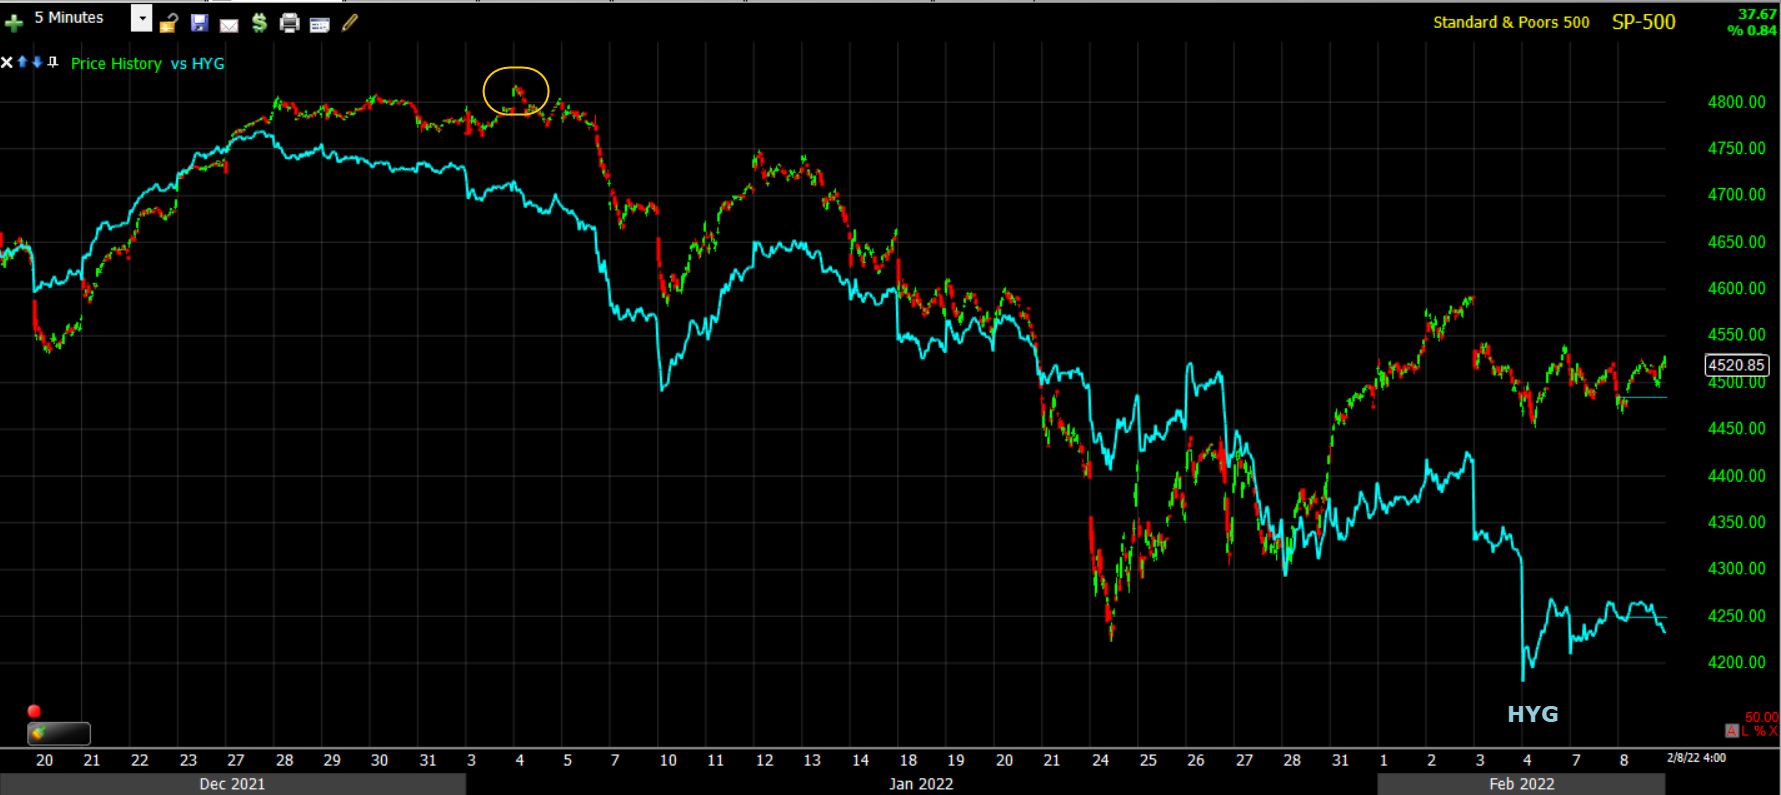
SP-500 (5m) and HYG leading lower as it did at the S&Ps failed breakout from a bull flag that led to the 2022 decline (yellow).
My broader credit index doesn’t look as bad, but it’s not good either. At best I can say it’s flat the last several days.
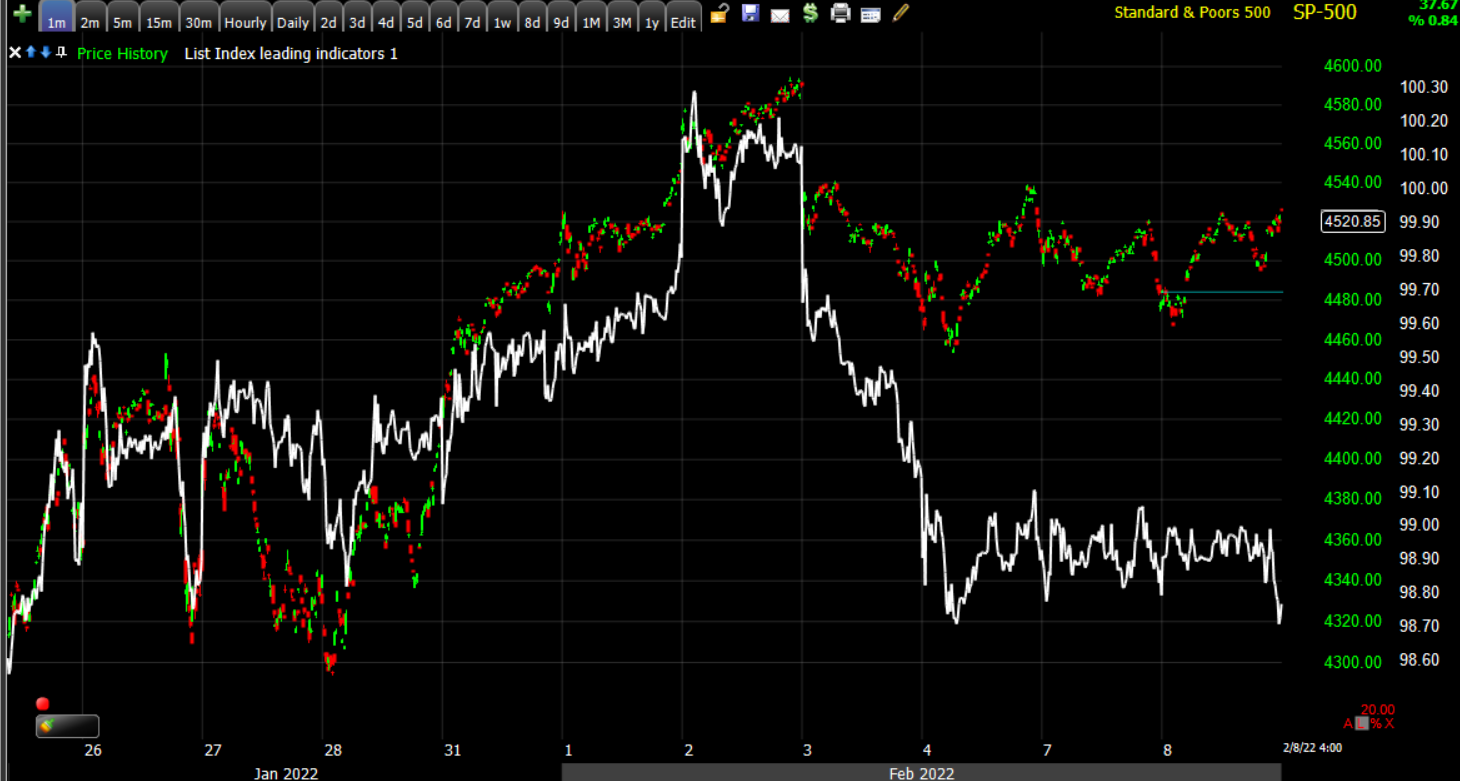 SP-500 (1m) and my credit index
Currencies and Commodities
The U.S. Dollar Index increased +0.2% to 95.60, but still within a fairly narrow range and below Friday’s Payrolls levels.
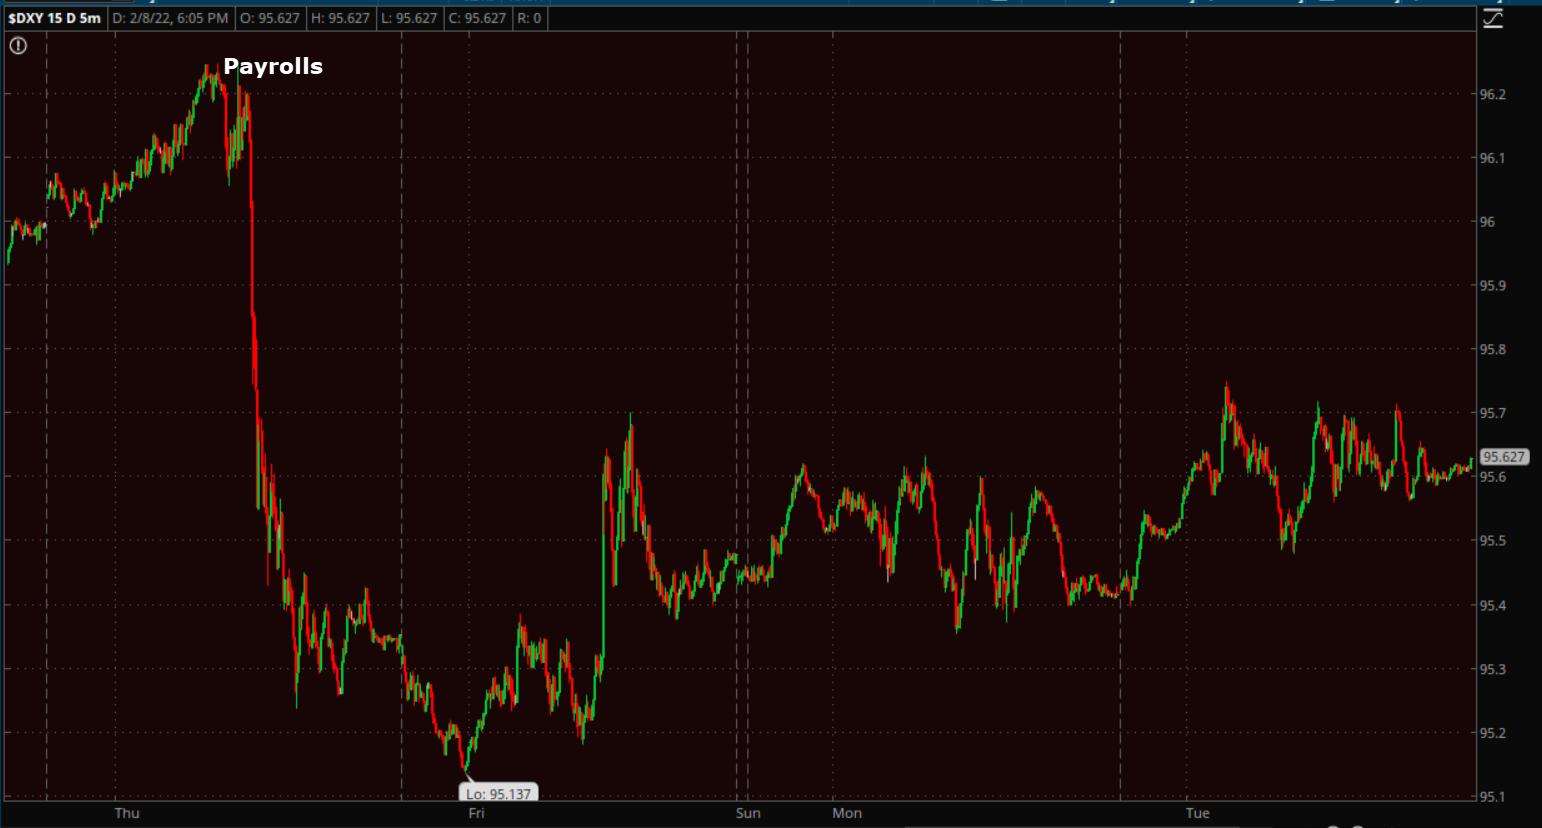 U.S. Dollar Index (5m)
WTI crude futures settled lower by -2.0% to $89.43/bbl amid reports indicating that U.S.-Iran nuclear talks have made progress, raising the possibility that Iran would be allowed to increase its oil exports. Crude has fallen about -3.75% since the end of last week and I have a theory as to why stocks are thus far tolerating high treasury yields ahead of Thursday’s CPI because of it. I’ll touch on that in the Summary.
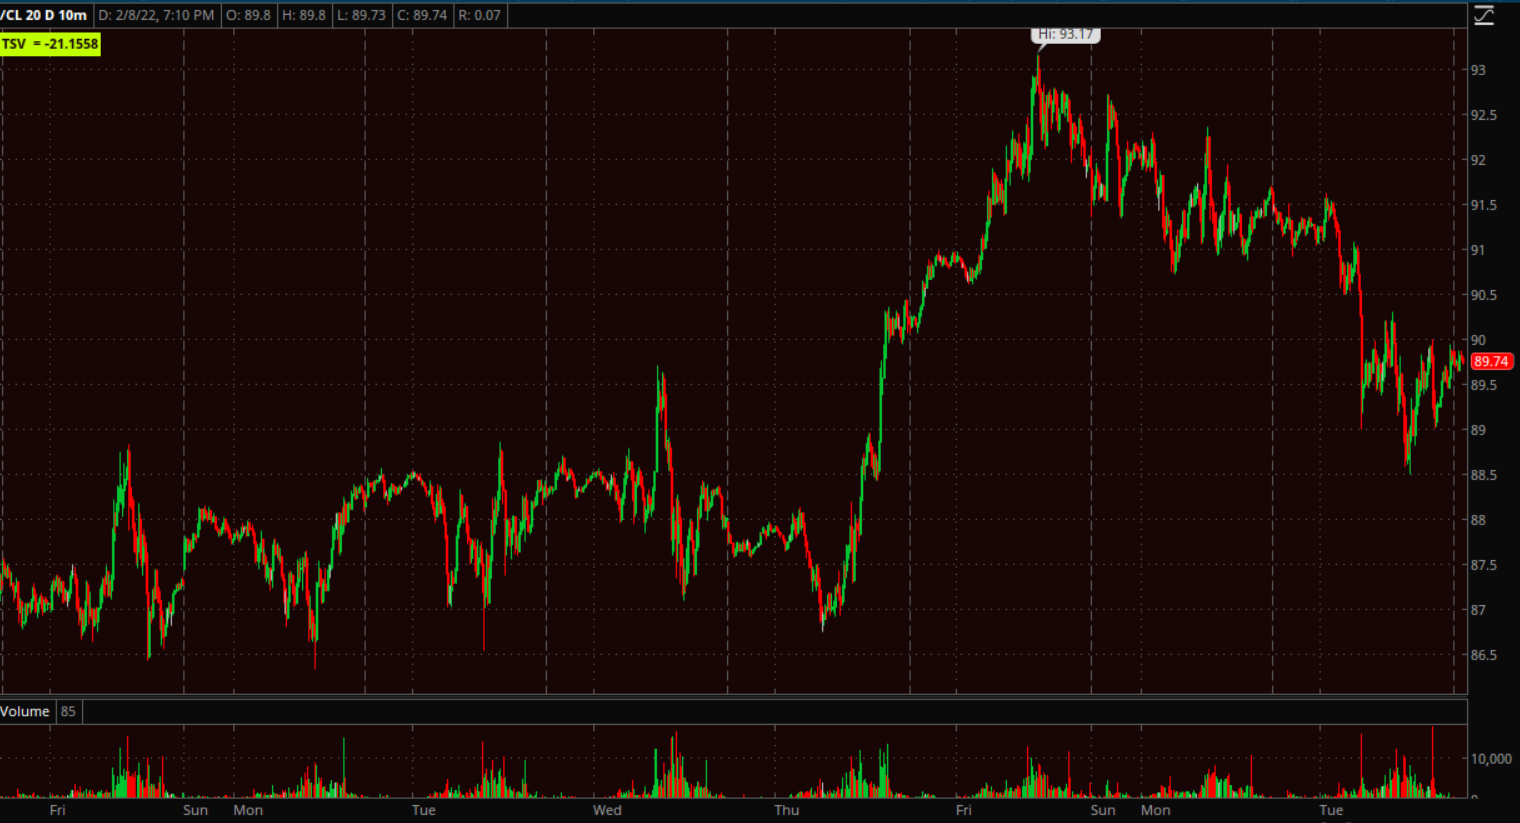 WTI Crude (10m) – over 3 days this is a substantial pull back, but it is not a change in trend (inflationary) by any means.
From last night’s Daily Wrap (overnight futures section),
“Gold futures are unchanged (0%), but consolidating earlier gains so they do have a very short-term bullish bias into tomorrow at $1821. The next key level for gold is resistance at $1830.”
Despite a modestly stronger Dollar and higher yields, Gold futures gained +0.3% to settled at $1,827.90/oz.
 Gold futures (2m) shows the bullish consolidation of yesterday’s gain overnight (white) and a resumption of the advance today right up to the next key zone at $1830.
What’s a little different this time as opposed to December and January is 3C is looking better now, whereas it was barely confirming the move above $1800 then, and certainly not confirming anything at or above $1830.
 Gold futures (30m) with 3C positively diverging at the sub-1800 lows, and confirming, if not leading the advance up to $1830 -which is the next key technical zone to overcome.
Bitcoin rallied back above $45k today but faded during the US day session as DoJ announced seizure of the Bitfinex hack haul.
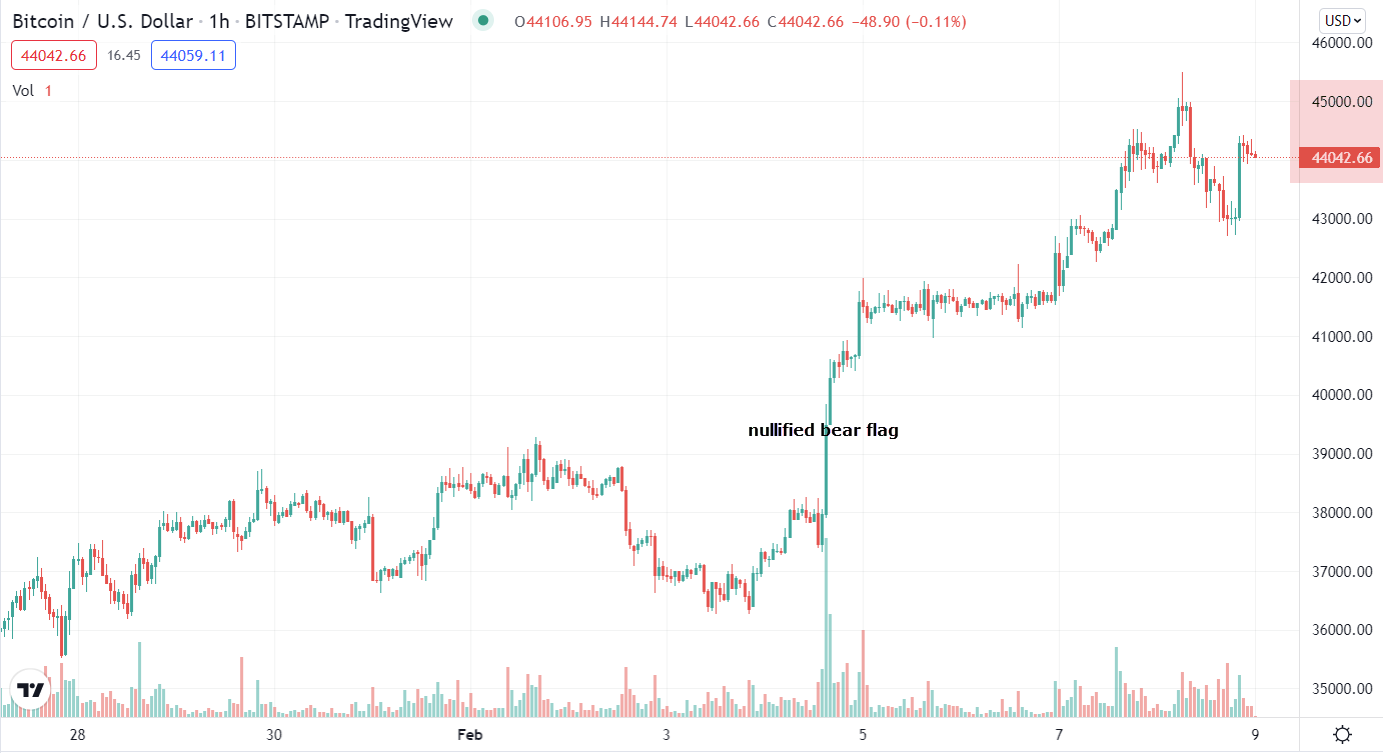 USD/BTC (1h) did enough over the weekend to nullify the bear flag that held an $8k-$10k next leg move downside measured move, but it now faces a zone of overhead supply from the $44k to $46k area.
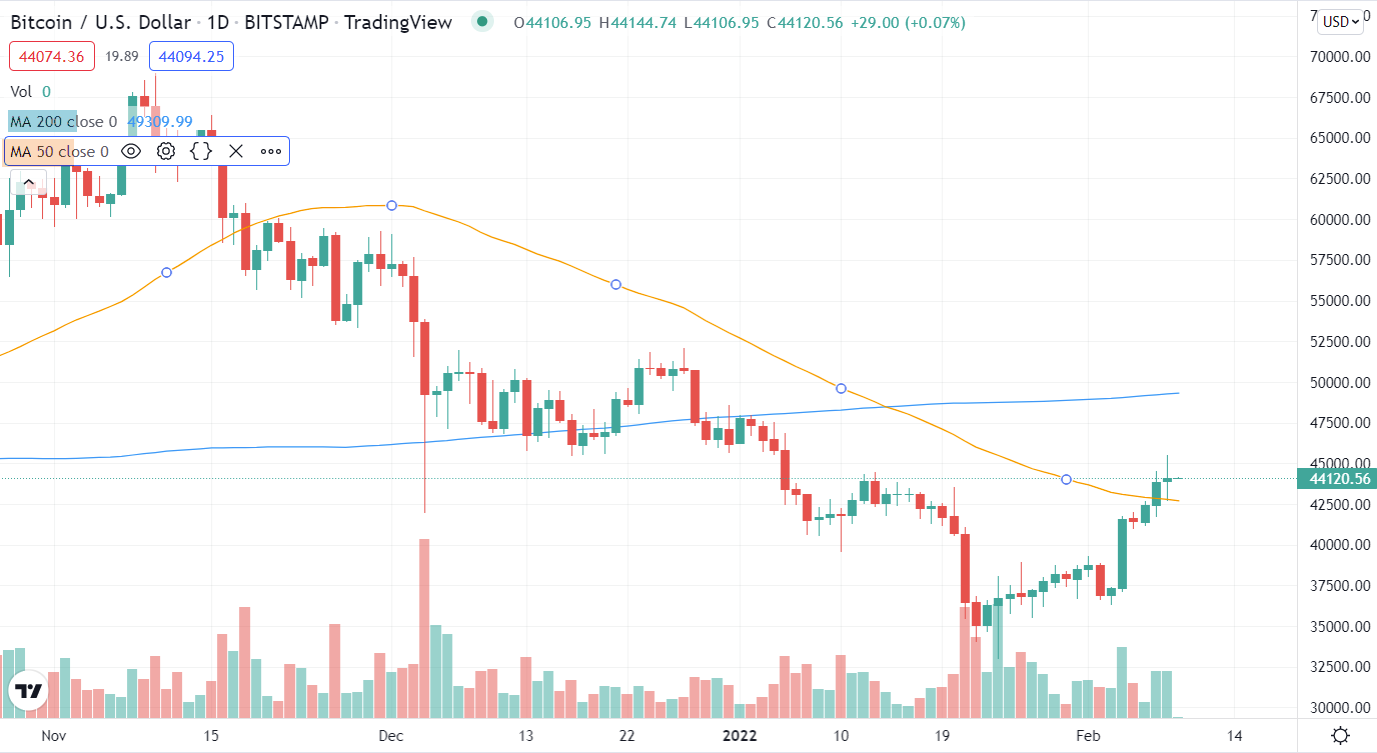 USD/BTC (daily) w/ 50 and 200-day sma’s.
Summary
I am a little surprised the broader market, but especially the growth and mega-cap heavy sectors acted so well today with yields resuming their march higher. The higher rates benefited the financials sector without hurting the growth stocks which results in improving market breadth/participation. The Russell 3000 Growth Index rose 1.1%, along with a 0.7% gain in the Russell 3000 Value Index.
Crude oil’s -3.5% decline since Friday may be giving the market some confidence that Consumer Price Inflation (with the key CPI report out Thursday) could be slowing. The truth in my view is that a 3-day pull back in crude is not likely to have an impact on Thursday’s CPI report, and crude has certainly been trending higher and the pull back is no change in trend, but from a psychological view, the decline in energy prices may be why traders/investors have tolerated the recent advance in yields (with the 10-year yield breaking out of a 4 week consolidation) in hopes that inflation (at least via Energy prices including Nat Gas) are slowing. Natural gas futures have come down something like 25% since last Wednesday. The market always looks to the future, and while crude’s pull back is not trend changing and I doubt very much it will end up being trend changing, it may have been enough of a factor (from a psychological perspective) to give the market hope that the pace of consumer inflation is starting to slow and thus not be as concerned about the recent renewed rise in yields ahead of Thursday’s CPI report. Of course this is speculation, but Energy costs filter through to just about everything (cost of plastics, cost of groceries, transportation of goods/services, etc. you name it). That is of course speculation on my part.
What I do see is a bullish-looking consolidation since the S&P tagged my main upside target (100-day sma) last week.
SP-500 (15m)
And now we’re seeing strong 3C charts in index futures, but given the consolidation pattern in the S&P above (and other averages), what I found interesting was UPRO’s 3C chart.
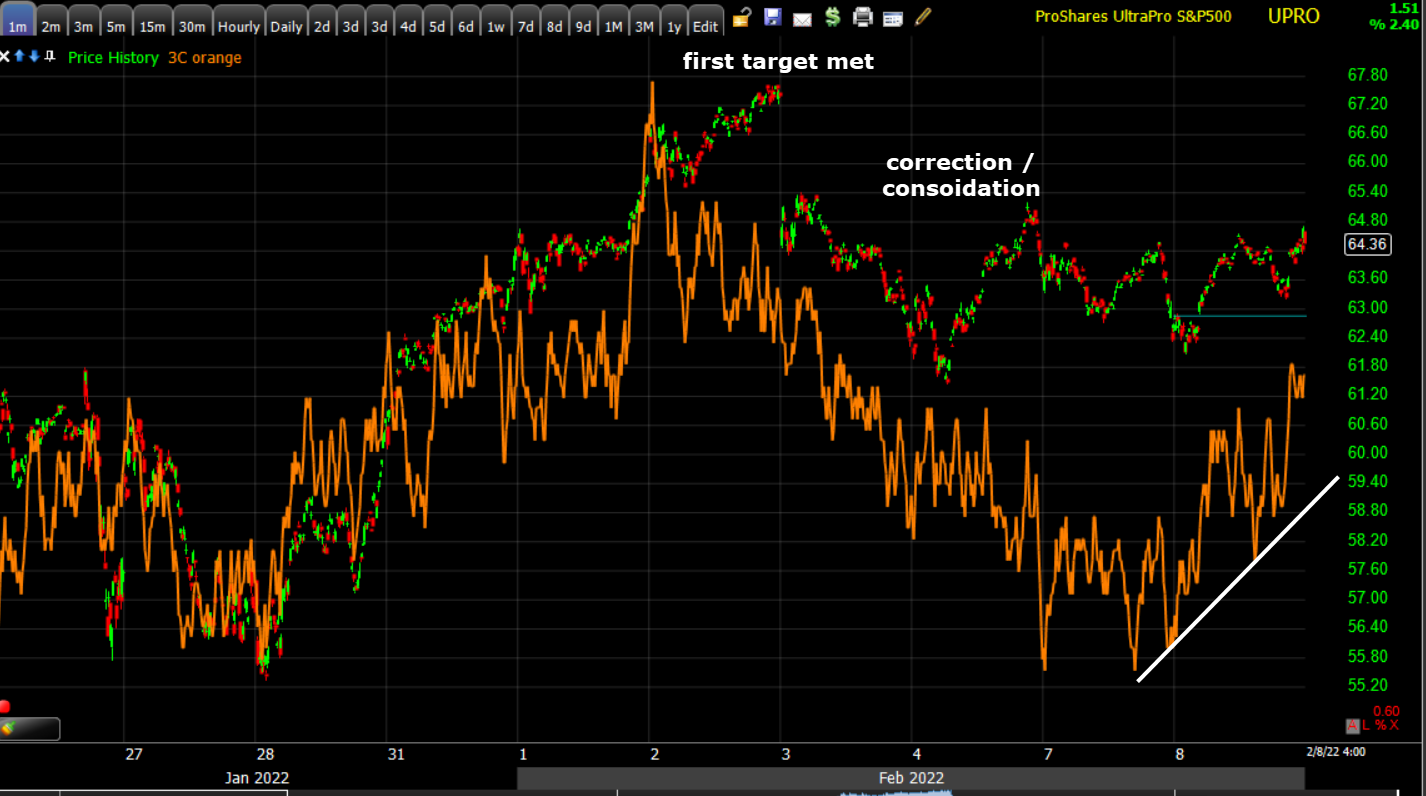 UPRO (1m) 3C depicted a pull back after the 100-day was hit and price gapped down the next day. Since then price action has been trending like a bullish consolidation with a next leg up being the implied probability. Often 3C will be first to call out a consolidation phase (from an advance) and toward the end of the consolidation, 3C will show an increase in buying before the consolidation breaks out. That appears to be exactly what I’m seeing on UPROs 3C chart today (white trend line).
From a risk perspective, I’d prefer to see that next leg or price advance take place before massive event risk in the form of Thursday’s CPI report. Of course a weaker than expected CPI report could be a major bullish catalyst and perhaps give some more credibility and meaning to the recent pull back in energy prices, but I am nowhere near comfortable making that kind of speculative jump in theory.
In any case, while this has not been a bounce or rally with strong, or even decent bullish signals, the one that has been most consistent has been 3C and it’s still constructive so I’m still long the S&P via UPRO and will sit tight with that position until ether the S&P’s 50-day is tagged, or 3C deteriorates (or the other market signals get so bad that 3C alone can’t offset the probabilities). This truly has been a day-by-day, hour-by-hour assessment and reassessment of the charts and market signals. That said, I’m not looking for much more upside than the S&P’ 50-day, although there are some open gaps a bit higher. At that point I don’t think the diminishing returns on the upside are worth the increasing risk on the downside.
Overnight
S&P futures are up +0.15% qt $4520 (cleared $4500 resistance).
WTI crude is little changed (+0.25%). Gold futures are unchanged just below the next key level at $1830.
Since the Afternoon Update I am seeing Treasury futures’ 3C charts and price action suggests that yields come down a bit and that should be helpful for the broader market. It’s nothing so exciting as to put much on it beyond that, but it should be helpful.
Treasury futures (examples of 5 and 30-year below) have positive 3C divergences and prices moving higher tonight.
 5-year Treasury futures (2m)
 30-year Treasury futures (2m)
Remember that treasury prices move opposite yields so that should help stocks with yields coming down a bit.
Looking ahead, investors will receive Wholesale Inventories for December and the weekly MBA Mortgage Applications Index on Wednesday.