Stock Market Analysis: Did Omicron Just Throw the Market Into Complete Upheaval?
*I’m making this subscribers’ post public because today’s events have the potential to reshape the entire market landscape, but I will have to censor some of the insights that are reserved for subscribers only. Hope you enjoy it.
A day is a day, not a trend, but today looks to be a pretty serious watershed day as the S&P-500 (-2.3%) just saw the worst post Thanksgiving/Black Friday decline in 80 years (1941). The cyclically and value biased Small Caps (-3.75%) were worse, down over 5% intraday and posting the worst day since June 2020. In Europe the Stoxx 600 index ended down -3.1% and the U.K.’s FTSE 100 down -3.2%.
Generally the pro-cyclical S&P sectors were sold hardest today with Energy (-4%) and Financials (-3.3%) the worst S&P sectors, while sub-sectors like Banks (Regional Banks -5%) and airlines (JES ETF -7.2%) displayed relative weakness. Stay-at-home stocks like Zoom Video (ZM+5.7%) posted decent gains, as did some vaccine makers like Moderna (MRNA) up 20.5%, and BioNTech (BNTX) up 14.2%. The Health Care sector (-0.37%) and 2 defensive bond proxy sectors were the least worst on the day.
The catalyst for the ugly day? A new COVID variant called Omicron (earlier reports suggested it would be called “Nu”). The World Health Organization designated Omicron a “variant of concern.”
We’ll take a look at some of the initial information about the COVID variant below, but in short the uncertainty about Omicron is what caused the market to roil in spectacular fashion across multiple asset classes today. The attitude was, “sell now, and wait for answers later”.
As mentioned in last Friday’s Afternoon Update,
” I suspect that after today’s op-ex and unclench of heavy gamma at $4700, we will probably see some more interesting and volatile price action”
Here’s the S&P on the week acting much more volatile…
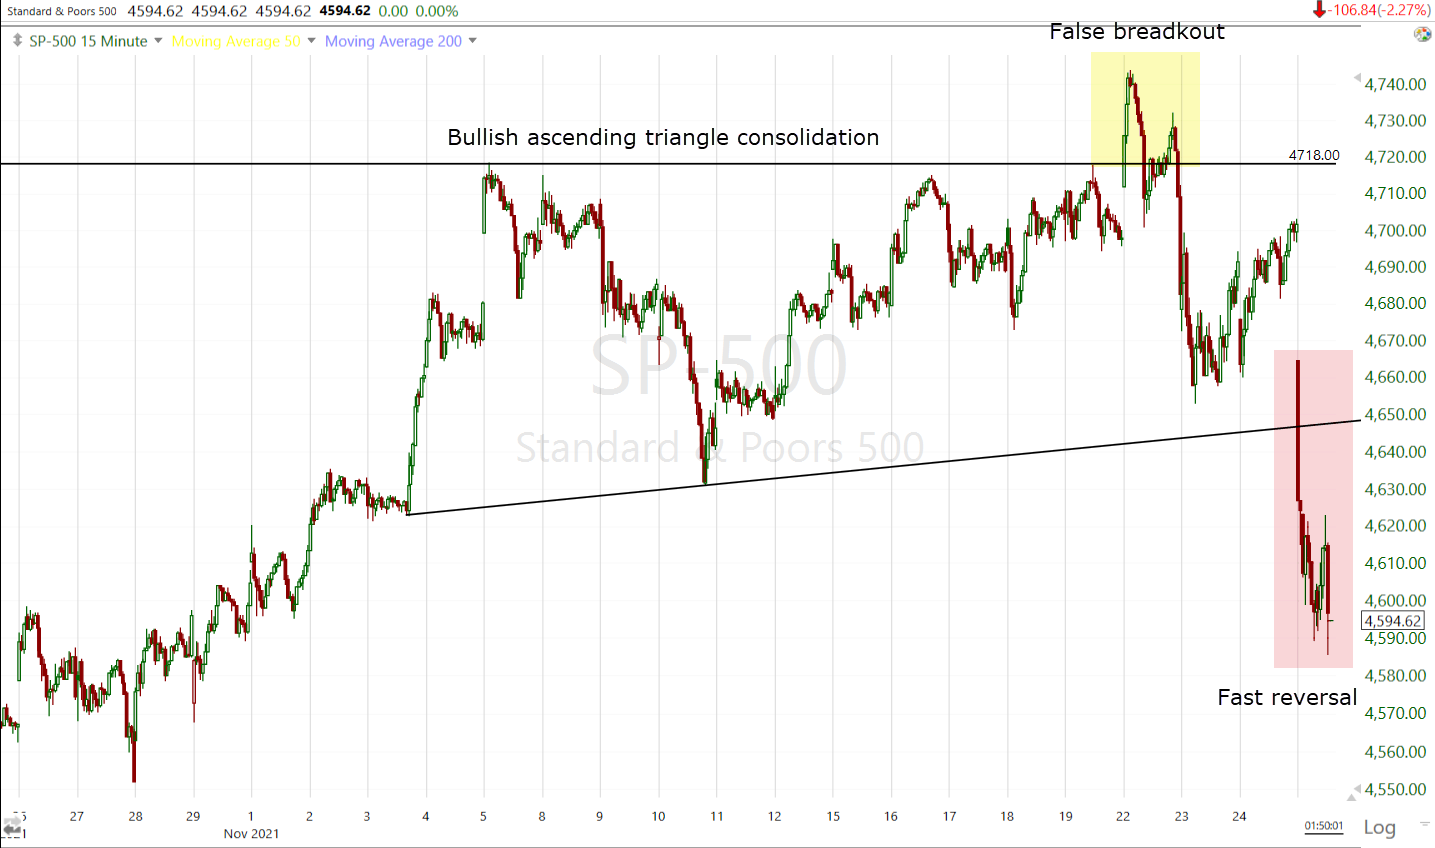 SP-500 (15m) with a breakout above a bullish ascending triangle on Monday. However, as noted in Monday’s Early Update, there were plenty of contradictions questioning the validity of the breakout, “it would seem like a scenario ripe for a head fake.”
Just 3 days later and the lower consolidation support trend line is broken, locking in the head fake and making the fast reversal scenario a very high probability that has already started.
The head fake scenario wasn’t a guess, it was a series of yellow flags piling up. One of my favorite leading indicators was not confirming the bullish price consolidation in the S&P.
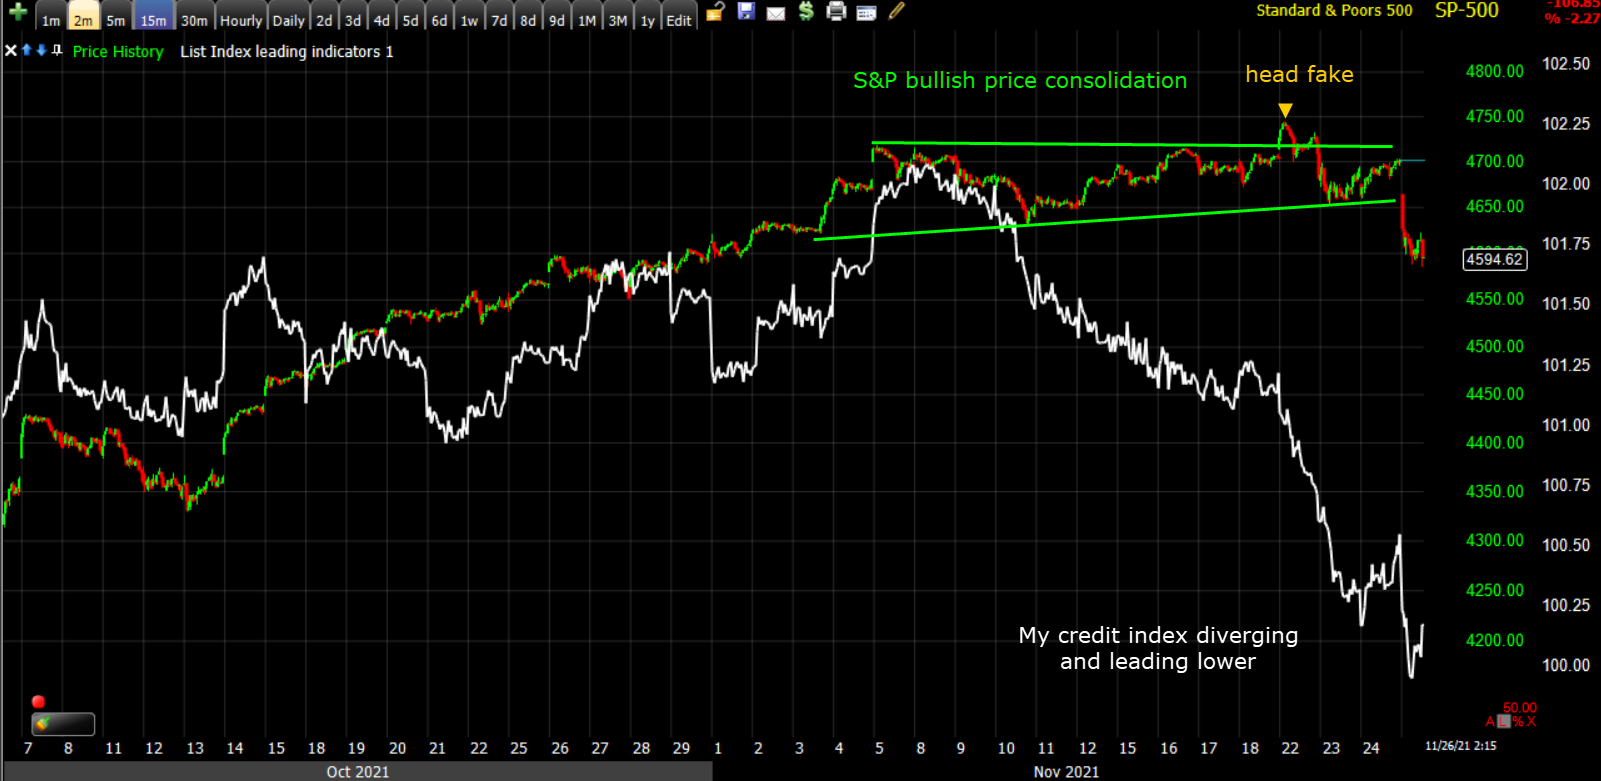 SP-500 (2m) and my broad custom credit index negatively diverging in the second half of the S&P’s consolidation and leading the S&P lower.
That’s to say nothing about High Yield Credit not playing along and not confirming the majority of the rally from early October lows.
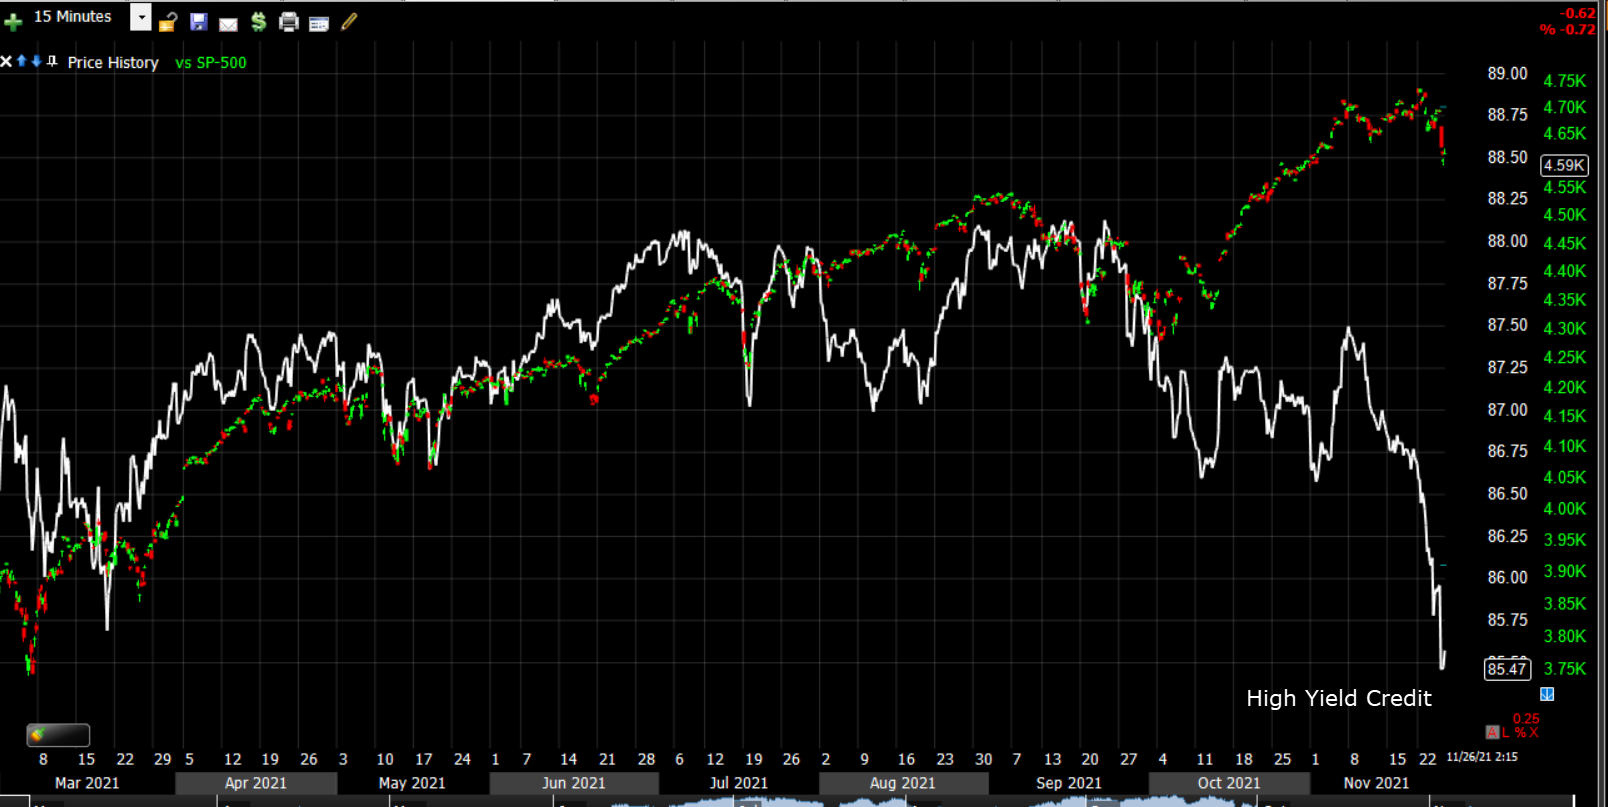 SP-500 (15m) and HY Credit leading lower
Some other quick stats on the day –
- The Dollar Index fell -0.7% for its biggest drop in a month, but still ended the week higher! This is a dovish signal.
- The 10-year yield was down 16 basis points to 1.49%, its largest single-session decline since March 2020. Another dovish signal
- WTI crude futures fell -12.3% to $68.80/bbl. – the worst day since June 2020 when WTI traded negative – and breaking below the 200-day sma.
- The CBOE Volatility Index jumped +54% to 28.62, the biggest jump since January. Recall it was just last Wednesday that we got the ABI signal suggesting a double digit percentage move in the VIX index was to come shortly.
- Gold (+0.35% to $1793.40) traded modestly higher, but couldn’t overcome the $1800 level as suspected.
- At last check Bitcoin was trading down near -8%. Recall that in October Bitcoin acted as a very clear inflation hedge.
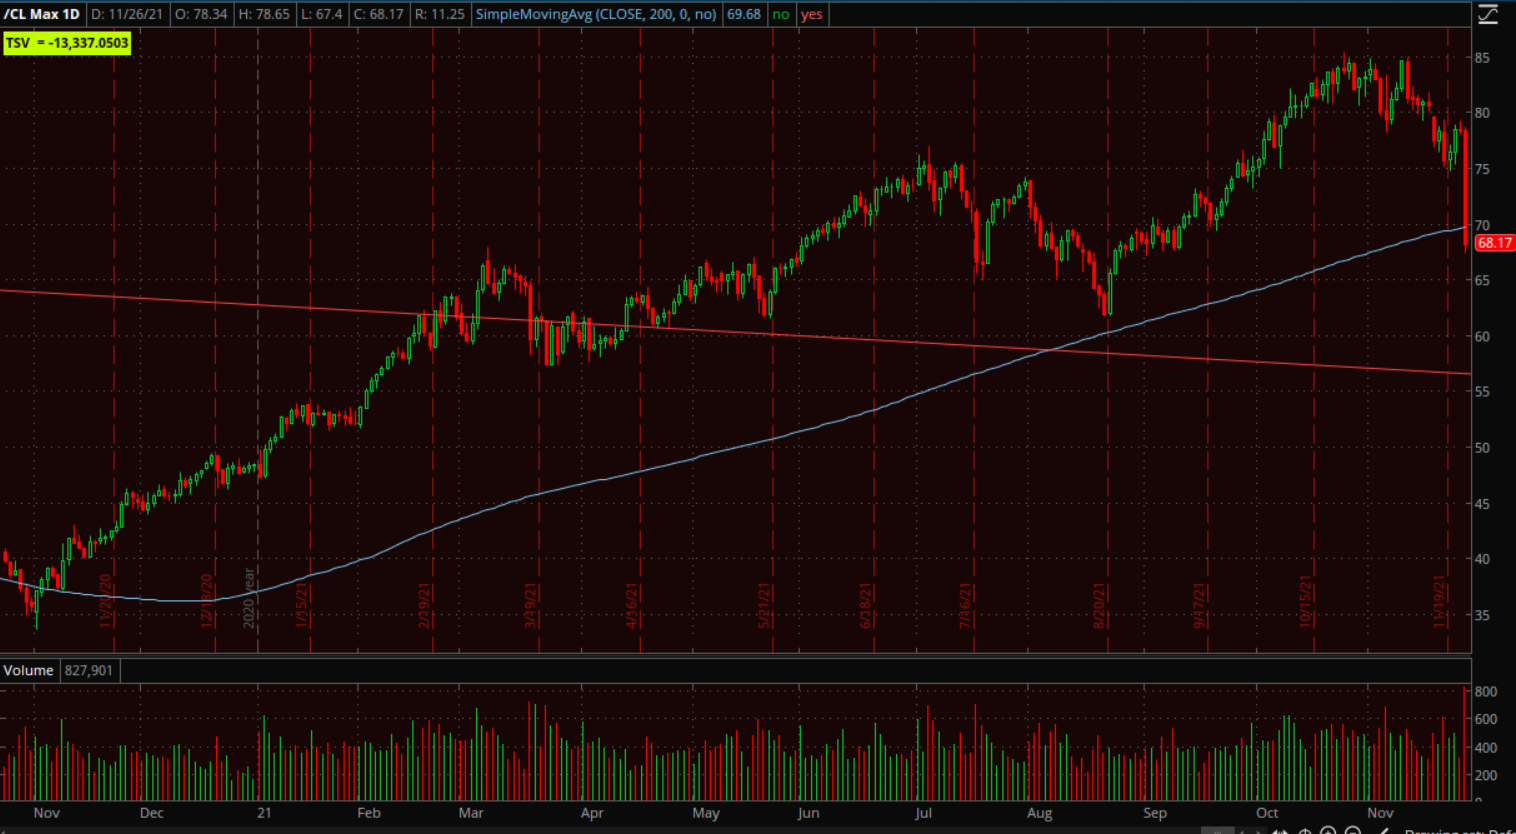 WTI Crude futures (daily) w/ 200-day sma. The red trend line is the long-term primary downtrend from 2008, so the fact crude broke above it in the first place was a major inflationary signal. Today’s price action is deflationary and technically significant.
What is Omicron?
The newest mutation of COVID, named “Omicron (rather than earlier reports suggesting Nu), is the most heavily mutated variant of the Coronavirus thus far. It has 32 mutations in the spike protein (that enable infection) and 50 overall. Scientists have highlighted that there are 10 mutations vs. 2 in the Delta variant regarding the receptor binding domain, which is the portion of the virus that makes initial contact with cells.
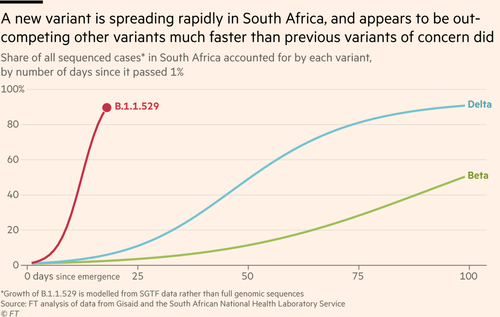
The Omicron variant was identified 5 days ago initially in Botswana with subsequent confirmation and sequencing in South Africa with nearly 2,500 COVID cases were reported there on Thursday, when just two days previously the daily tally had been under 900. Something like 100 cases have been confirmed as the new variant, but suspicions are that 75% of those infections are the new Omicron variant. South Africa’s full vaccination rate is low at just 24% of the populace, so that makes it difficult to judge how effective vaccines are.
Cases have been detected in Israel and Hong Kong, and as of this morning, in Belgium. The confirmed case in Belgium had no clear link to the Southern Africa region, raising the possibility that Omicron is already transmitting in Europe.
One of the biggest fears, which early data suggests is likely, is that Omicron is spreading faster than the Delta variant, but it will take 2-3 weeks of data to get a more definitive picture.
Several countries, including: Britain, France, Israel, Italy, and Singapore are moving fast to restrict travel from South Africa and other countries. The UK has placed much of southern Africa on the red list, with Israel India, Japan and Singapore also taking similar measures.
On Friday afternoon, the European Commission President proposed suspending air travel to southern African countries from all 27 EU member states – a measure that had been already been taken by Germany, France, the Netherlands and several other EU countries.
The WHO classified Omicron as a variant of concern (VOC) today (Friday 11/26/2021).
The new variant’s transmissibility has not yet been determined, but many of Omicron’s mutations have been seen in other variants that appear to make transmission easier. The fear is that the new variant could partially evade the immunity that people have gained against COVID-19, through either vaccinations or infection, and they are also concerned that it could prove resistant to some treatments like monoclonal antibodies that some COVID-19 patients are given.
Because the strain was only identified 5 days ago, there’s no information with regard to the strain’s hospitalization or mortality rate which could take 6 to 8 weeks to determine under real world circumstances. It’s also too early to tell how much efficacy vaccines will have. There is one report of a Hong Kong resident who was double Pfizer vaccinated having experienced a breakthrough infection. Also yet to be determined is if the new strain will be able to outcompete the Delta strain as it appears to be doing early on as per the graphic above.
Vaccines…
Due to the large number of mutations, there are serious concerns about vaccine efficacy. Vaccine efficacy will determine the severity of lockdowns, and therefore whether this becomes another recession.
MRNA vaccine producers have previously said that they can adapt their vaccines within 6 weeks. This morning Pfizer’s CEO confirmed a new vaccine would take more than three months to develop – specifically 100-days was quoted. This means MRNA vaccines wouldn’t be available until early January, and Pfizer not until late January, then there’s distribution and jabbing enough of the population to have some sort of “herd” immunity, which moves into February-March.
The main issue would be getting these vaccines developed, distributed and circulated amongst the population, and certainly in a timely manner. This will be even more difficult in Emerging Markets which is reflected in EEM’s (-3.4%) worse relative performance today.
Market Reaction…
DEFLATIONARY… I always say, “a day is not a trend”, and this is not the first COVID variant that has spooked markets and later turned out to be nothing of consequence. Still, we know what we know at this early date and the market’s response today was interesting given that until today, the market spent the first half of the week discounting a more hawkish Fed since Powell’s renomination for Fed chair on Monday. In today’s holiday shortened session the action was quite clearly deflationary as seen in the plunge in crude oil prices, bond yields and the weak tone among pro-cyclical sectors.
Deflationary doesn’t necessarily mean recessionary, but it certainly could. For long time subscribers you may recall I was pounding the proverbial table toward the end of 2019 and early 2020 that we were getting very clear deflationary signals from multiple asset classes including commodities, currencies and rates as equities traded to all-time new highs. These other markets that were sending the same deflationary signals were right and preceded one of the most aggressive crashes in history with the S&P dropping -34% in 3 weeks. And that brings us to….
Central Bank Tightening Plans Thrown Into Disarray…
One of the most notable themes this week was how much more hawkish the rates and currency markets got after Powell was renominated as Fed chair. That really dominated trade the first 3 days of the week leading up to the Thanksgiving holiday. Today that increased hawkishness regarding central bank tightening pulled back, evident in the weaker Dollar and the Fed-sensitive 2-year yield sharply lower.
For as long as I can remember, certainly decades, the Fed’s prescription to a recession was to ease monetary policy, which usually meant cutting the Fed funds rate by 500-550 basis points on average. With the Financial Crisis of 2008, slamming the Fed Funds Rate down to zero was not enough and like the Fed did during the Great Recession, they once again began buying assets and expanding their balance sheet by trillions of dollars. The Fed is prohibited by law from directly monetizing the nation’s debt, which means they can’t buy treasuries in the primary market, but they can buy from primary dealer/banks like say a Goldman Sachs. The Fed buys treasuries with money printed out of thin air. That money eventually makes its way into asset prices (Real Estate, Stocks, NFP’s, Cryptos, you name it – virtually anything yielding more than nothing on your savings account) and inflates them. Don’t take my word for it, look at the Fed’s balance sheet since 2008 and the equity market.
The Sudden Change…
The market has sent a number of signals in recent weeks that I’d consider “yellow flags”. For instance, the Australian Dollar not only not confirming the S&P’s bullish consolidation, but leading lower for most of November.
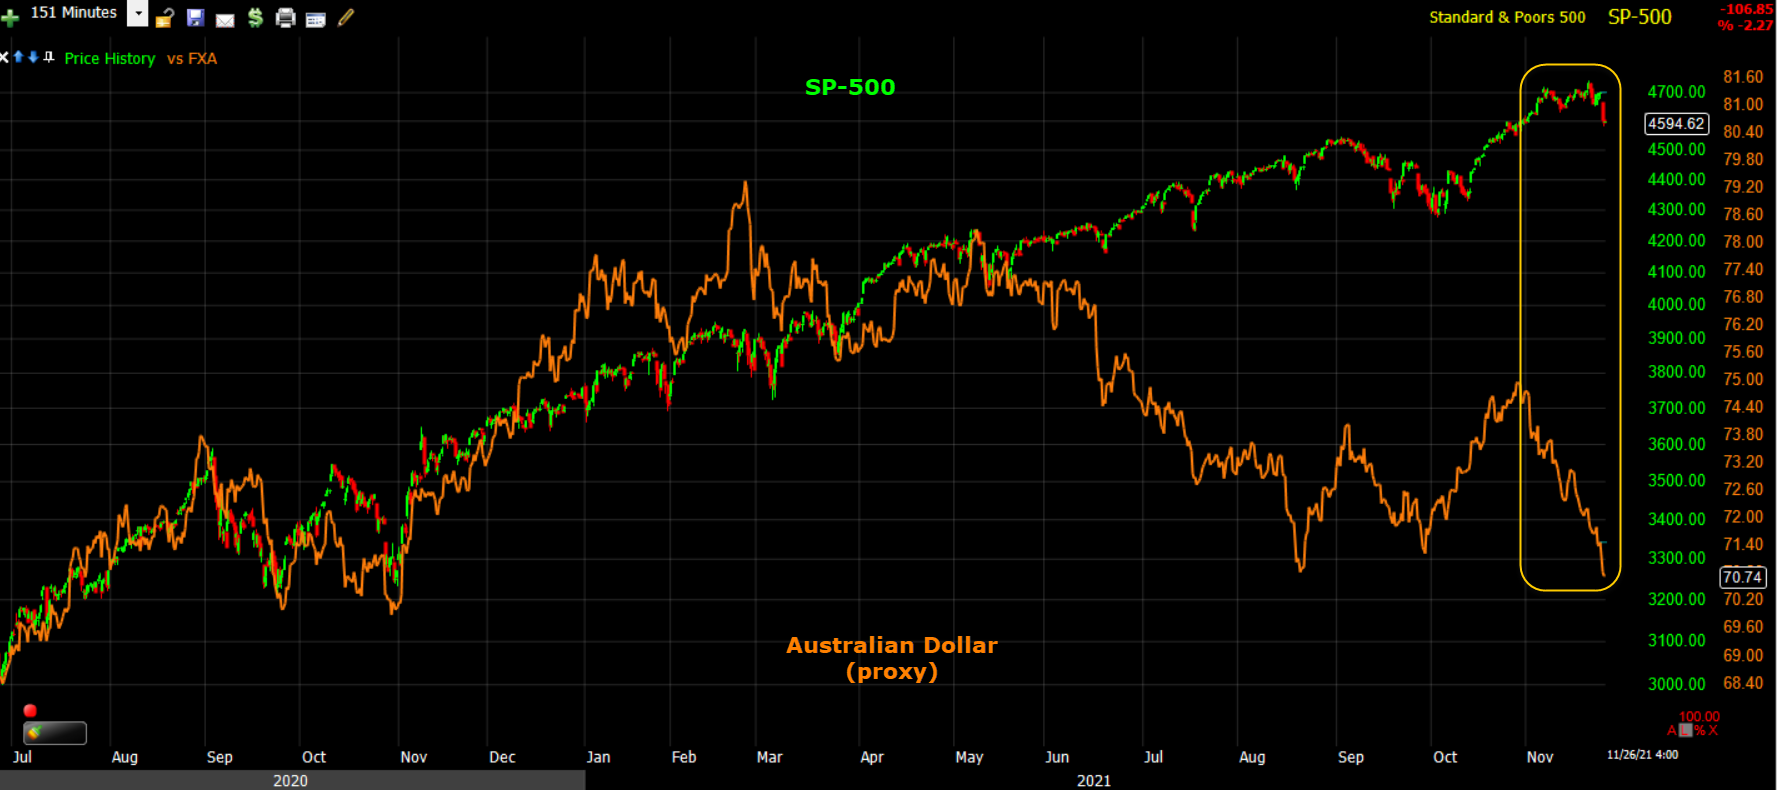
SP-500 (151 min) and Australian Dollar (proxy in orange) not confirming the S&P in November.
As mentioned already, Credit – whether High Yield or my broader custom credit index – has also not only not been confirming the S&P, but leading prices lower.

Sharply deteriorating market breadth has also been a notable standout in recent weeks…
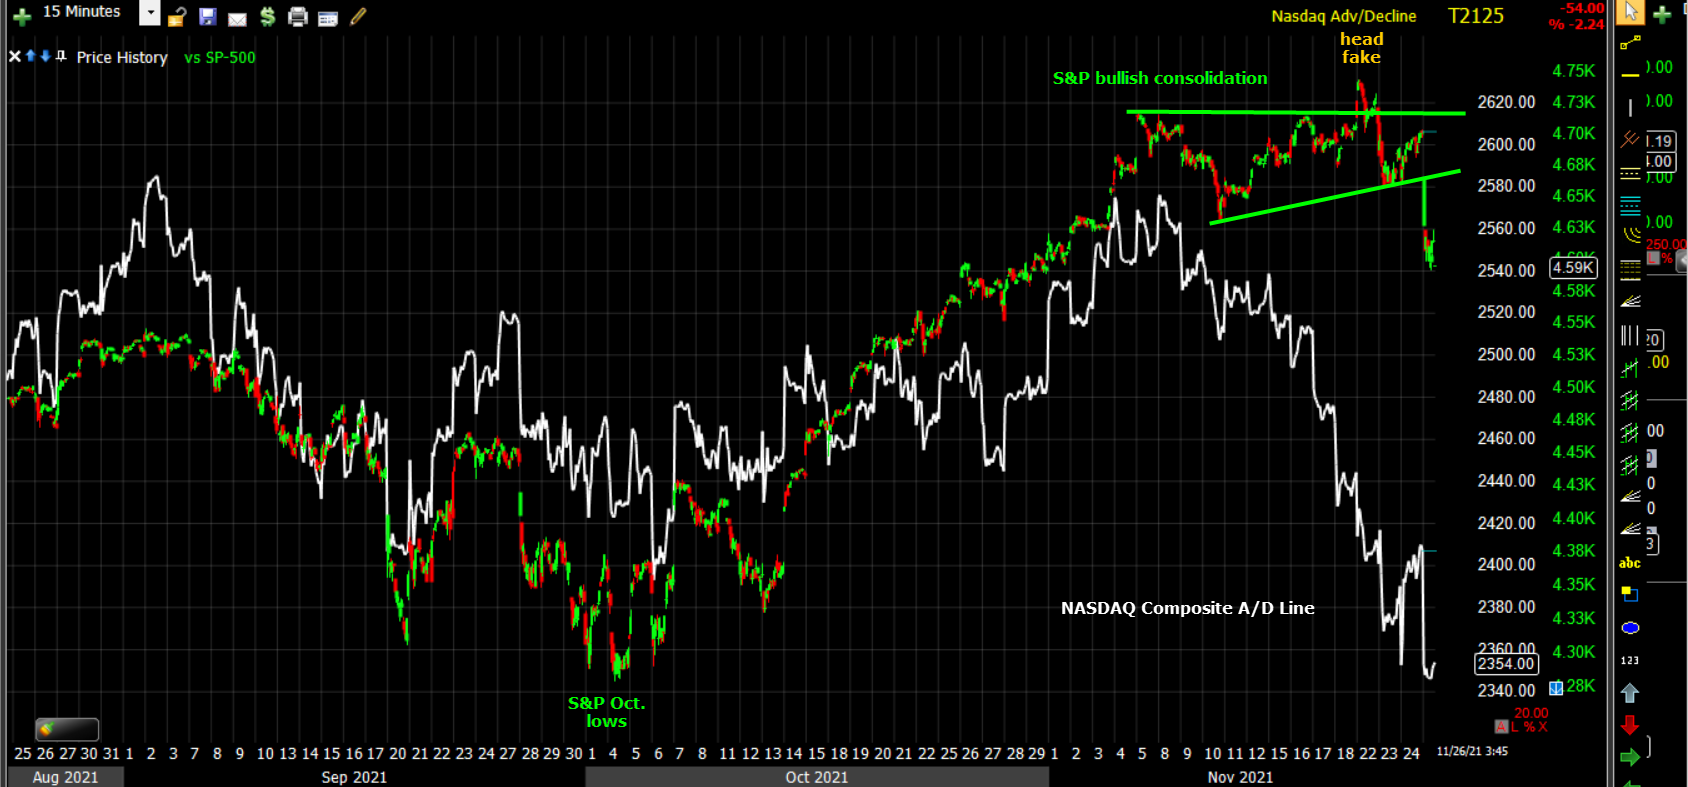
SP-500 (15m) and the broad NASDAQ Composite’s A/D line, which was confirming into early November and the start of the S&P’s consolidation, but has been sharply diverging lower in recent weeks.
For regular subscribers you’ll know about the cornucopia of other breadth indicators that have been deteriorating at an increasingly fast pace in recent weeks.
However, the most surprising and consequential signal appeared just Wednesday before Thanksgiving.
From Wednesday’s Afternoon Update,
“While much hasn’t happened in the dull pre-holiday cash session (U.S. markets closed for Thanksgiving tomorrow and open a half-day Friday), the most notable development is the { subscriber specific content } the signal has preceded market crashes from 1987, including the Russian Financial Crisis, the Dot-Com bubble bear market, the Financial Crisis and most recently the early January 2018 market plunge of nearly 12% with VIX shooting up over 400%. These are rare signals with only a half dozen or so over the last 3 decades. The last one was early January 2018, we haven’t had one since despite very volatile markets including the Q4 2018 market crash and COVID crash.
Honestly from a signal perspective, I would not be forecasting a crash presently, but more and more yellow warnings flags are going up…I wouldn’t consider this { subscriber specific content} a yellow flag, but a serious red flag pointing to something much bigger brewing on a longer term strategic level.”
Here’s the signal mentioned above in Wednesday’s post…

And just one trading day later the S&P see’s the worst Black Friday performance in 80 years.
Historical Examples…
In my research I’ve found this to be an unusually reliable signal. When triggered, which is rare, some type of sharp market correction, crash, bear market or near depression has followed shortly after. Let’s take a look at some of the historical examples…
2018 – This Wednesday’s signal was the first since January 22nd, 2018 (during the late 2017/early 2018 equity market melt-up and crypto craze) and the signal lasted until February 2, 2018. The S&P made a new record high on January 26th, and then the next day started what became an -11.75% drawdown, reaching an intraday low on February 9th.
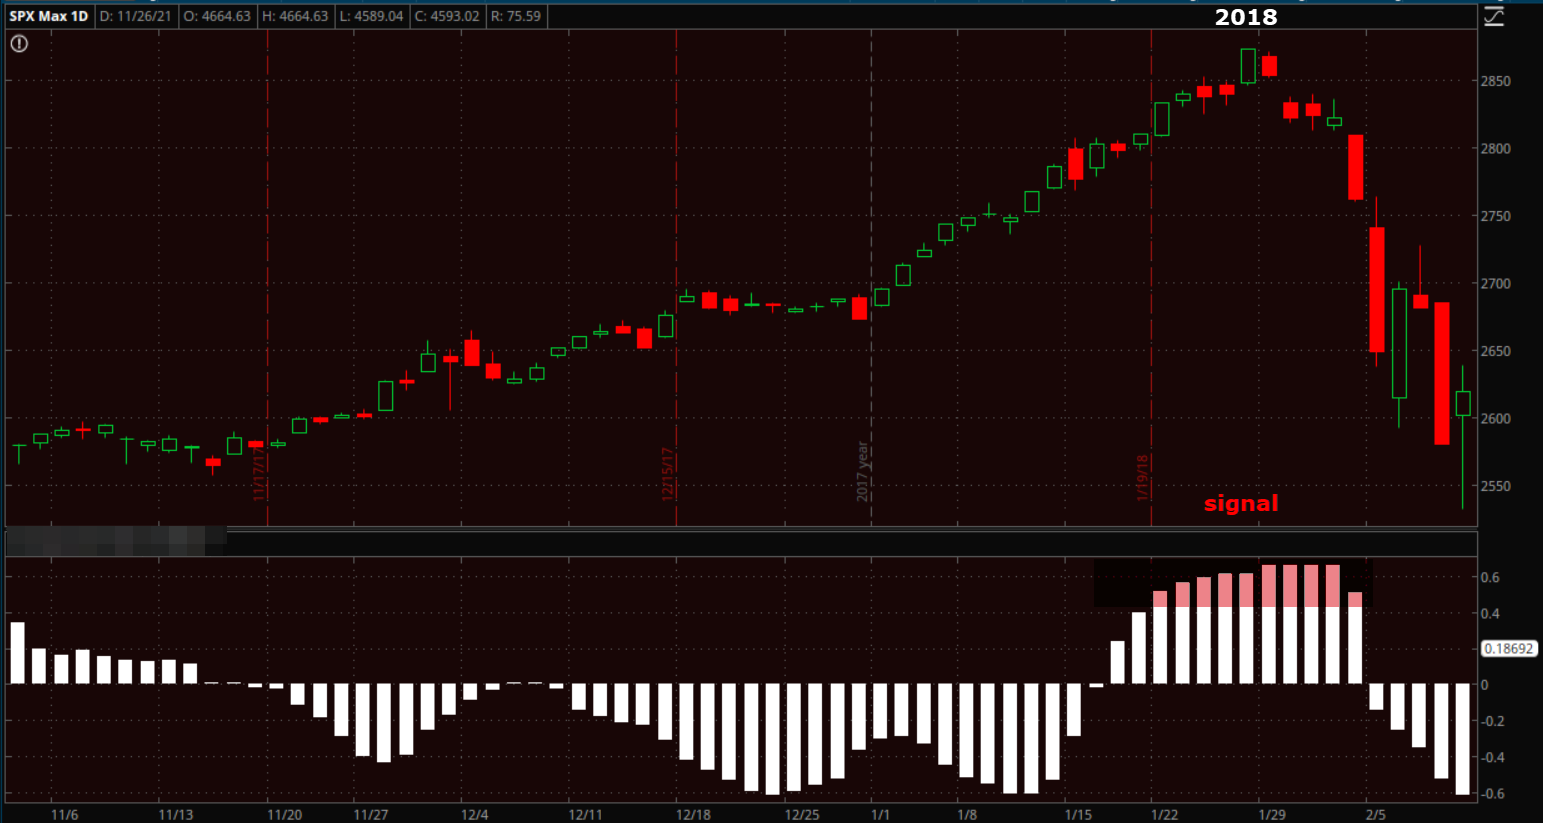 More notable was the VIX’s 360% surge from January 22nd to intraday highs, which caused the XIV (short volatility) ETF to implode sending many volatility short sellers into early retirement. VIX gained +450% from early January lows to the move’s high.
2007 – The next one was all the way back in 2007 preceding the Great Financial Crisis. While the signal appeared for the first time on May 22nd, 2007 – before the Great Financial Crisis and before the S&P’s top in October – by May there was already growing evidence of the Financial Crisis brewing with HSBC announcing losses on U.S. sub-prime mortgages in February 2007, New Century Financial which specialized in subprime mortgages filed for Chapter 11 bankruptcy and cut half of its workforce in April 2007, and by July 2007 Bear Stearns was entangled in subprime and had to be bailed out.
From May 22nd when the signal originated, the S&P fell an eventual -55%. Contrast that to the decline from the S&P’s October 2007 bull market high in which it fell -57%. So while the signal was earlier than the all-time high, there was only 2% difference in the decline from the signal date and all time high. I think most investors would choose to forgo 2% of potential upside to avoid a 55% crash.
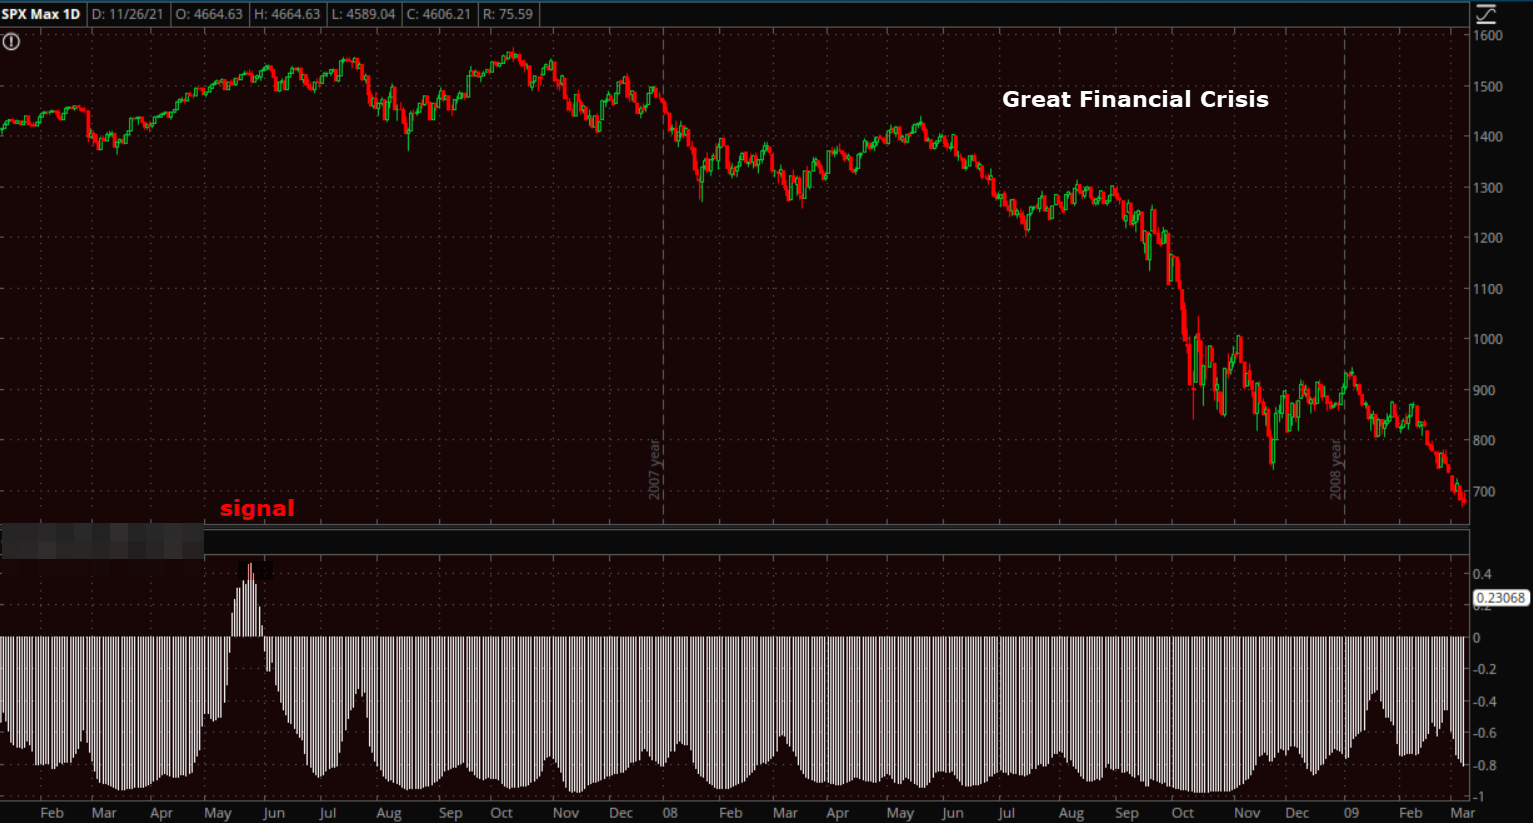 2007-2008 Financial Crisis
2000 – There wasn’t another signal before that until April 11, 2000 (but for the NASDAQ-100 it was earlier at November 26, 1999), which is around the top of the Dot.Com bubble.
 SP-500 (daily rolled back to 2000) the signal came around the start of the Dot.com bust & bear market to follow. The S&P topped on March 24th, 2000. From the time of my signal, the S&P lost -48% with a bear market stretching until October of 2002.
As mentioned above my NASDAQ version of this signal was earlier on November 26, 1999 to January 18th, 2000.
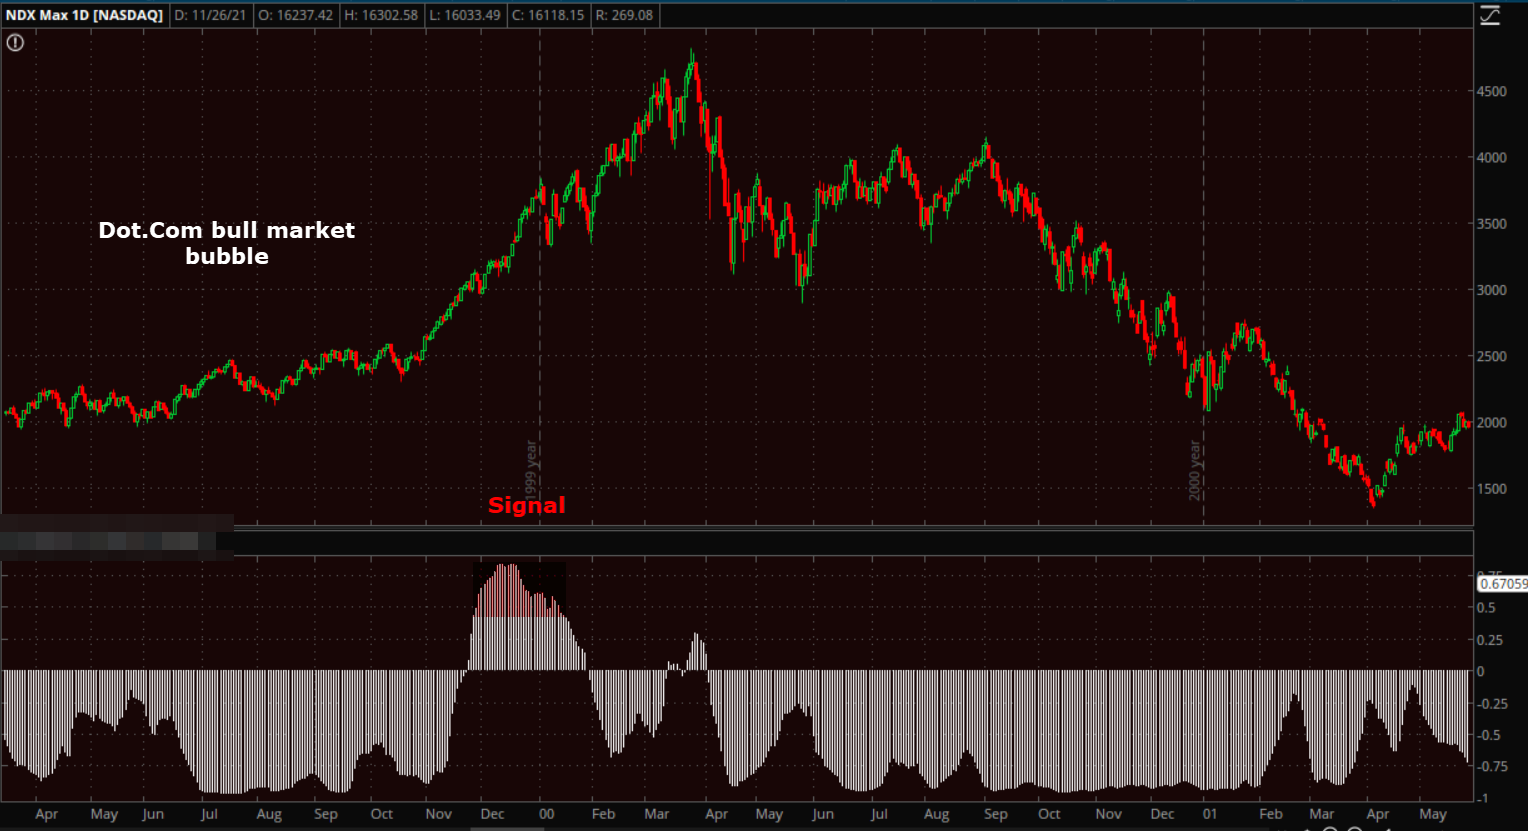 NASDAQ-100 signal from the top of the Dot.com bubble with the index topping March 27th 2000.
From the start of the signal on November 26, 1999 the NASDAQ-100 lost -63.8%. From the last day of the signal on January 18, 2000, the NASDAQ-100 lost -70% to the bear market bottom. From the exact bull market closing high to the closing bear market low, the NASDAQ-100 lost -76%.
1987- There were other signals that included the Russian Financial Crisis, but one that stands out is just before the 1987 market crash. The signal started August 14, 1987 (the S&P’s high was August 25th) and the signal ran until September 8th, 1987.
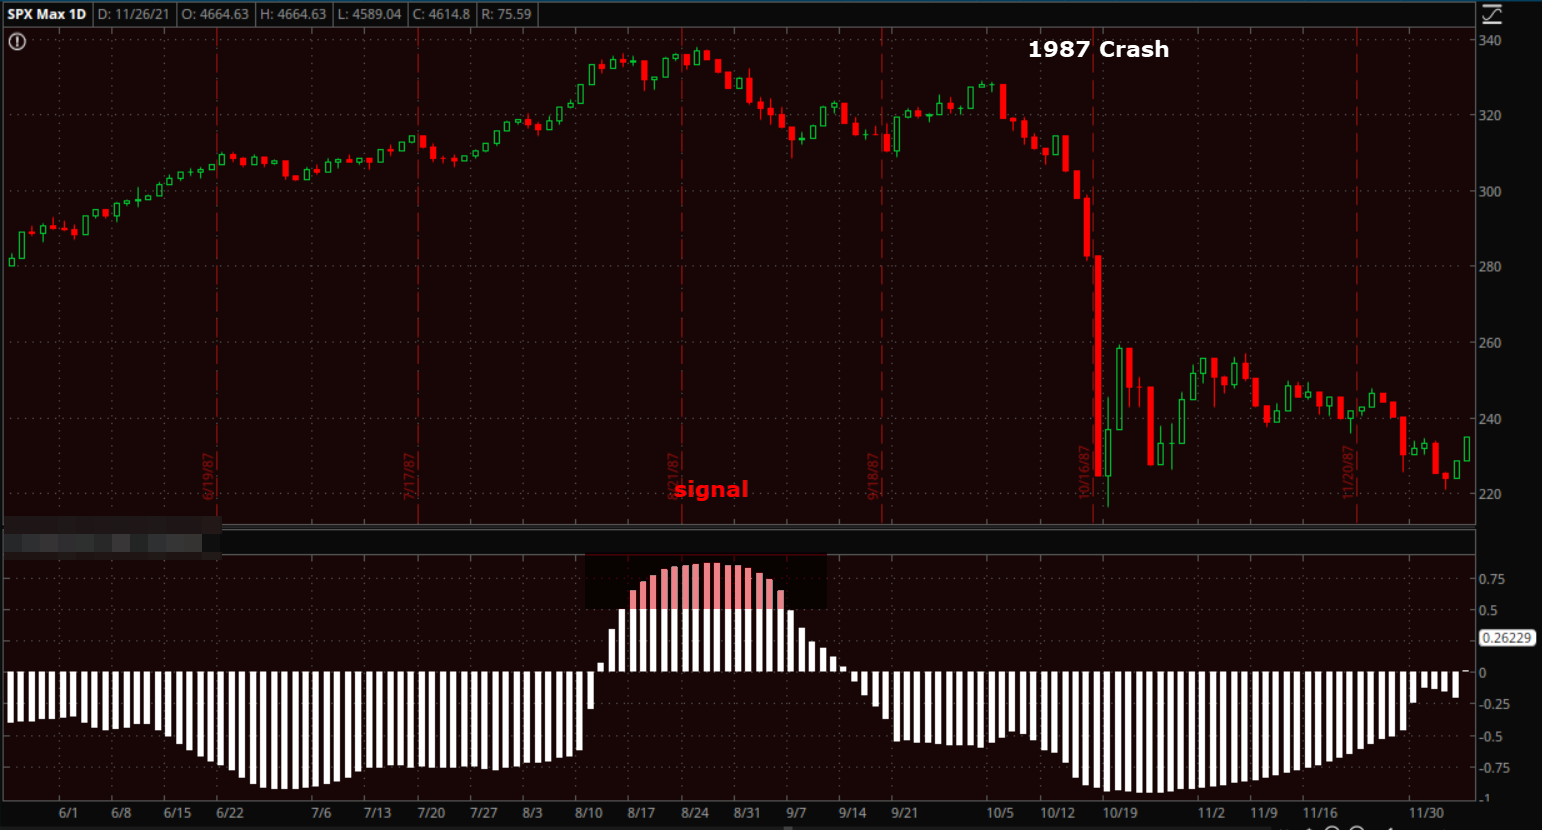 My signal in red and the 1987 market crash following shortly after.
From the start of the signal on August 14th to the S&P’s December 4th closing low the S&P lost -33%, compared to -33.5% from the S&P’s August 25th market high. In other words, between the start of the signal and the S&P’s eventual high, the market only fell about a half percent more than from the start of the signal.
The Dow fell -35.2% from the start of the signal in August to the October 19th closing low (intraday low was even worse). That compares favorably to a loss of -36% from the all-time high on August 25th to the closing low on October 19th.
In other words, when this signal appears, sometimes we have sharp drops almost immediately. Sometimes it’s a number of months, but the difference in market losses between the start of the signal, and the cycle high is negligible. I’m quite sure most investors would have chosen to sell the Dow on August 14th and avoid a 35% crash, than to miss out on an additional +1.4% of potential upside.
This is a rare but extremely impressive market signal preceding major market drawdowns, crashes and bear markets.
The Takeaway…
It’s ironic that from Monday to Wednesday the most notable theme I picked up on this week was how much more hawkishly the market shifted since Powell’s renomination by President Biden at the start of the week. It was strange because the market expected Powell to win the nomination and he was a known quantity. Still the market shifted notably more hawkish, moving up rate hikes.
For subscribers, we’ve seen a slow but steady trail of yellow flags, not red flags, but more and more yellow flags. After weeks of watching the components of one particular signal move in the right (or wrong) direction, Wednesday we got that signal that has been highly accurate in predicting market crashes, and one I’d most certainly call a red flag. However, at the time on Wednesday I didn’t see anything at the macro level that was pointing to an imminent crash. Suddenly today the market puts in a very ugly performance literally the very next trading day, and we have a crystal clear catalyst starting us in the face. It really makes you wonder just how smart smart money is, what they knew, when they knew it and how they knew it. This signal takes far more than 5 days to develop.
I’m always keen to point out that one day is not a trend, We’ve seen many 1-day events come and go and end up being completely inconsequential for the market. That said, if you’ll indulge me for just a moment, I’ll lay some out some potential scenarios.
If indeed the Omicron variant is all that is feared, or big pharma and their media minions manage to convince the market that it is all that’s feared, that will pause and push back the Fed’s recent tightening schedule. It will take time to come up with, distribute and administer effective COVID vaccines (if there indeed is such a thing). It’s looking like it could be February or March before there’s a reasonable level of what would be considered herd immunity with a new vaccine/booster. With more and more nations likely to restrict travel and/or lockdown in coming days and weeks, the immediate threat is not inflation, but deflation or recession into the end of the year and perhaps early 2022. For that reason the Fed will want to put their tapering of asset purchases (tightening of policy) on hold. However, unlike just about every other deflationary event in the last 20 years, the Fed probably won’t be able to ease (print as much money as they want and throw it into the markets) because there are still very real and broadening inflationary pressures.
The 12 basis point plunge in the Fed-sensitive 2-year yield and the -0.75% loss in the U.S. Dollar today are the market speaking to the probability the Fed has to back off tightening. Further corroborating this reaction, rate-hike expectations were dialed back today. According to the CME FedWatch Tool, the probability for a rate hike in May 2022 decreased to 36.4% from 55.3% on Wednesday, and the probability for a rate hike in June 2022 decreased to 61.8% from 82.1% on Wednesday.
As we have watched inflation accelerate and broaden, I’ve been saying for months that the Fed is finally boxed in and doesn’t have the free-hand they’ve had for decades to print their way out of any blip in equities. If you are vaguely familiar with Modern Monetary Theory (MMT) you know that the principle is that if a nation issues its own currency, it can simply print whatever it wants for whatever reasons it wants. It truly is that frighteningly simple. According to MMT proponents, the only constraint to unlimited printing is inflation.
How is MMT any different than what the Fed has been doing for decades? In August I pointed out that from the March 2020 COVID S&P-500 low, to the S&P’s record highs in August, the S&P gained exactly 100%. Over the exact same period the Fed’s balance sheet doubled from $4.1 trillion to $8.2 trillion. Coincidence?
The point is, the Fed likely can’t do much easing this time to soften the growth slowdown or recession, being constrained by…. INFLATION. That’s a problem for equities that are trading by many measures at all time high valuations, bolstered by the Fed’s printing press.
There’s an argument to be made too that the “Vaccine premium” in the market, may have to be discounted since early information looks like current vaccines may not be of much use and it could be March before there’s a notable improvement in that situation.
That means governments will be forced to provide fiscal stimulus and business support to COVID affected industries. The Biden administration’s political capital may be used up in response, making the already anemic infrastructure bill unlikely.
If recent history is an example and there is a consequential surge in COVID cases (or just how countries react), we should expect more supply disruptions, which will mean we are likely to have another burst of inflation next year as economies reopen which will be magnified by governments’ fiscal stimulus. That’s why central banks like the Fed (not the Turkish Central Bank apparently) will find it incredibly difficult, if not impossible, to ease. The market will have to deal with reality without the Fed blowing shiny bubbles for once… for the first time in most investors’ experience.
If the early market fears prove to be reasonably correct, and Omicron spreads more quickly and is resistant to vaccines, then Q4 2021 into early Q1 2022 are setting up to be deflationary events, potentially even recessionary. As economies reopen, inflationary pressures are renewed and bolstered by further fractured supply chains and central banks are back to tightening. Judging by the near crash in the 5s-30s yield curve well before today, market participants have very little faith in the Fed’s ability to navigate the inflationary spiral without making a serious policy error. And now we potentially have a super-variant to deal with which should give investors even more cause for concern that the Fed makes a serious policy error.
We’ll see if there are legs to some of these thoughts next week, but Wednesday’s signal is there no matter what. It took weeks to develop and it has a frightening track record. Have a great weekend.