Stock Market Analysis – FOMC On Deck
A continued decline in the price of crude oil and a decline in treasury yields was just what the market needed to rebound today. The decline in yields (mentioned as a possibility in the overnight section of last night’s Daily Wrap) was exactly what the growth stocks of the NASDAQ-100 needed to finally establish some much needed leadership, gaining over 3% intraday after being down almost 1 % in the pre-market.
After yesterday’s market sell-off, almost entirely caused by a huge surge in bond yields shocking stock valuations, I wrote in last night’s Daily Wrap (in the Treasury section)….
“On a side note and as a point of interest, in the Afternoon Update today I wrote,
“The question is whether yields continue to soar into the FOMC. At the moment treasury futures are near session lows and 3C is in line, but we’ve seen some swings on the charts after the cash close into the overnight sesion, but at this moment there’s no letting up of the sel-side pressure in treasuries.”
There may be some changes taking place in treasury futures tonight that I’ll post charts of in the overnight section below.”
And then with 3C charts of 2-year, 5-year and 10-year Treasury futures in the Overnight section….
“One potential area of interest that could shift tone for equities is Treasury futures. At the Afternoon Update I didn’t see anything on 3C charts to suggest that yields would do anything but continue running higher. However, as mentioned in the Afternoon Update, I most often see changes in tone after the cash close and there are a few developing tonight at the short end to the belly (but not the long end) of the curve.
All have positive 3C divergences. At this point I’m not reading too much into it other than a change in character. It may very well just be a consolidation /correction phase after Treasuries’ sharp losses today, but it may also be the start of some short covering/buying that halts the surge in yields or even leads to yields pulling back. Considering that the rise in yields was the biggest reason for stocks’ weakness today, it’s worth keeping an eye on and we’ll take another look in the morning.”
Indeed, Treasuries traded lower after the Daily Wrap last night, but then 3C continued to positively diverge and Treasuries rebounded sending yields lower and giving the mega-cap and growth stocks an opportunity to rally, which lifted NASDAQ-100 to the day’s best performing index.
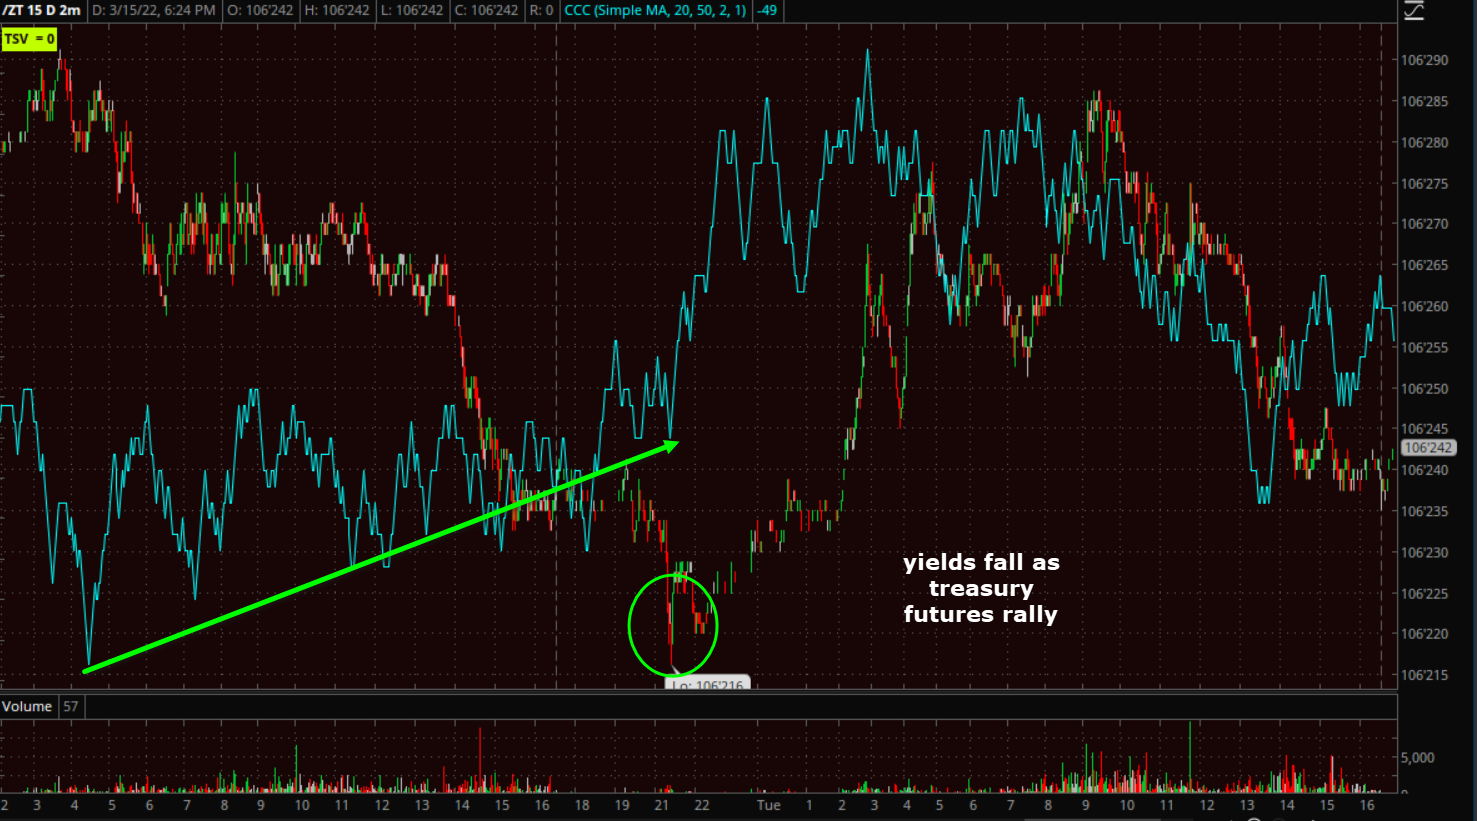 2-year Treasury futures (2m) with the positive divergence I mentioned last night in green, leading to an upside reversal sending yields lower (yields and treasury prices have an inverse relationship). As of this morning’s pre-market A.M. Update, the 2-year yield was down 4 basis points after rising 9 basis points yesterday. However, as the afternoon wore on Treasury futures dipped sending yields back toward unchanged.
Rather than just talk about technical indicators and moving averages, I try hard to inform you of what exactly is moving the market (which is always dynamic) so you can understand and apply the concepts for yourself. And I look at other asset classes that may seem unrelated, but in fact are the primary driving force, such as treasury futures lately, and let you know when I see a change in character that could give you an edge ahead of time. If you know what Treasuries are likely to do, you can use that information to enter, exit or manage trades in stocks – in this case primarily the large-cap Tech stocks of the NASDAQ-100. So with that in mind, here’s a chart that illustrates just how much yields affected the growth and mega-cap stocks of the NASDAQ-100…
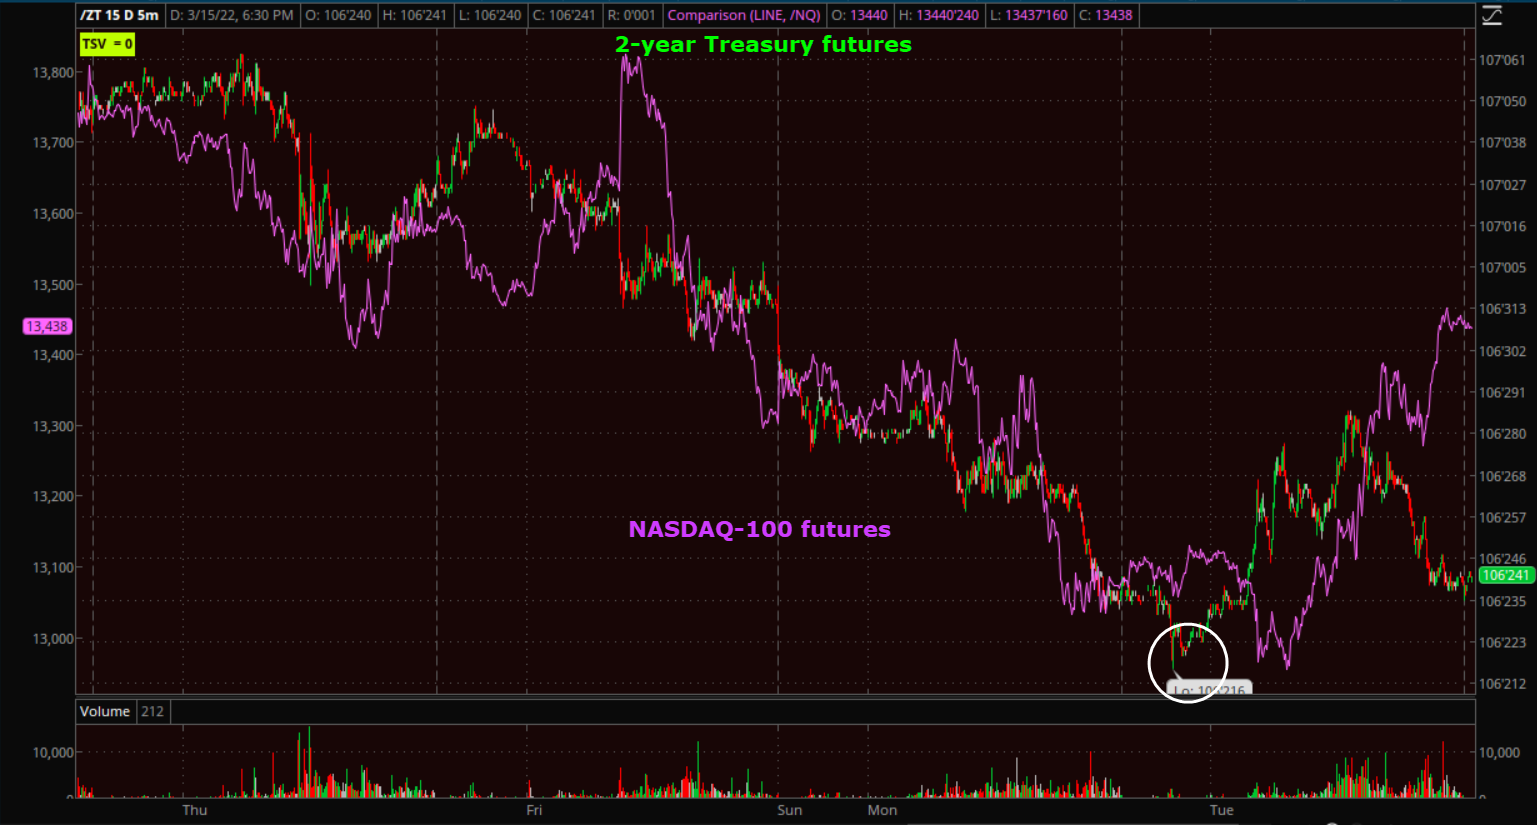 2-year Treasury futures (5m) in red/green candlesticks and NASDAQ-100 futures in purple. The key pivot in Treasury futures reversing to the upside last night (white circle) was hinted at, if not forecast by 3C last night hours ahead of time. As such, NASDAQ-100 which has been very sensitive to yields due to large-cap Tech’s forward valuations has a strong positive correlation with Treasuries. The 2-year treasury made an overnight low and turned up first (white circle) and that gave the large-cap Tech stocks of the NASDAQ-100 an opportunity to rally, which they did shortly after.
Producer Price Index (PPI) data this morning was better than feared, which helped keep yields from surging this morning and gave the averages a chance to rally. Still, the Producer Price Index for final demand was up 10.0% year-over-year — softening the surprise that it was up 0.8% month-over-month, versus the consensus of 1.0%.
On Russia-Ukraine, the headlines didn’t seem to get worse except that Russia’s Putin told European Council President Charles Michel that Ukraine “is not showing a serious attitude toward finding mutually acceptable solutions” in talks with Moscow on ending the fighting. The market handled this well and it simply led to an intraday consolidation that broke out in the afternoon.

SP-500 (1m) intraday with a bullish consolidation and breakout higher.
 NASDAQ-100 (1m) with another bullish consolidation.
On a related note, Ukraine President Zelensky will address the U.S. Congress tomorrow at 9:00 a.m. ET, and President Biden will travel to Europe next week to attend a NATO summit on March 24.
Averages
NASDAQ-100 got hit the hardest yesterday on the sharp rise in yields, and gained the most today as yields moderated. Small Caps performed well on the day, but were the laggard. Dow Transports (+2.55%) outperformed Industrials which is a short term positive signal.
S&P-500 ⇧ 2.14 %
NASDAQ ⇧ 3.16 %
DOW JONES ⇧ 1.82 %
RUSSELL 2000 ⇧ 1.40 %
The averages had a strong close at or near session highs, but there are zones of resistance nearby.
 SP-500 (daily) back above $4200, but with likely resistance at $4300 from last week’s range-bound trade. The intraday bullish consolidation suggests that S&P could trade up to $4300 (resistance).
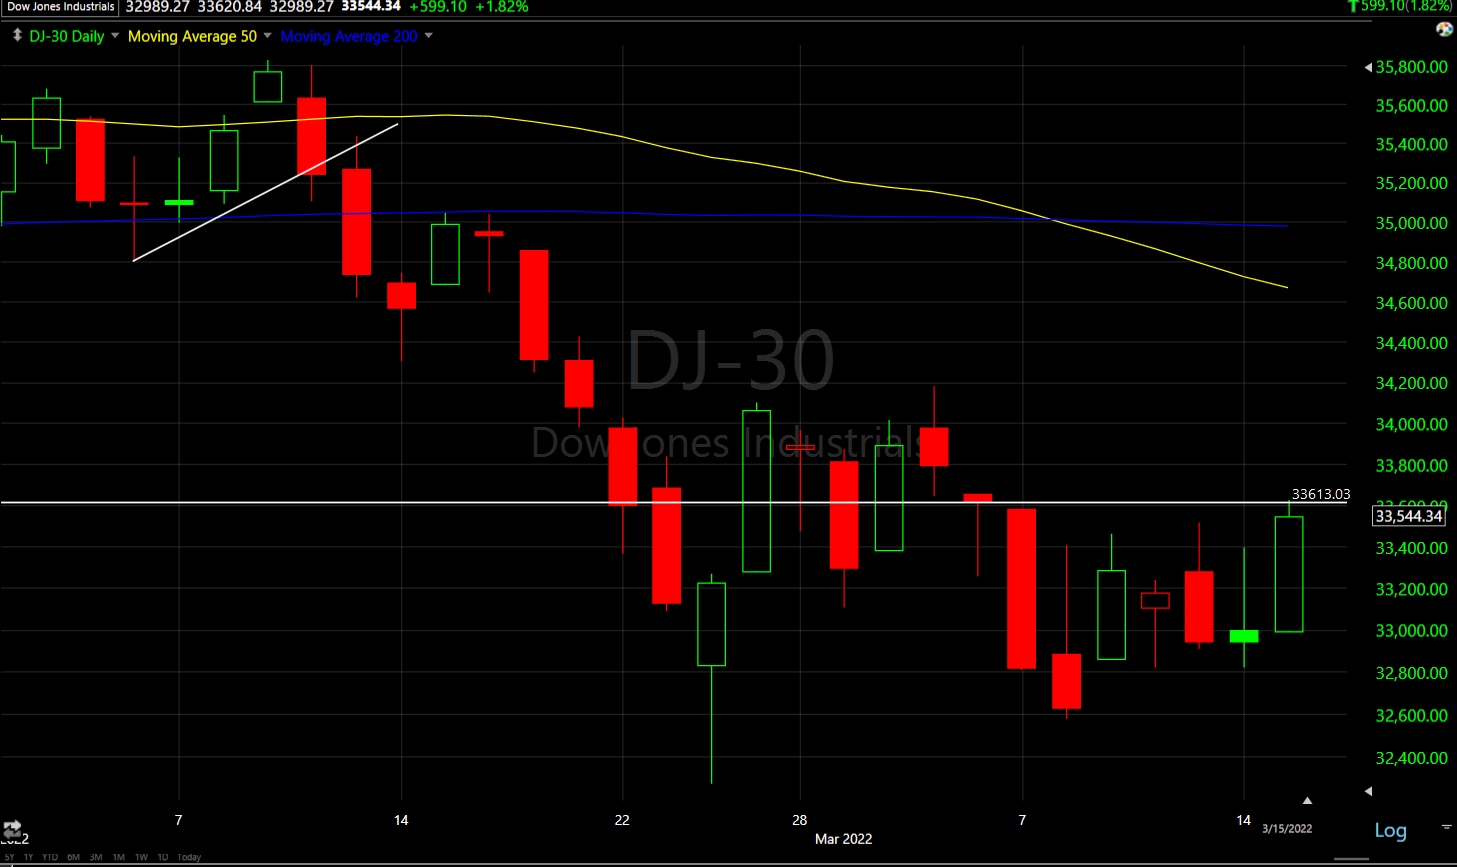 Dow (daily) had a strong day and close – it’s also had one of the best looking short term 3C charts from last week, but seemed to meet some resistance at the trend line (September low). The Dow’s measured move from the intraday consolidation suggests a near term target around $33,900.
 NASDAQ-100 (daily) rebounded from th February low after briefly trading below yesterday. From the intraday consolidation, I get a measured move up to $13,650.
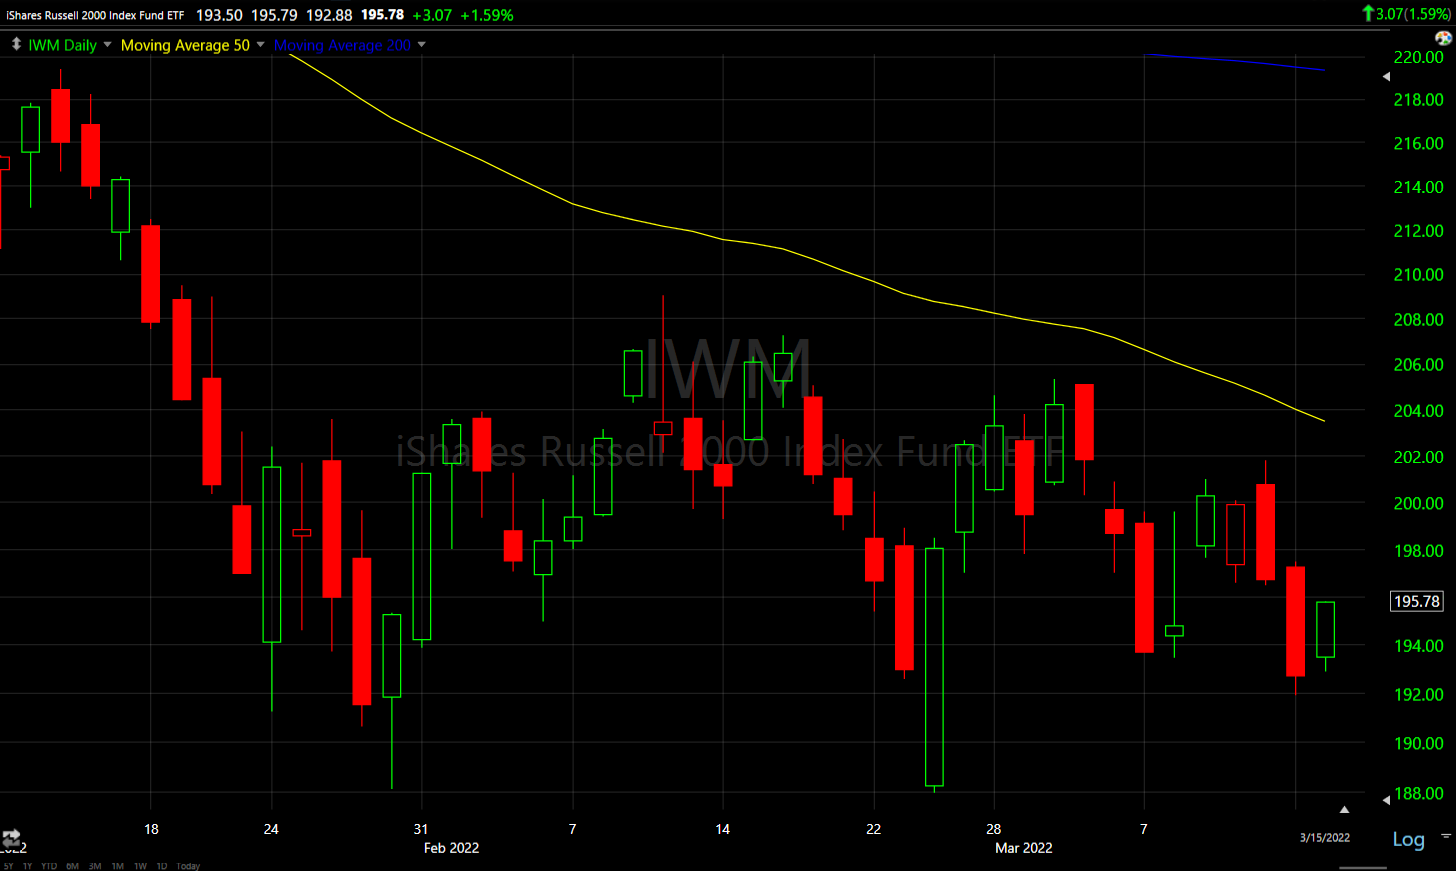 Small Cap IWM (daily) was the laggard, but posted a close at sesion highs and an inside day (often a bullish reversal candle). IWM’s measured move is more conservative coming in around $197.25.
NASDAQ’s China-centric Golden Dragon Index dead-cat bounced (+4.9%) after falling -11.85% yesterday and down -75% from all time highs as China locks down Shenzhen due a spike in COVID cases.
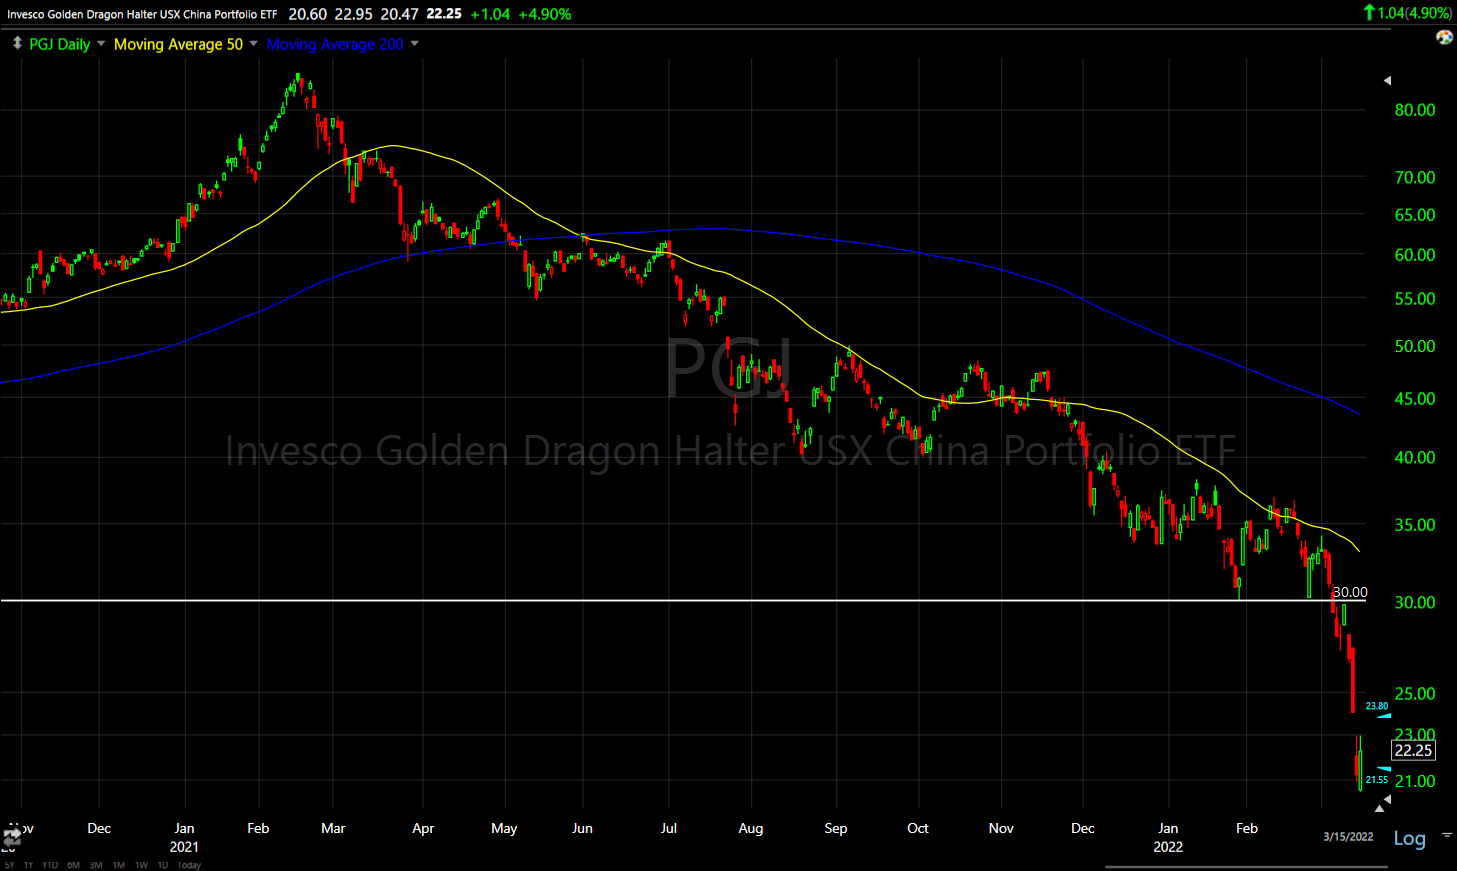 Golden Dragon (daily) I haven’t put a lot of focus on China, but if the index fills the gap from yesterday and rallies up toward the trend line at $30 – which seems to be a major topping pattern’s neckline stretching back to 2017, I’d pay more attention and look for the potential of a short trade since the overhead resistance above $30 is so substantial.
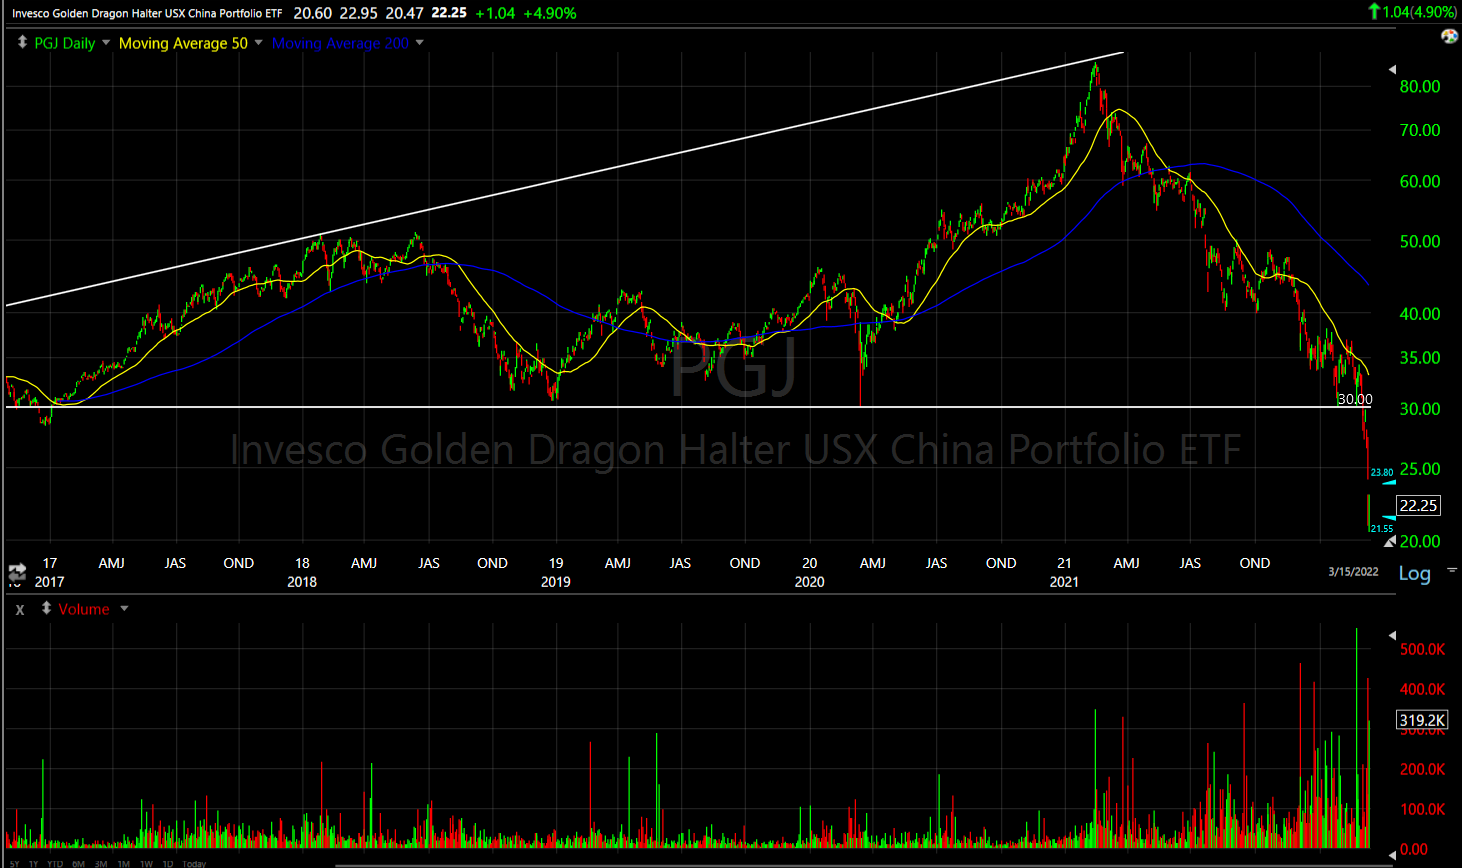 Golden Dragon Index (daily) – this is a massive right-angle broadening top. Note the heavy volume down to and at the break of the trend line. I suspect by the time price reached the trend line, the descending yellow 50-day moving average would be in the same area, which has been pretty consistent resistance of its own, making the short trade on that kind of bounce even more enticing.
This will likely have a lot to do with the status of COVID infections in China, lockdowns and the government’s monetary response, but it’s worth mentioning and keeping on your radar as you don’t see many short set-ups that look this intriguing – should we get enough strength to sell into to make the trade worthwhile with better profit potential and lowering the risk (width of stop-loss).
The short squeeze in VXX, after an unusual announcement from Barclay’s yesterday that they’d suspend sales of equity and oil volatility ETN’s, continued today with VXX (-0.38%) trading up as much as +42%, even as the VIX index (-6.1%) was red. VXX completely decoupled with VIX and the benchmark S&P index as hedge funds scramble to cover their volatility shorts.
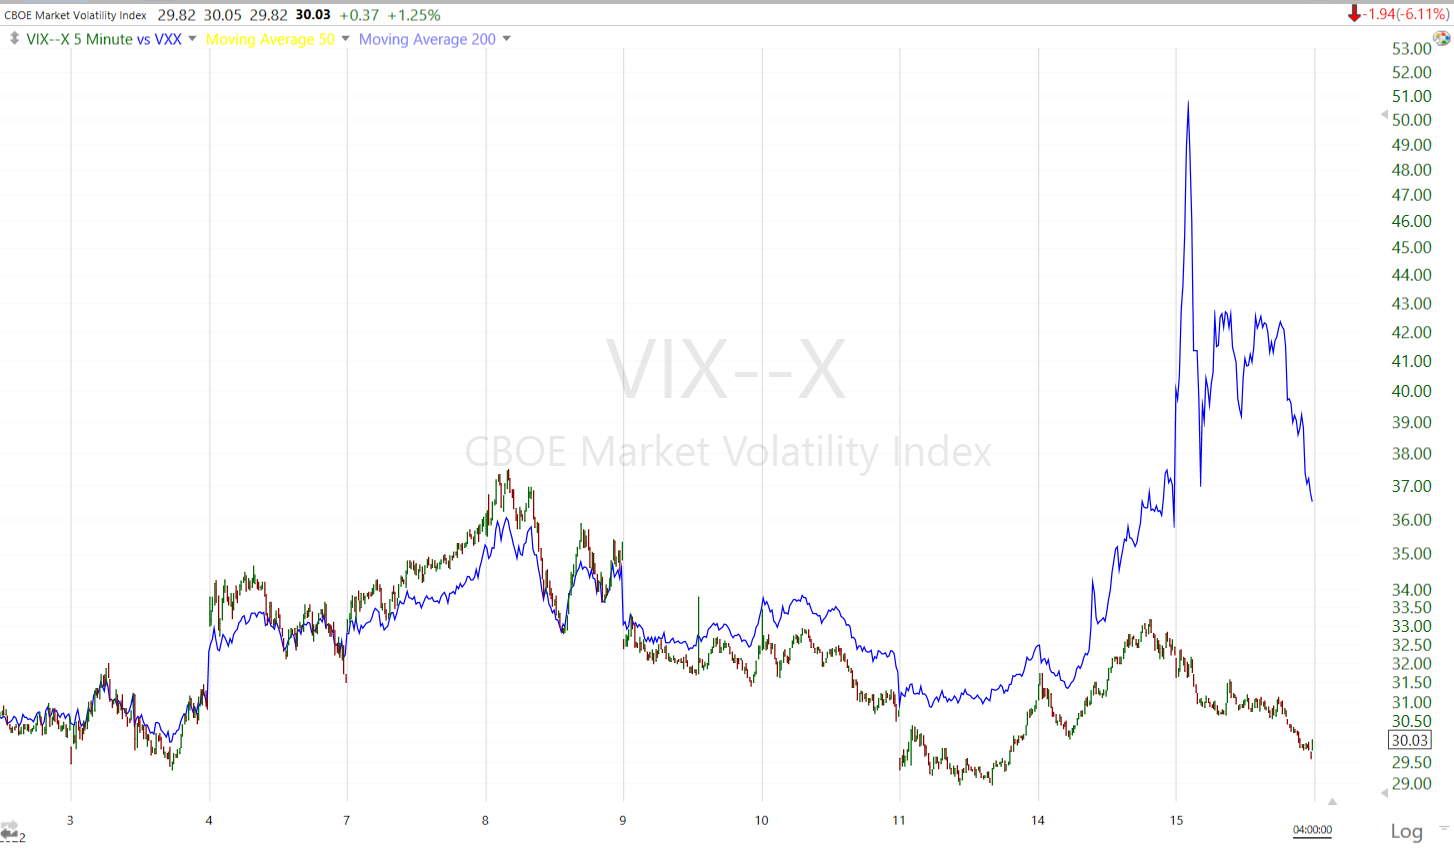 VIX (5m) and VXX (blue) completely decoupling today.
Volatility’s Term structure continues to normalize after an unusually long period of backwardation.
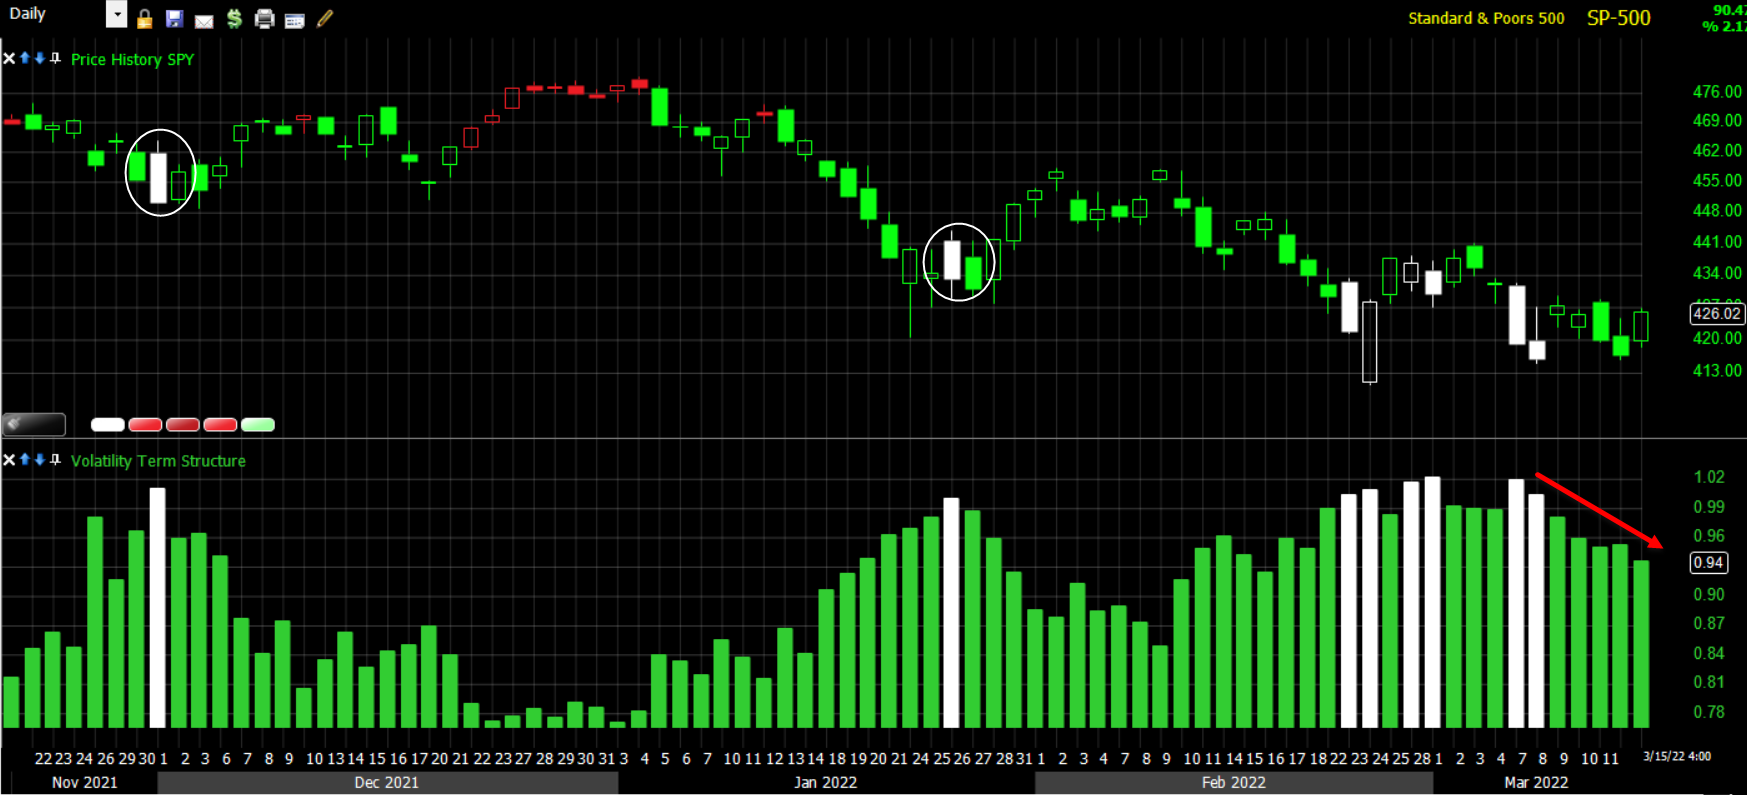 SP-500 (daily) and volatility’s term structure. There’s no hard and fast rules in the market, but 4 out of 5 times when term structure moved to backwardation (white) it marks an extreme in sentiment and usually a market low, unless the market is in the middle of a clear crash like Q1 of 2020 on the COVID lockdowns in the U.S.
And VIX’s trend of relative weakness that became more apparent in the second half of last week is telling on its own.
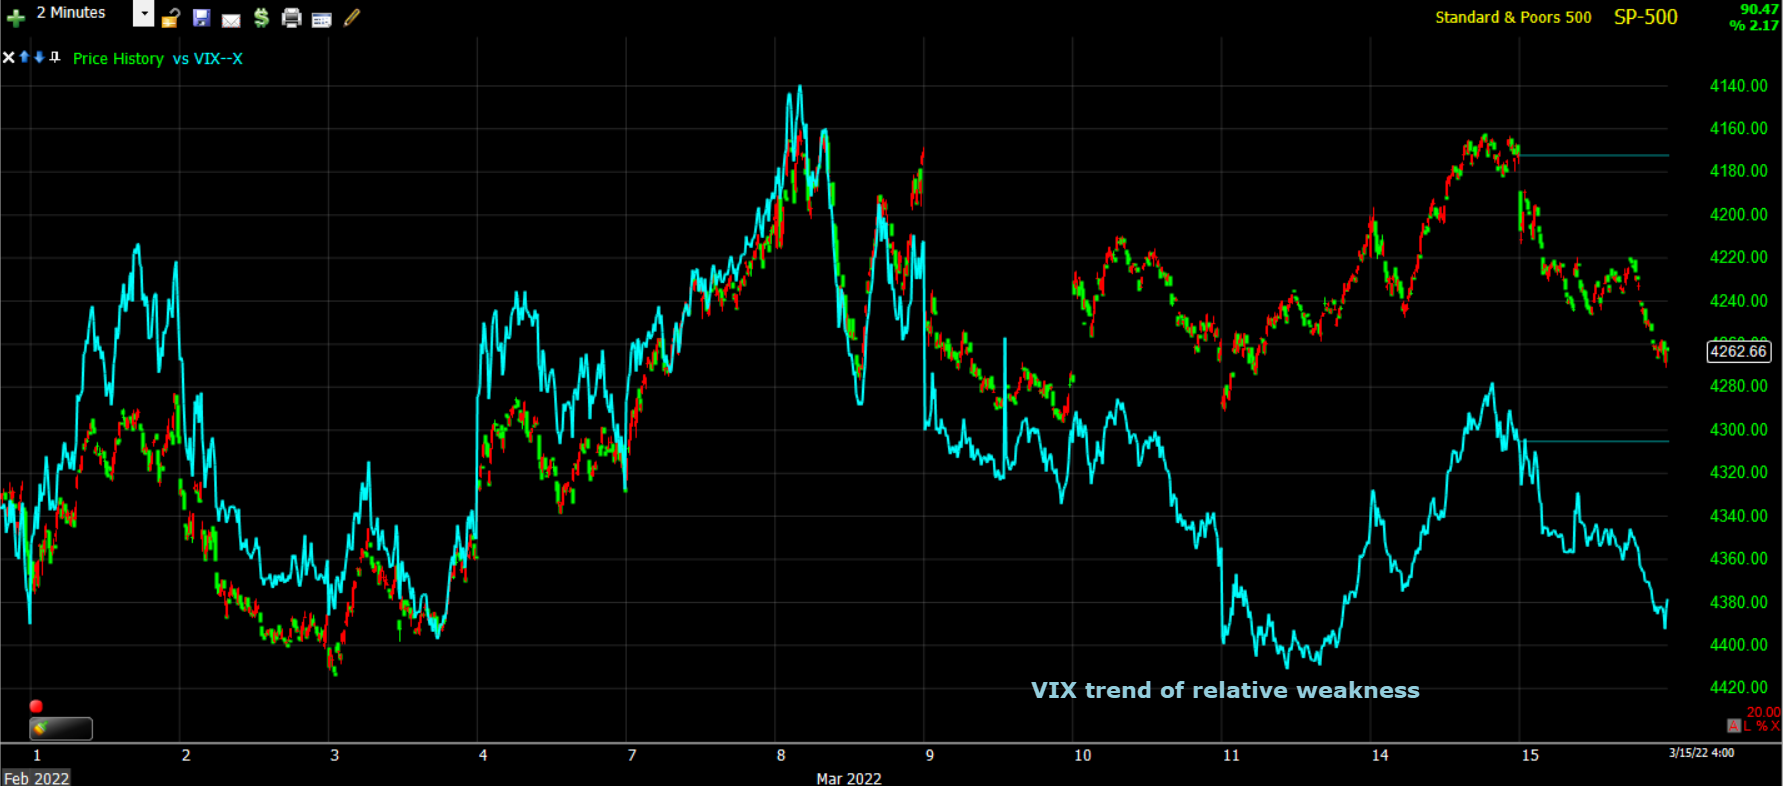 SP-500 (2m) inverted for context and VIX (blue) with notable relative weakness as traders are clearly unwinding geopolitical hedges – the same panicked response that drove volatility’s term structure into backwardation for an unusual amount of time.
For those who are interested, the Absolute Breadth Index moved down into the 15’s today. The key level, according to years of my experience, is a print below 14, which is an extremely high probability signal that the VIX index will surge over the next month, sometimes starting as quickly as the next day. The lower ABI moves below 14, the higher the probabilities of a surge in volatility, and typically the bigger the percentage gain in VIX.
S&P sectors
Stocks that have been the hardest this year saw the biggest gains today, particularly the large growth stocks within the mega-cap heavy Technology and Consumer Discretionary sectors. The Energy sector was the only sector that closed lower, losing 3.7% amid the drop in oil prices.
Materials ⇧ 1.15 %
Energy ⇩ -3.66 %
Financials ⇧ 1.41 %
Industrial ⇧ 1.59 %
Technology ⇧ 3.36 %
Consumer Staples ⇧ 2.24 %
Utilities ⇧ 1.28 %
Health Care ⇧ 1.99 %
Consumer Discretionary ⇧ 3.35 %
Real Estate ⇧ 0.79 %
Communications ⇧ 1.92 %
The growth style factor (+3.1%) doubled the performance of the value style factor (+1.25%) due to the decline in treasury yields.
Some areas of relative strength included airlines (JETS ETF +5.85%) as the stocks rallied around higher Q1 revenue guidance from Delta (DAL +8.7%), United (UAL +9.2%), and Southwest (LUV +4.9%).
Semiconductors (SOX +4.4%) outperformed the Tech sector and as mentioned above, Dow Transports outperformed Dow Industrials.
Internals
NYSE Advancers are 2-to-1 over Decliners on volume of 1.2 bln. shares.
The Dominant price/volume relationship is mixed and not extremely dominant – Close Up/Volume Up for the Dow -this is the strongest, most bullish relationship; NASDAQ-100 was nearly evenly split between Close Up/Volume Up and Close Up/Volume Down (the latter being the most suspect relationship); and Close Up/volume Down for the S&P-50 component stocks this is the weakest, most suspect p/v relationship. The net effect is that the lack of a dominant p/v relationship rules out a 1-day overbought condition.
Treasuries
Treasury yields dipped in the wake of the PPI data, but they turned positive late in the session as stocks pushed towards session highs. There wasn’t any specific catalyst behind the moves, leading some to speculate that the stock market might have been frontrunning a positive reaction to the FOMC decision tomorrow.
The 2-year yield increased two basis points to 1.86% after touching 1.79% intraday, and the 10-year yield increased two basis points to 2.16% after touching 2.08% intraday.
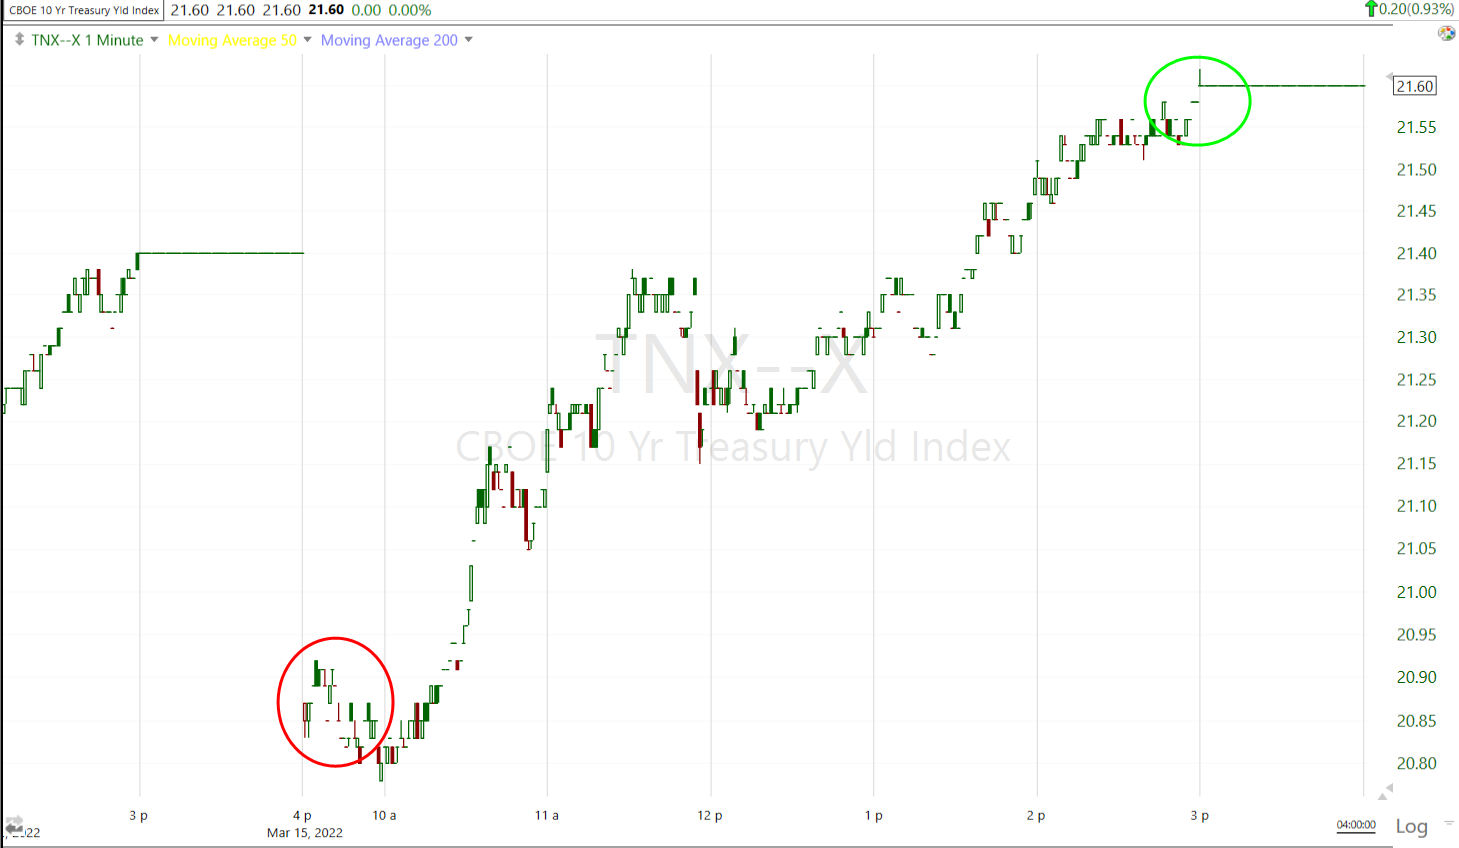 10-year yield (1m) at the cash market open was 6 basis points lower, which was exactly what the market needed to rally, but traded higher from there. Although the 10-year ended 2 bp higher on the day, it was not the 14 basis point surge from yesterday – it’s the rapid, sharp rate of change that hits stock valuations most acutely as we saw yesterday.
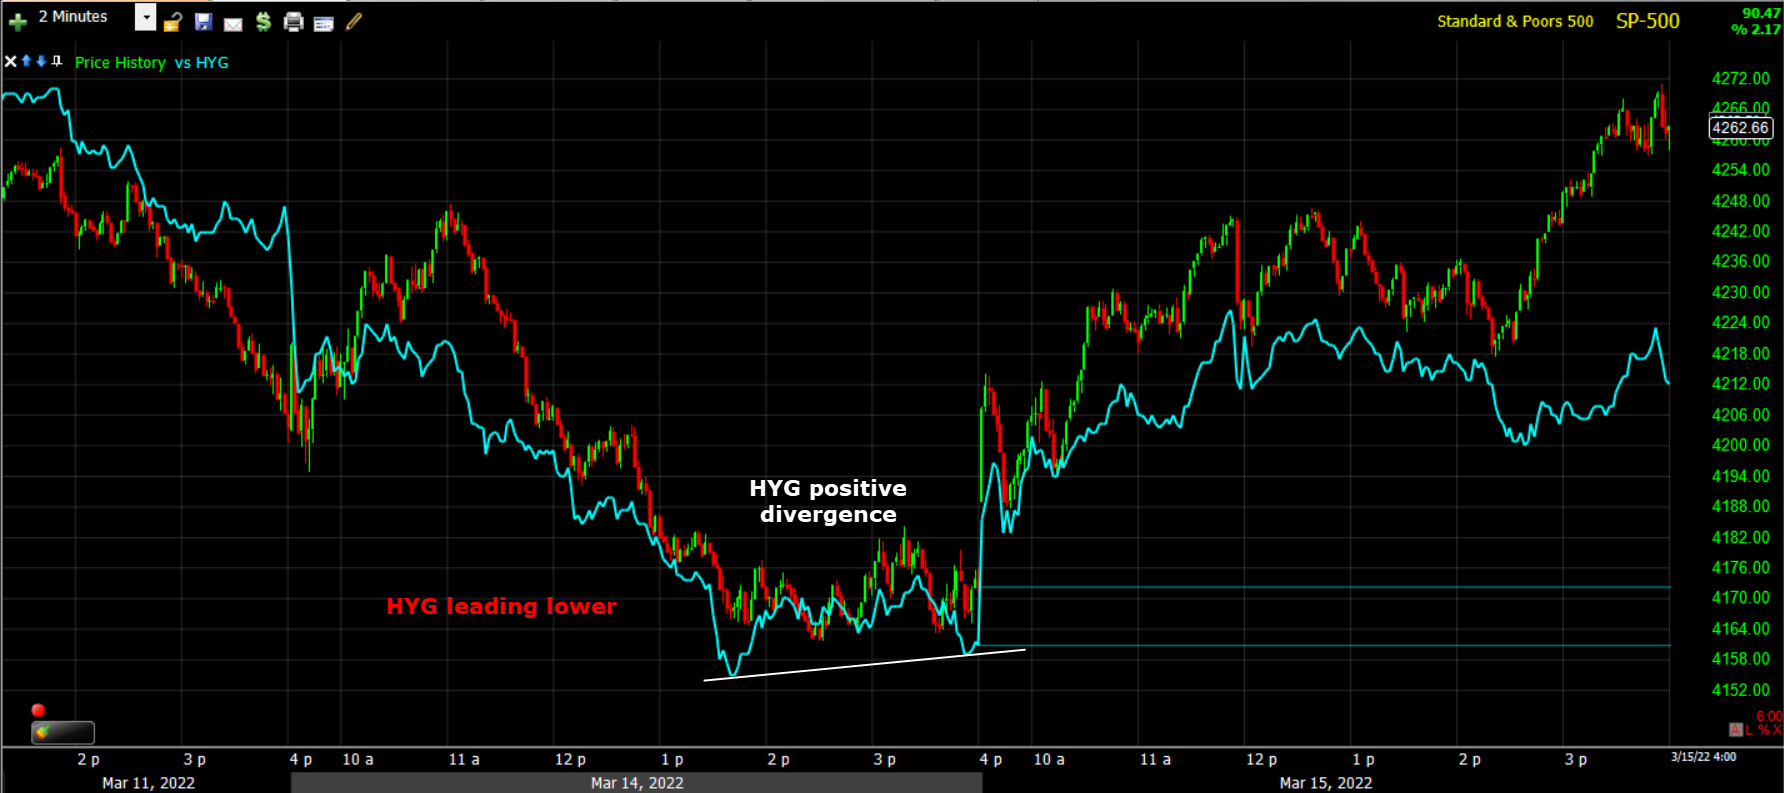 SP-500 (2m) with HYG leading lower right up to yesterday morning, but then a modest positive change in tone yesterday afternoon. HYG’s confirmation of the market’s afternoon gains out of the bullish consolidations was not so great, but yields had moved from intraday lows at the open to intraday highs through the afternoon, so it’s not surprising credit was lagging a bit.
My custom and more diverse credit index acted better on an intraday basis, but credit is still lagging badly on a trend basis.
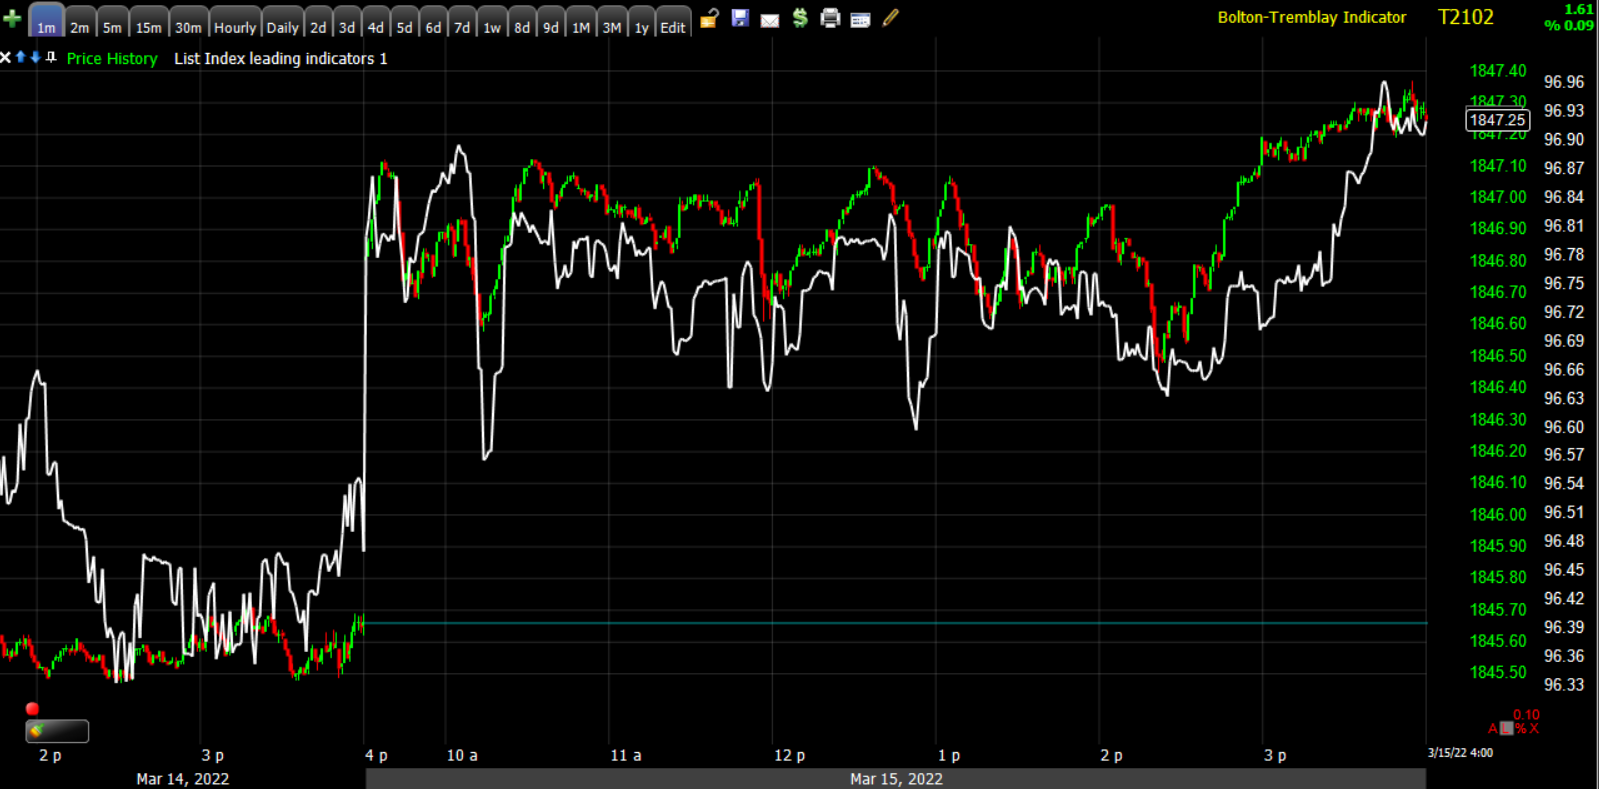 SP-500 (1m) and my credit index.
Currencies and Commodities
The U.S. Dollar Index was little changed at 98.99.
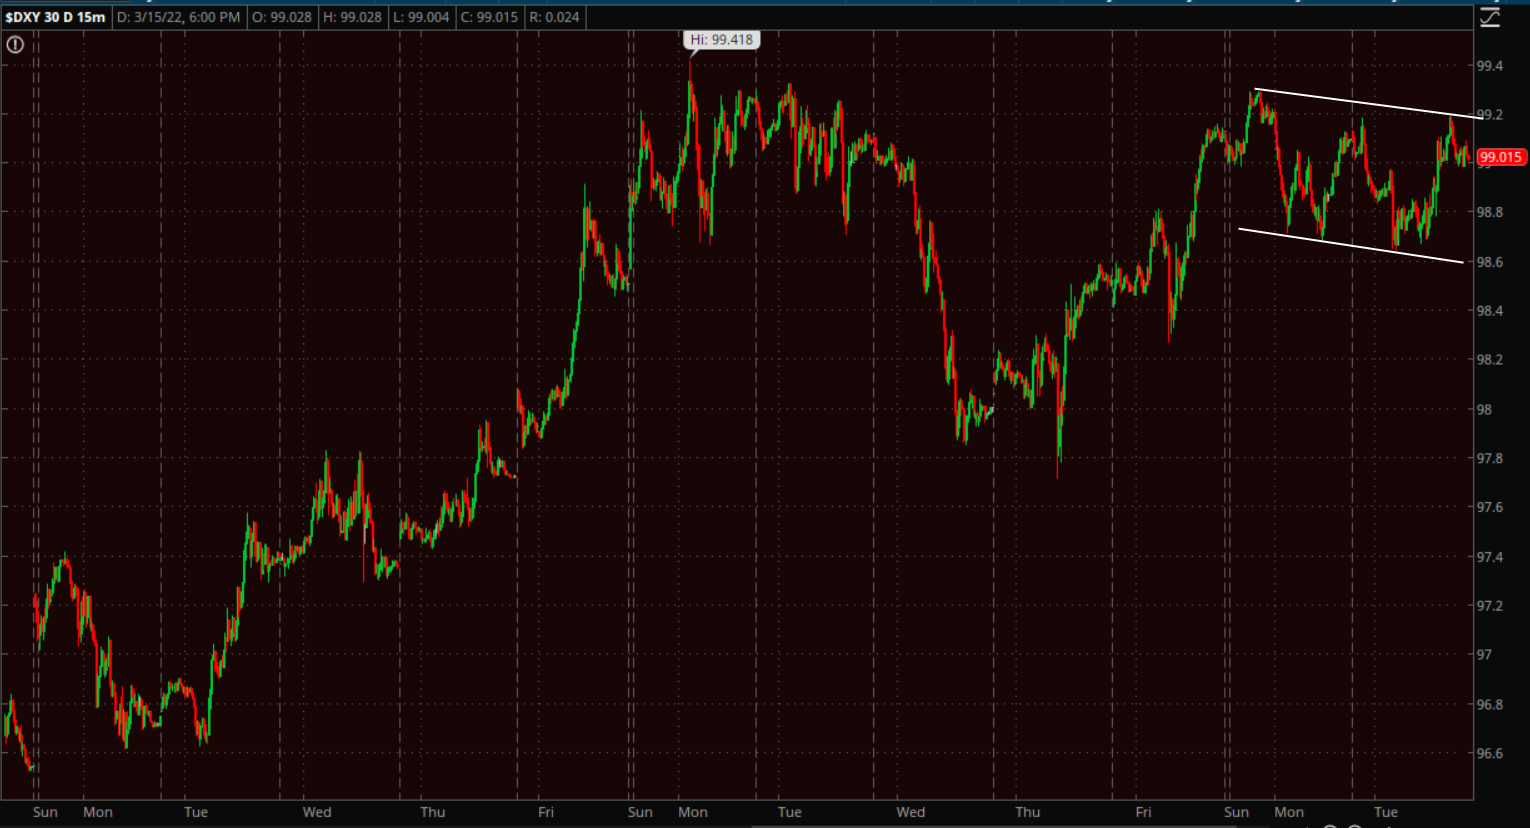 U.S. Dollar Index (15m) consolidating at local resistance in a bull flag.
WTI Crude continued it’s decline falling below $100 today to close nearly 30% lower since the tweezer top on Crude’s daily chart. Oil price has been a proxy for geopolitical risk of the Ukraine war, but now it’s starting to reflect deflationary potential of reduced consumer demand due to COVID lockdowns in China.
Crude futures fell -6.5% to $96.16/bbl, as growth concerns lingered due to China’s recent COVID-19 lockdowns.
 WTI Crude (15m) with a 3C negative divergence (selling pressure) into the $130.50 high and tweezer top (on the daily chart).
However, for the first time since the decline, there are some signs that buyers are starting to dip their toes in the water.
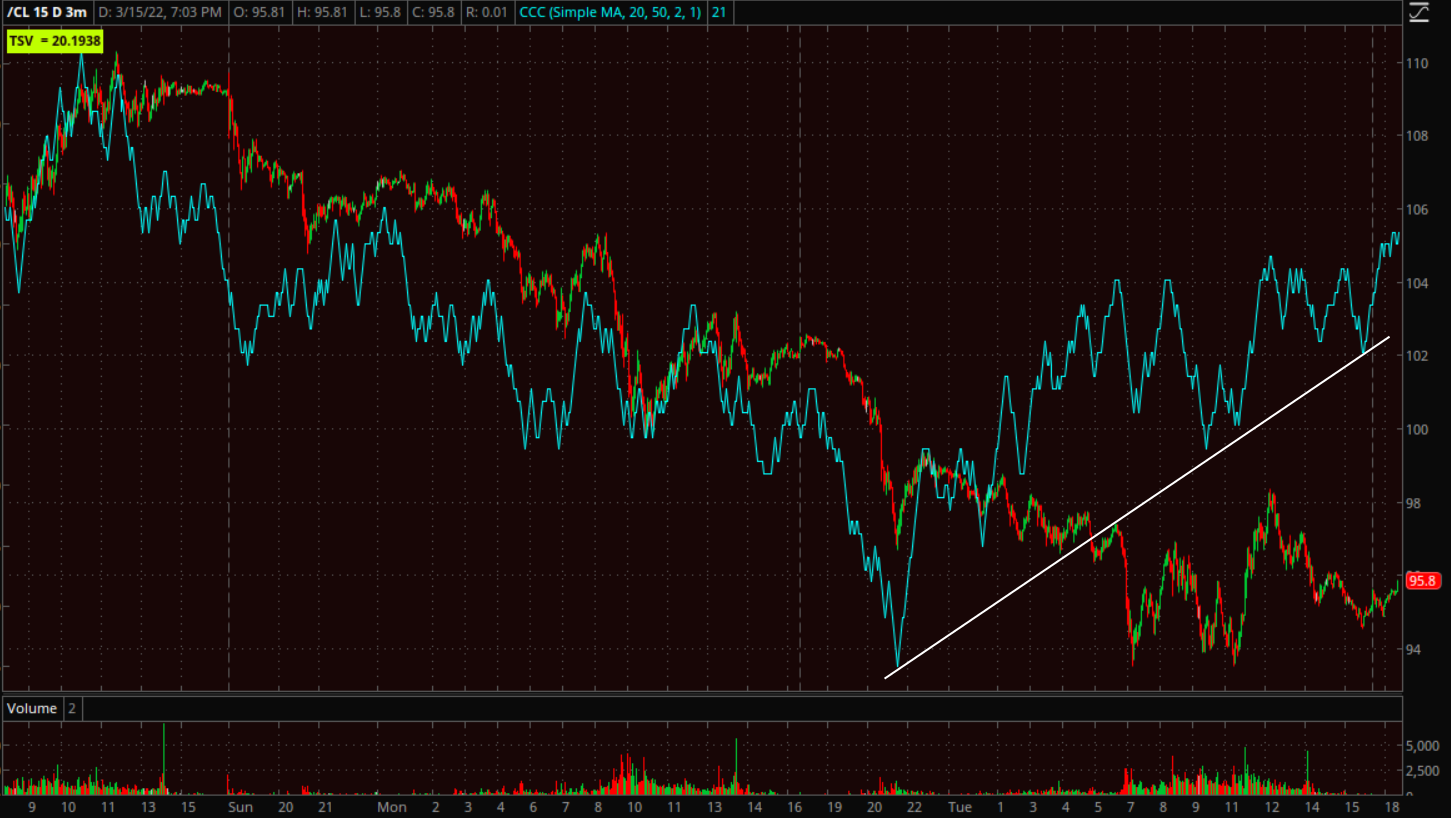 WTI Crude futures (3m) 3C positive divergence developing.
Gold futures continued their correction and ended lower by -1.6% to $1,929.70/oz, slipping to a near two-week low and breaking the up trend line coming in around $1950. As mentioned in last night’s Daily Wrap,
” I think gold is worth a look around $1950 on the long side, but I’d want to see evidence of buyers stepping in near the trend line and I haven’t seen that yet”
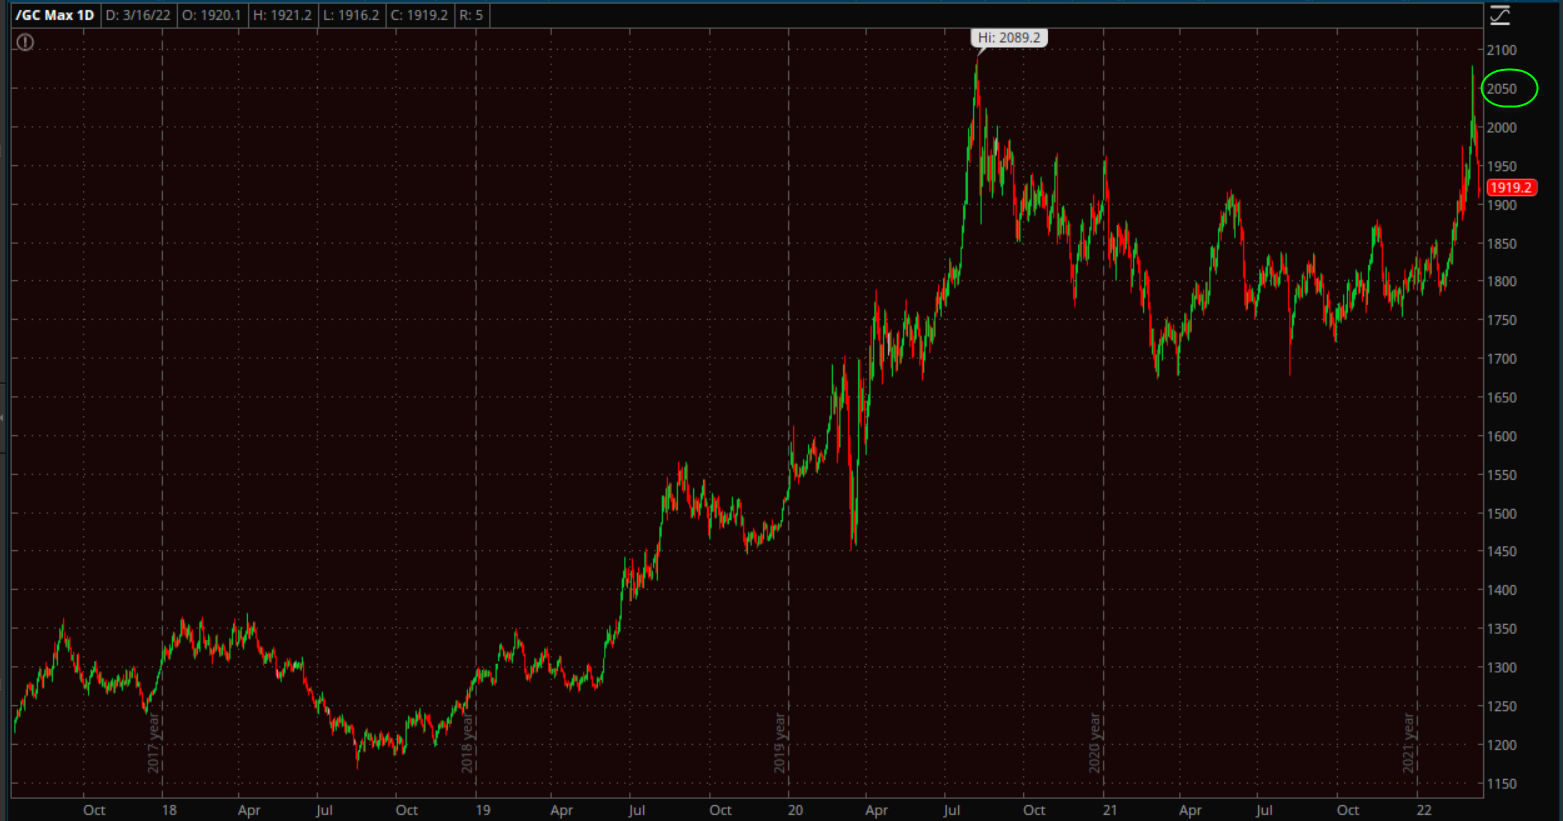 Gold met the measured move target of $2050, but as you can see, there’s resistance at the former high there.
3C reflected that resistance and profit taking at the measured move target after an excellent trend of 3C confirmation (making higher lows and higher highs) right up until the $2050 target was met….
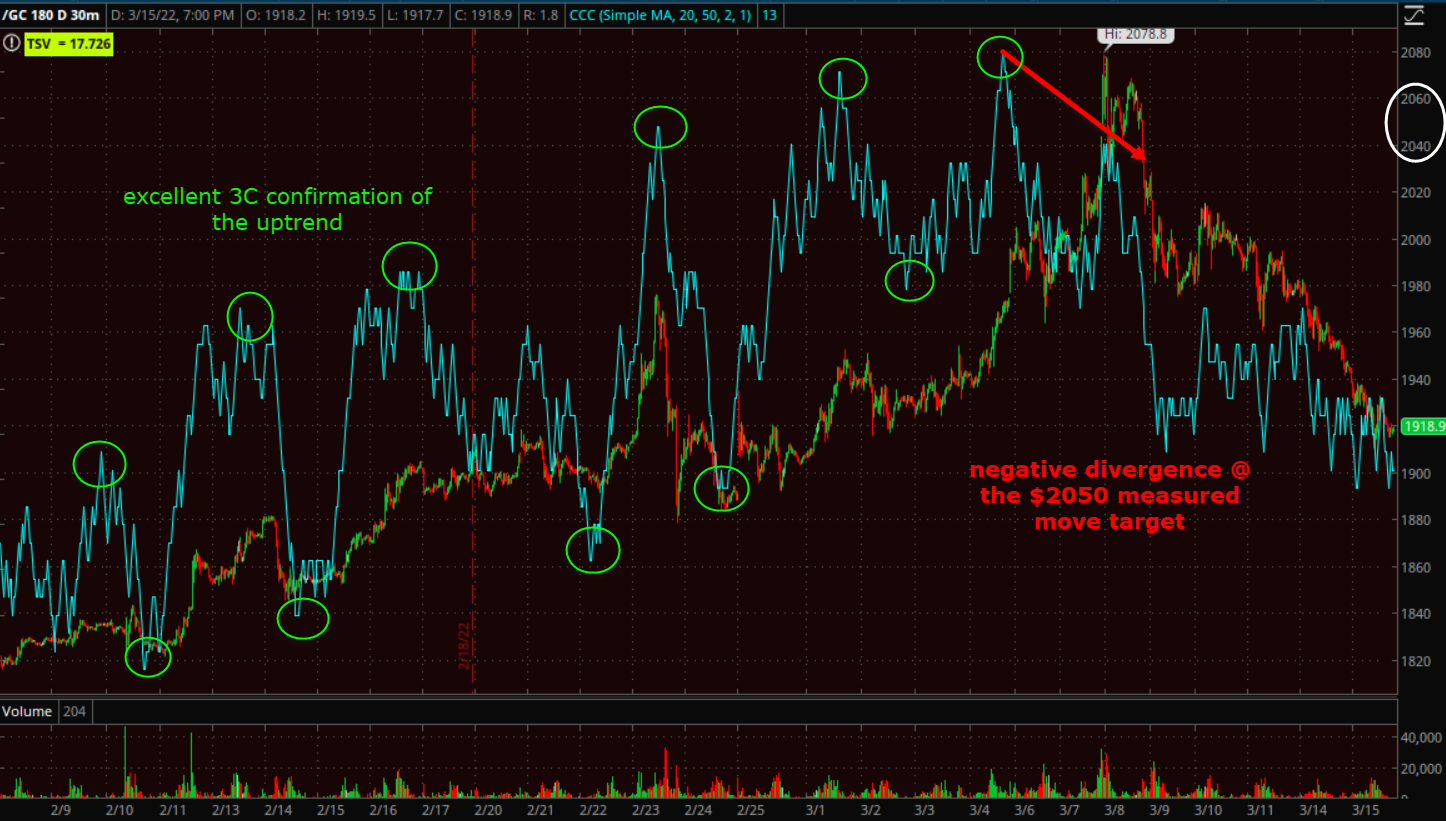 Gold futures (30m) – as of last night, there were no 3C signs of buyers and today price broke the up trend….
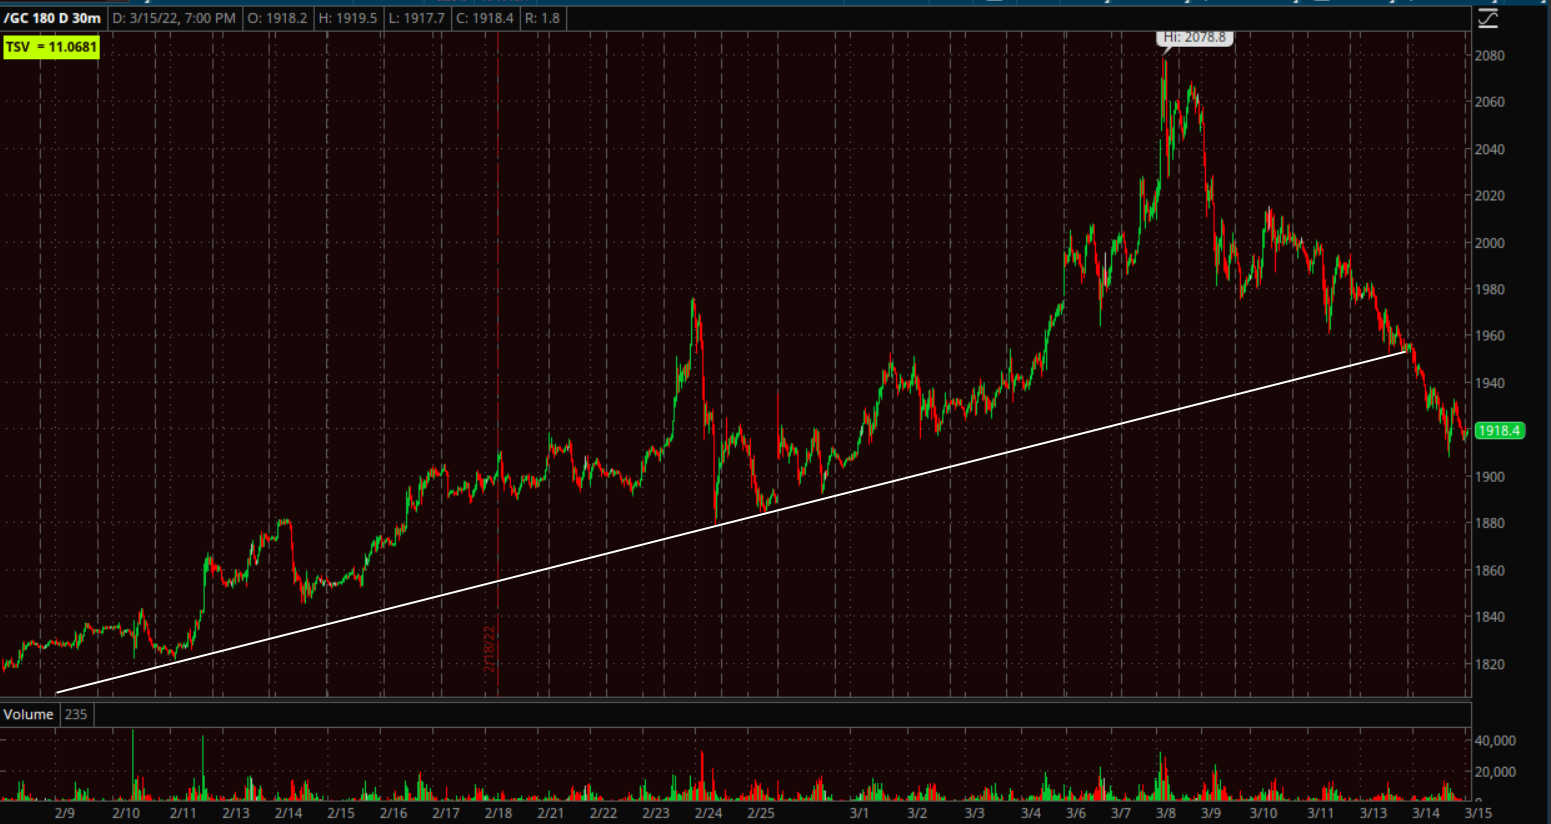 GC (30m)
However, like crude oil, there are now some early 3C signals suggesting buyers are starting to dip their toes in the water… GC (1m) with 3C positively diverging into today’s decline and low with a leading positive divergence forming tonight. I don’t like the break of trend, but if it’s a short-lived shakeout and prices quickly rebound above the trend line and 3C continues to improve, this may be a very interesting opportunity to buy the correction/pull back in gold.
Bitcoin was bid back above $39,500, but remains low in the consolidation with the $45k level being the start of key resistance.
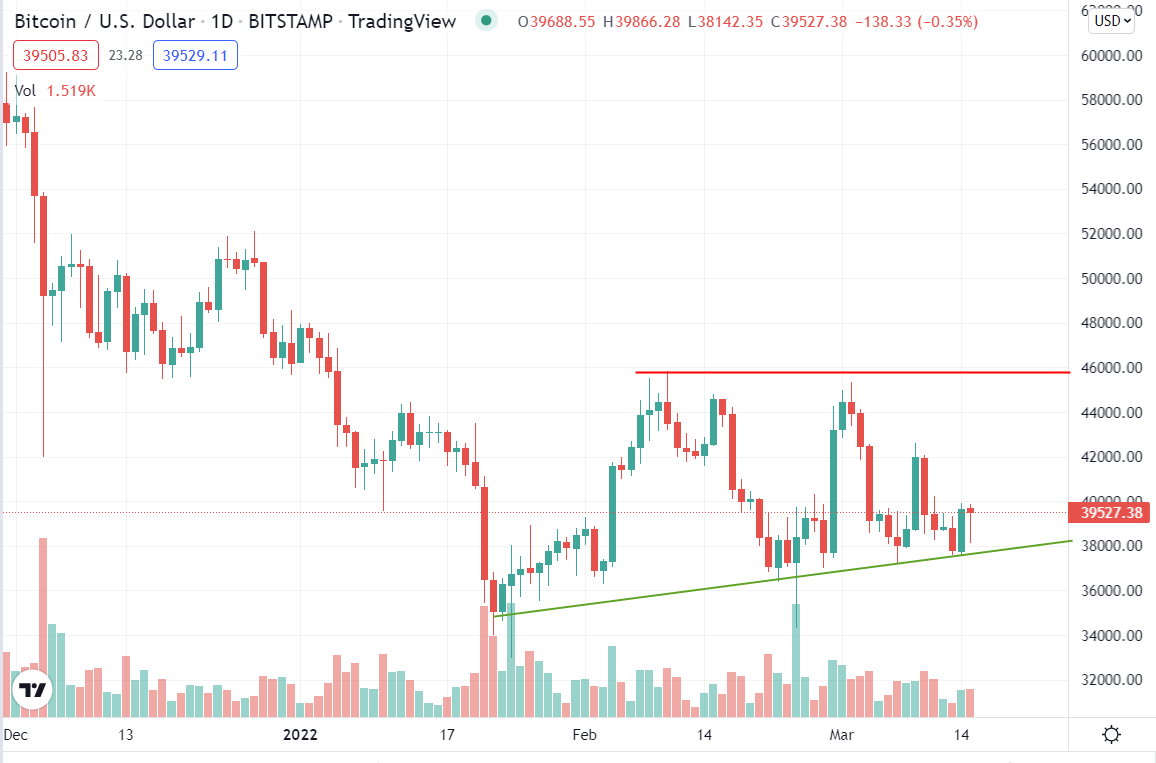 BTC/USD (daily)
Summary
Tomorrow is the big day the market has been waiting for… the March FOMC. One rate-hike is priced in as a ‘done-deal’ for tomorrow, but the market is now pricing in 7 rate-hikes for the year, which is a reflection of the Fed having to be more aggressive later in the year to combat inflation. However, 18 bps of rate cuts are already being priced in for 2023, suggesting the Fed’s rate hike cycle to combat inflation will cause an economic recession. Said another way, if the Fed is able to get control over inflation through rate hikes this year, it’s almost certainly going to cause a recession and they’re going to look to deal with the second order effects of the recession with rate cuts as soon as inflation has stabilized. At least that’s what the market is pricing in.
My gut feeling tonight is the same as the Afternoon Update. The strong closes and the lack of 1-day overbought internals suggest a probability that the averages add some more to today’s rebound in the morning, but then likely drift into the FOMC in the afternoon. Then it’s going to depend on what the Fed’s policy action is and what Powell’s tone is in the press conference.
Remember to always be way of the initial FOMC knee jerk reaction in stocks. The U.S. dollar (and yields) tend to be a good early indication of how the market took the policy statement, then Powell’s press conference (Dollar higher= hawkish, Dollar lower=dovish).
One of the more notable charts today was SPY’s sub-intermediate trend 3C, which had turned sideways and forecast the range bound trade in advance. Today it took on a much more positive tone.
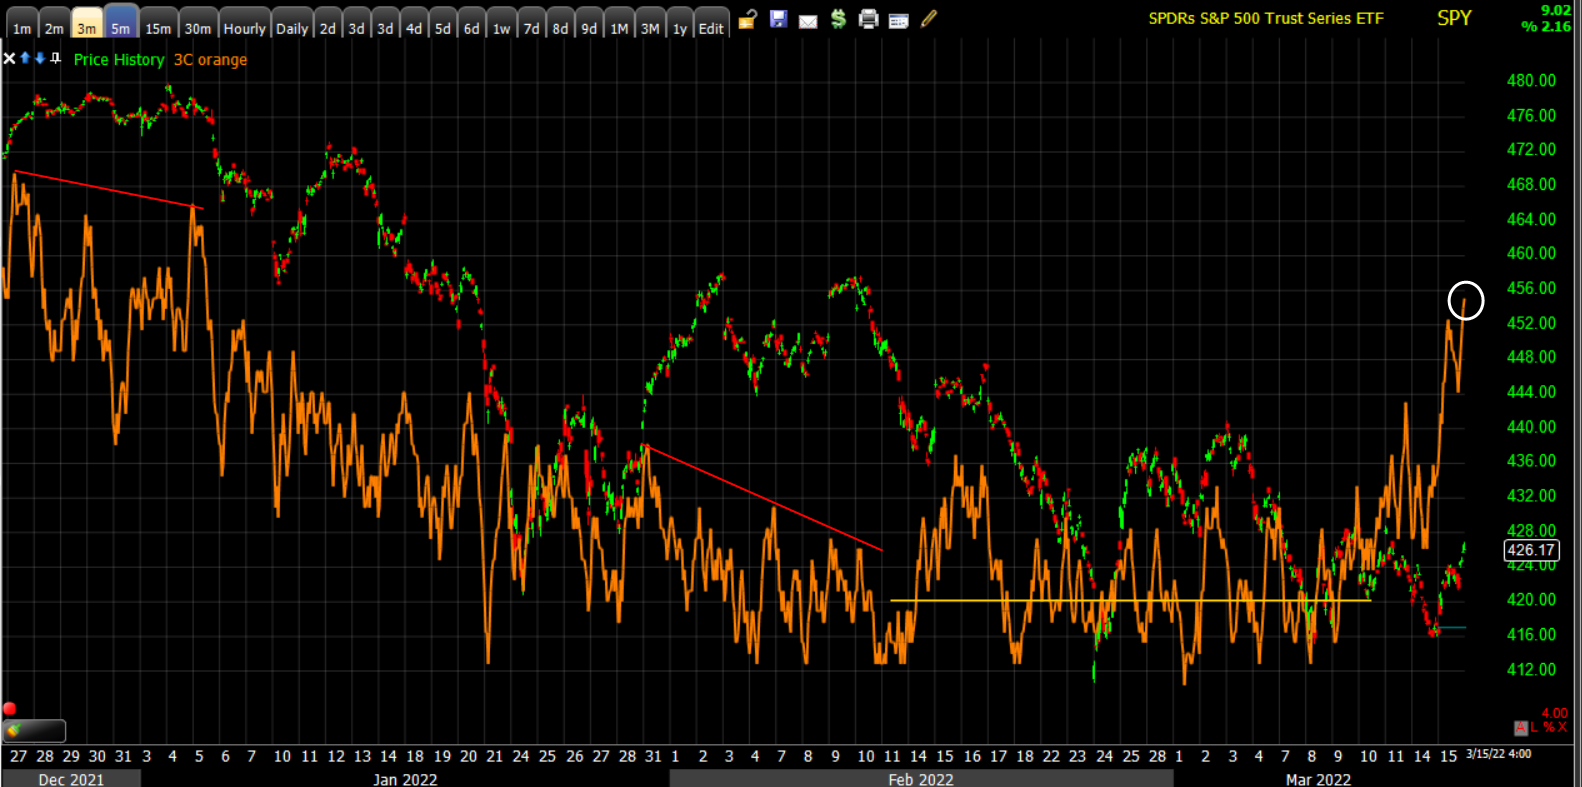 SPY (5m)
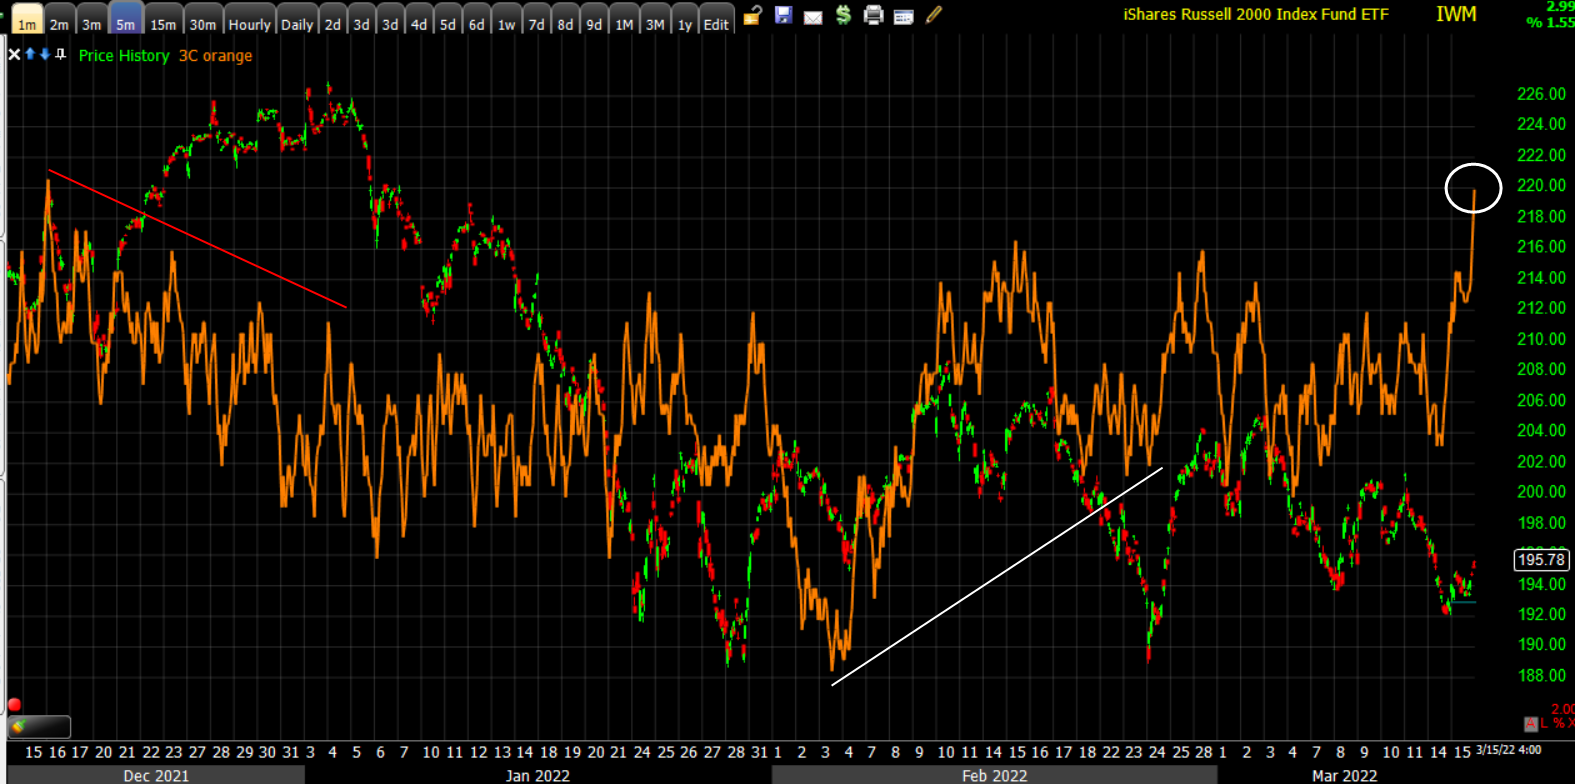 IWM (5m) is also seeing similar positive change in tone, although SPY’s is more of a dramatic shift from weaker 3C tone.
Overnight
S&P, Dow and Russell 2000 futures are down around -0.1% tonight in a consolidation, while NASDAQ-100 futures are flat also in a consolidation.
The U.S. Dollar Index is down -0.2%.
WTI Crude futures are flat, but worth keeping an eye on with 3C indicating some buyers finally starting to sniff around.
Gold futures are down -0.35% from settlement, but the 3C chart above is form tonight with a positive, leading divergence indicating some buyers are also sniffing around.
Bitcoin futures are down -0.9%.
Treasury futures are mostly unchanged from the short end to the belly. While not as clear as last night, some treasury futures like the 10-year are displaying more positive 3C tone, which of continues, would help the averages add to today’s gains in the morning, but I suspect by the early afternoon things will go flat ahead of the Fed.
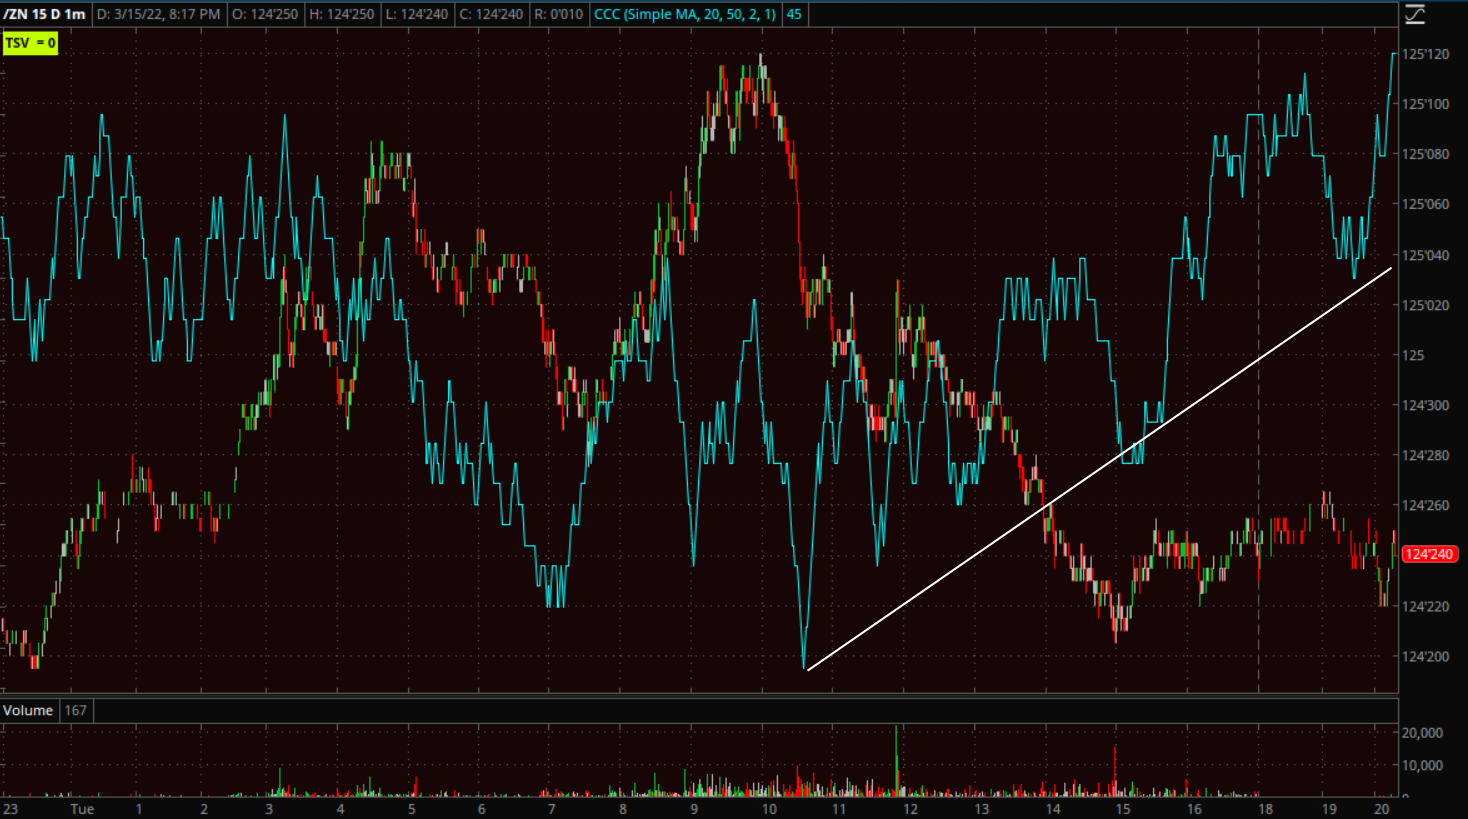
10-year Treasury futures (1m)
Looking ahead to Wednesday, investors will receive the FOMC Rate Decision, Retail Sales for February, Import/Export Prices for February, the NAHB Housing Market Index for March, Business Inventories for January, and the weekly MBA Mortgage Applications Index.