Stock Market, Currencies, Commodities and Bitcoin Update
Another mixed day for stocks with mega-caps outperforming (the same way they started Monday morning), but the rest of the market was soft.
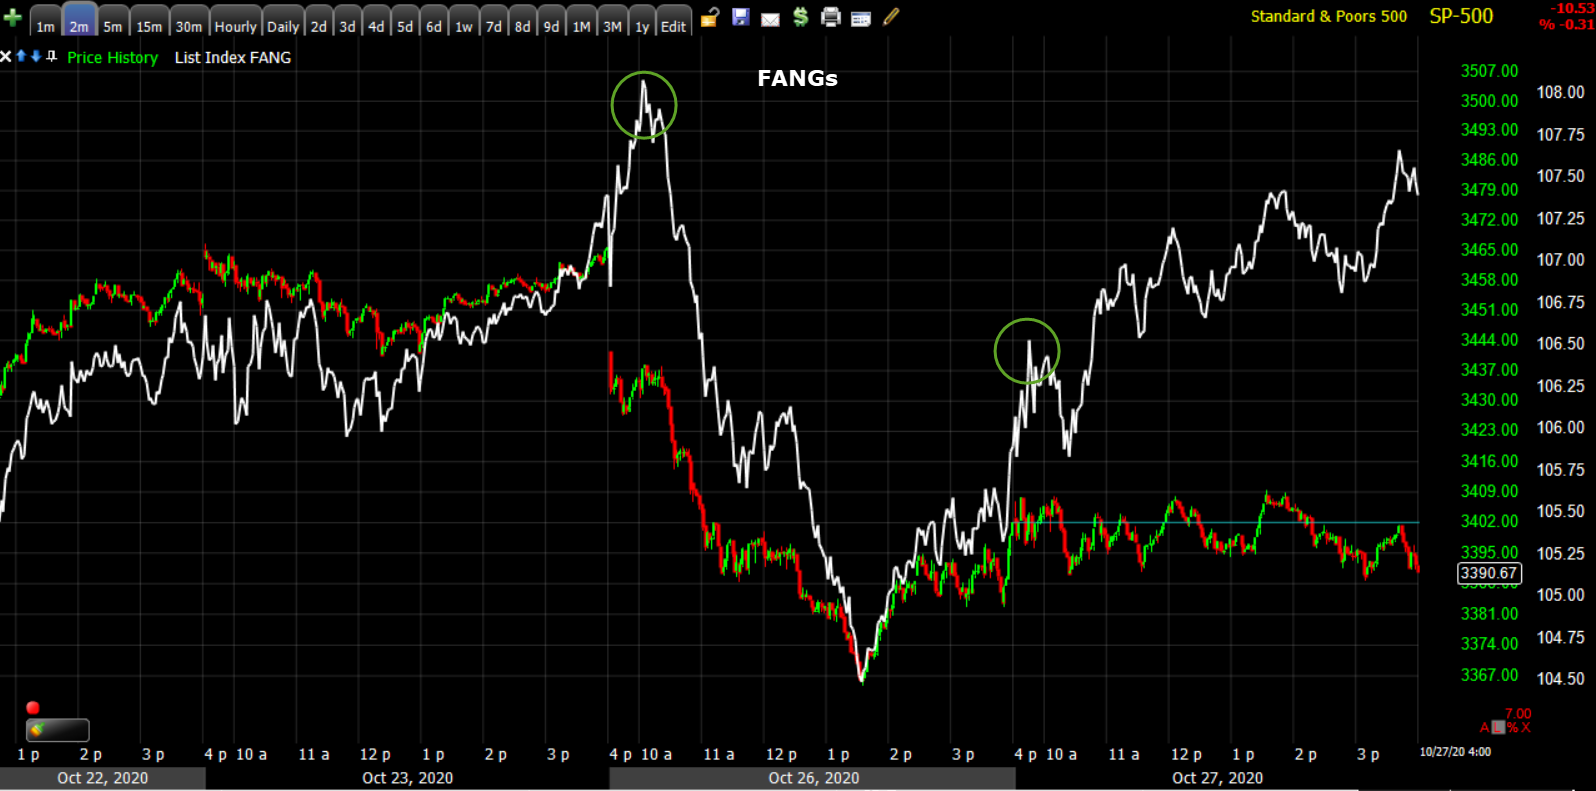 SP-500 (2m) and mega-cap FANG stocks strong Monday morning, then dumped, and strong this morning and the rest of the day.
Understandably, NASDAQ-100 outperformed the other major averages…
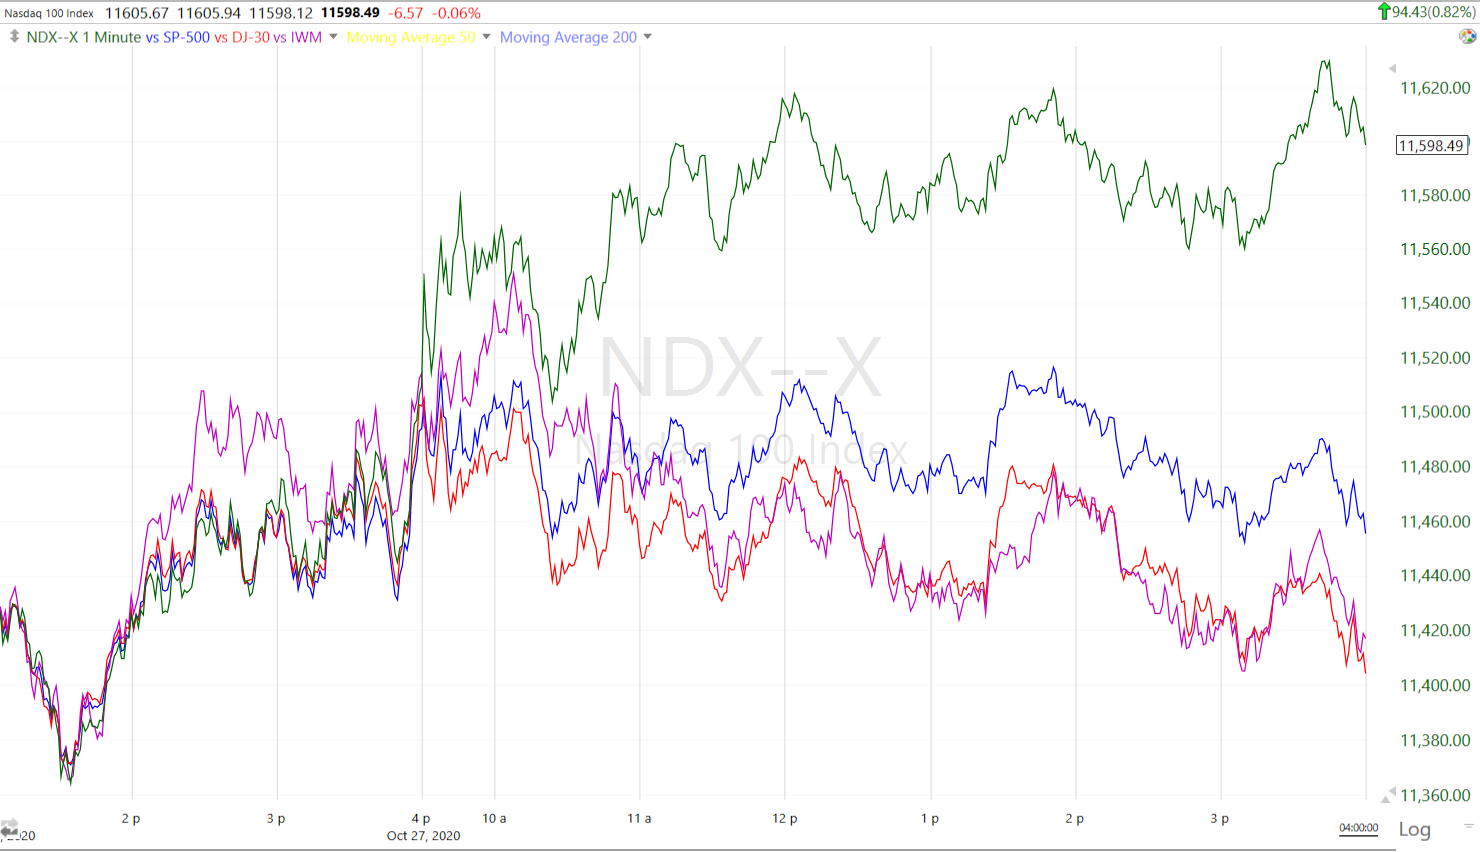 Since Monday’s low (1m) NASDAQ-100 (green) has outperformed the S&P, Dow and Small Caps ahead of Tech earnings.
Bitcoin and GBTC had another fantastic day, but that’s not a surprise with such constructive price action, and the reason why I’ve stayed long GBTC rather than trying to time exits and entries. As long as the price action is constructive, there’s no reason for me to trade in and out. I trade in and out to take advantage of an opportunity, and then get out of the way of uncertainty and risk.
Bitcoin’s performance for the last 12 months surpassed that of the NASDAQ today.
U.S. consumer confidence came in worse than forecast Tuesday, which takes added significance given the apparent failure to pass stimulus before the election. Data showed Covid-19 hospitalizations rose at least 10% in the past week in 32 states and the nation’s capital.
Averages
S&P was little changed in a tight ranged session. Yesterday was a solid 1-day oversold condition, but 1-day oversold doesn’t necessarily mean a rally the next day. Prices can consolidate too, which is essentially what the S&P did.
NASDAQ outperformed, while the Dow and Small Caps underperfomred together for a second day. Dow Transports -1.5% underperformed again and broke some technical support, although the 50-day sma is just below at $11,397.63. NASDAQ managed to get back above its 50-day, but Dow and S&P remained below. S&P found intraday resistance at its 50-day.
S&P 500 ⇩ -0.30 %
NASDAQ ⇧ 0.82 %
DOW JONES ⇩ -0.80 %
RUSSELL 2000 ⇩ -0.90 %
While everything sold off yesterday, the mega-cap Tech stocks and NASDAQ were initially strong just as they were stronger today. I addressed this in the weekend video too, showing how rising yields last week reflected reflation and cyclical stocks like Banks outperformed, moving up with yields, but extremely rich valuation stocks like mega-cap Tech languished due to higher yields as the justification for such extreme valuations has been low yields. With yields coming down this week the relationship has flipped and the Tech stocks are acting better, while the reflation stocks are weaker. The example from the weekend video starts around the 5:25 mark.
Additional evidence of this is apparent in style factors with the Momentum style factor (typical of many Tech stocks) gained +0.2%, while the Value style factor (typical of cyclical stocks) lost -1.9%.
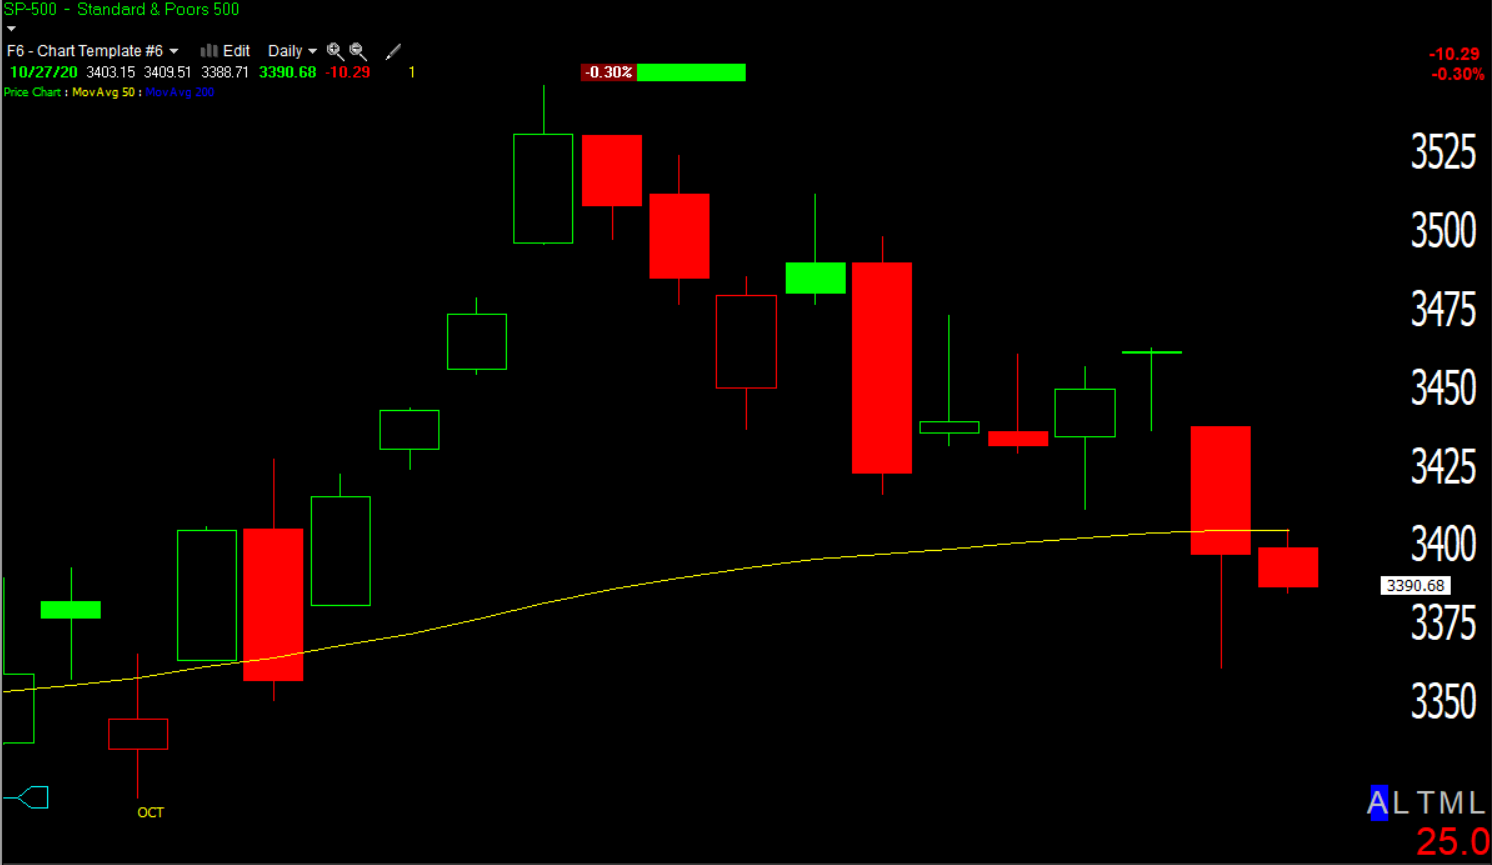 SP-500 (daily) intraday prices found resistance at the 50-day from below.
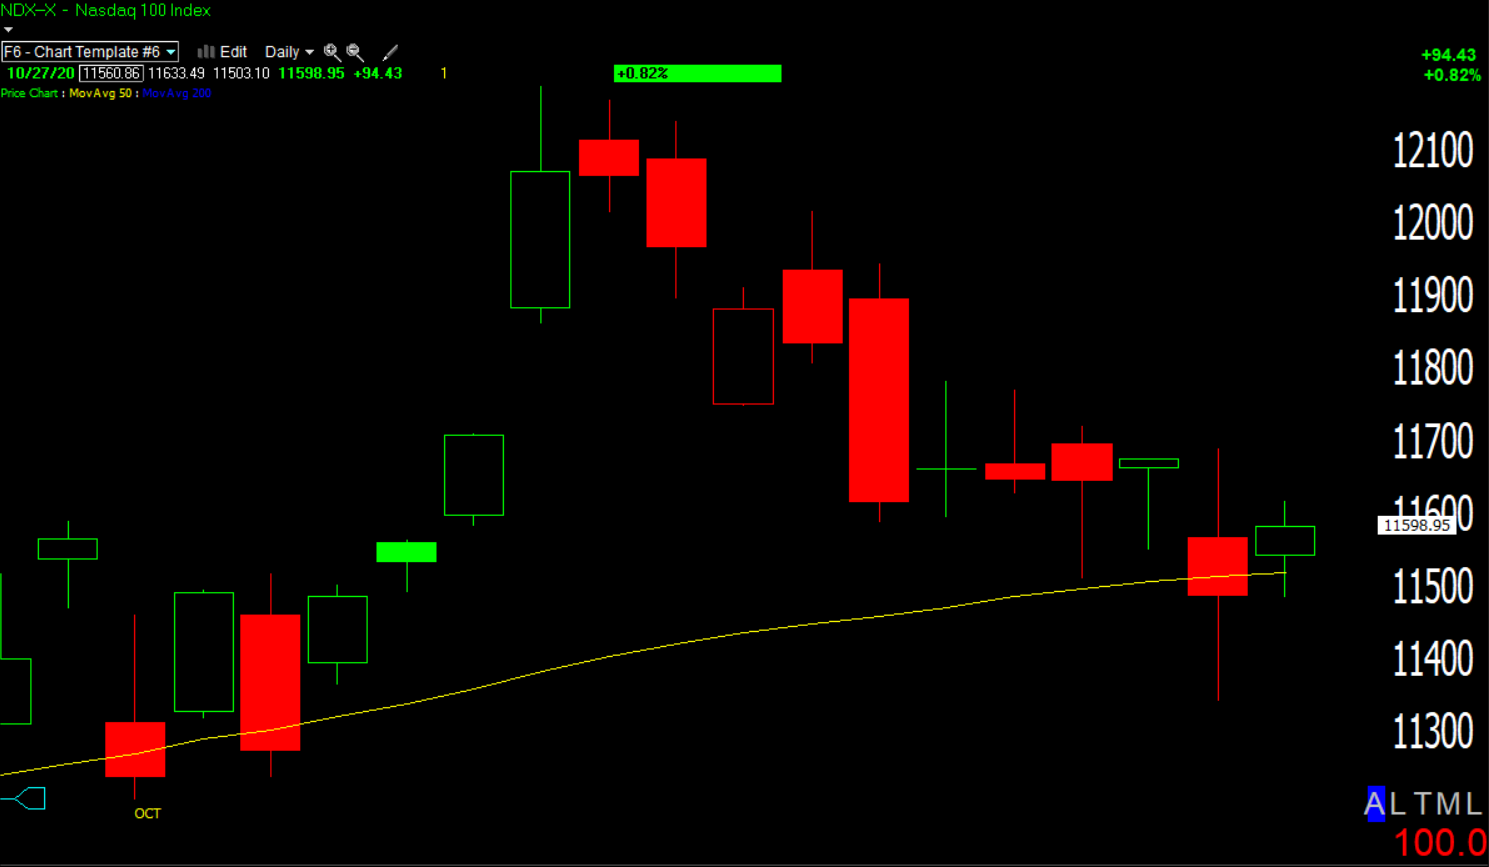 NASDAQ-100 (daily) above its 50-day
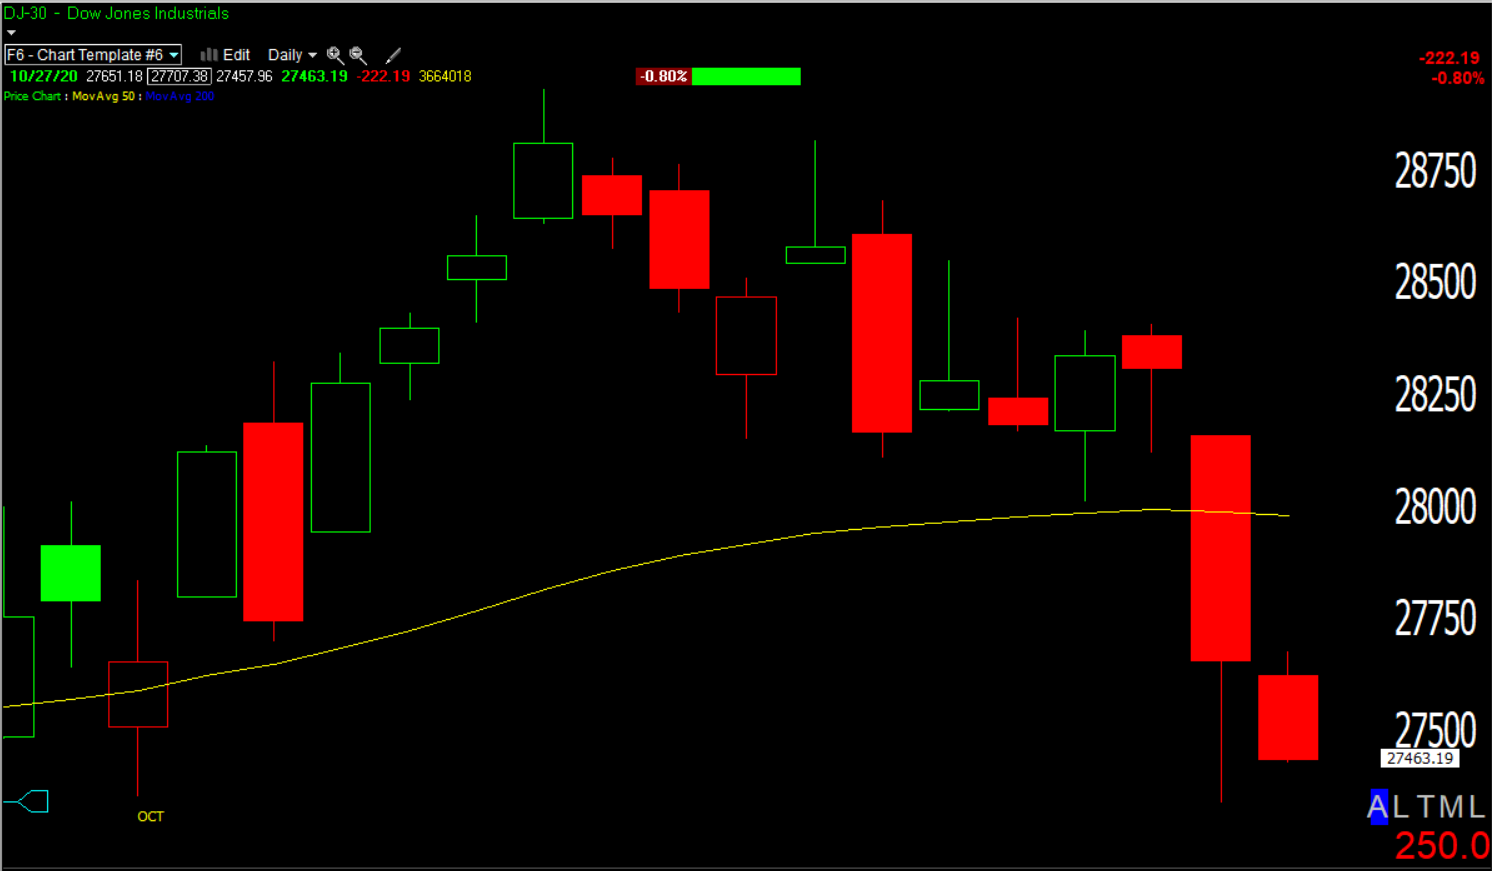 Dow (daily) below its 50-day. Last week I mentioned several times that the more the bull flags pulled back, the less bullish they were. In the weekend video I raised the possibility of a September 2019 scenario in which very bullish price action / bull flag kept extending lower until it was nullified, followed by a sharper decline. The example starts around 3:45 in the video. See the Technology sector chart below as this sector was one of the first to raise the possibility of such a scenario.
Here’s the Dow from September 2019 (below), it looks a lot like the current chart (above).
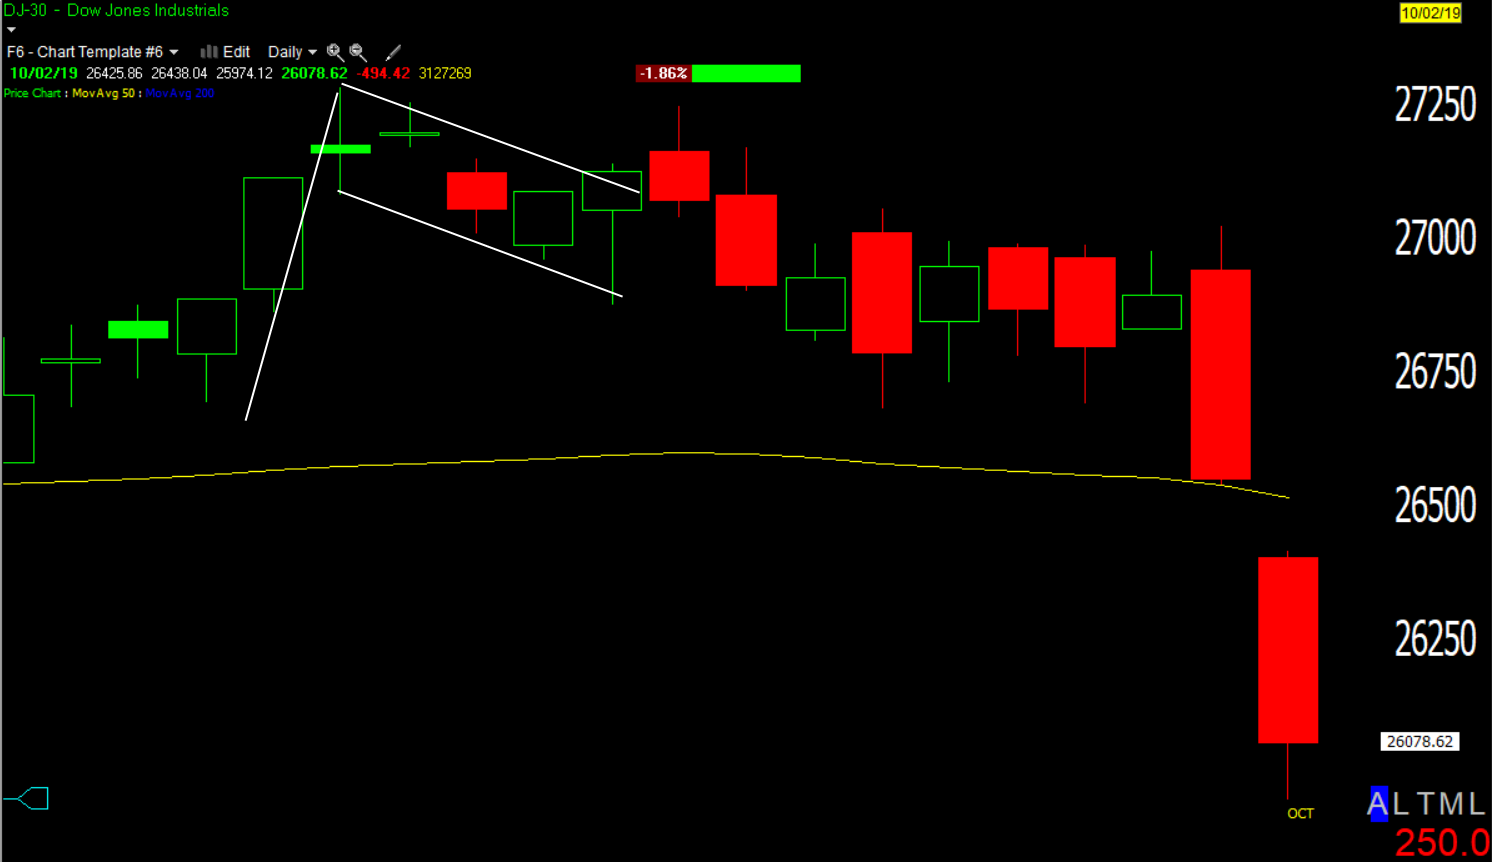 Dow (daily) September 2019
Small Caps from the same period offer an even better example…
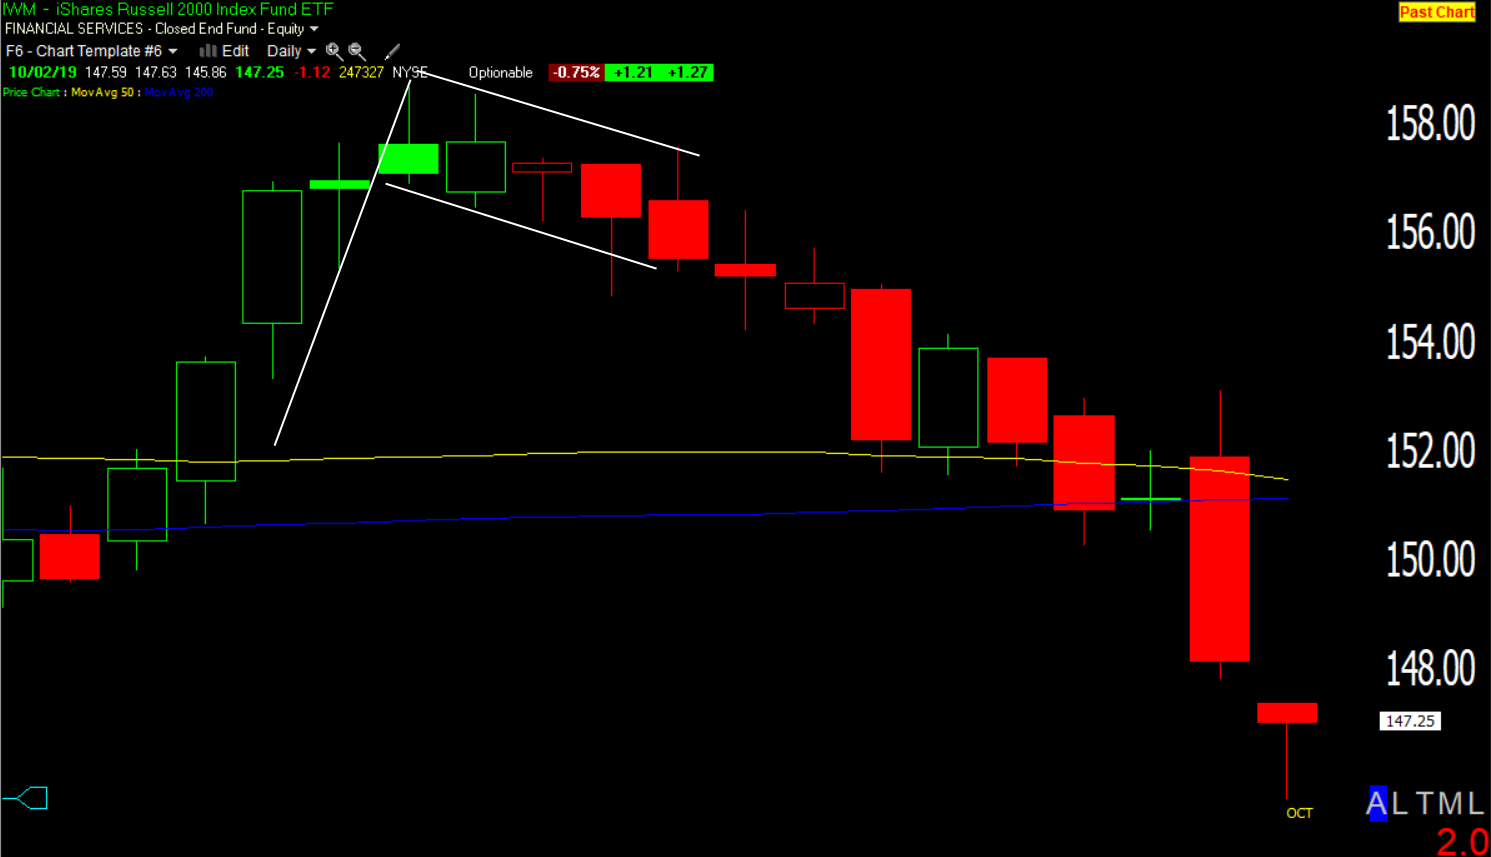 IWM (daily from September 2019) with a strong advance, bull flag, then the flag turned into a downward sloping channel and prices eventually sold off below the 50/200-day moving averages. Changes in character precede changes in trends.
![]() Dow Transports (30m) losing ground as the recent reflation narrative that drove them higher falls apart this week.
Dow Transports (30m) losing ground as the recent reflation narrative that drove them higher falls apart this week.
![]() Dow Transports (daily) are coming up on the 50-day moving average near $11,700. Normally I’d expect them to find at least initial support there, but Dow Industrials sliced right through the 50-day.
Dow Transports (daily) are coming up on the 50-day moving average near $11,700. Normally I’d expect them to find at least initial support there, but Dow Industrials sliced right through the 50-day.
As a side note, Bloomberg notes a recent trend of large-lot sellers contrasted by small lot dip buyers, which probably explains some of the negative 3C divergences on charts like IWM.
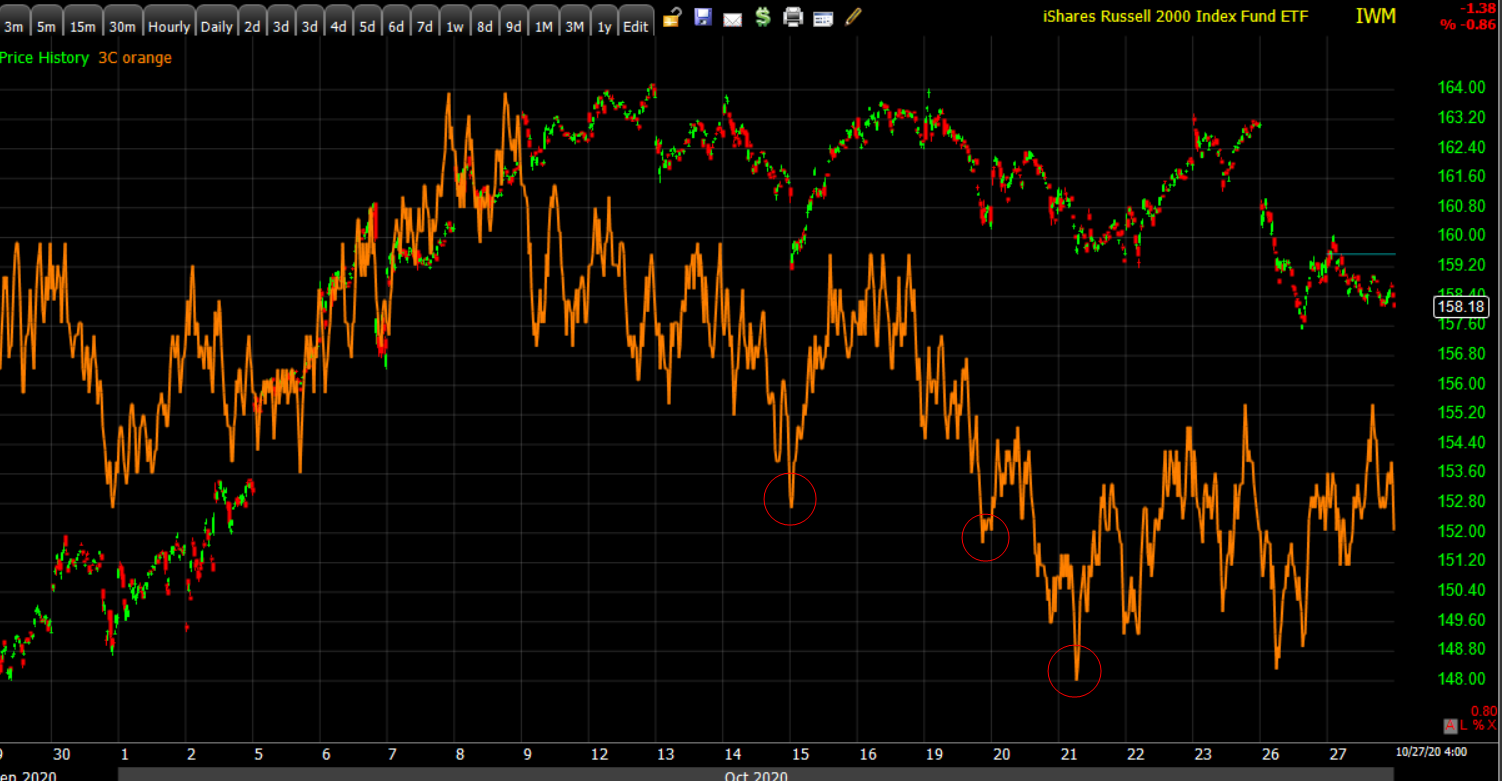 IWM (2m) 3C leading lower
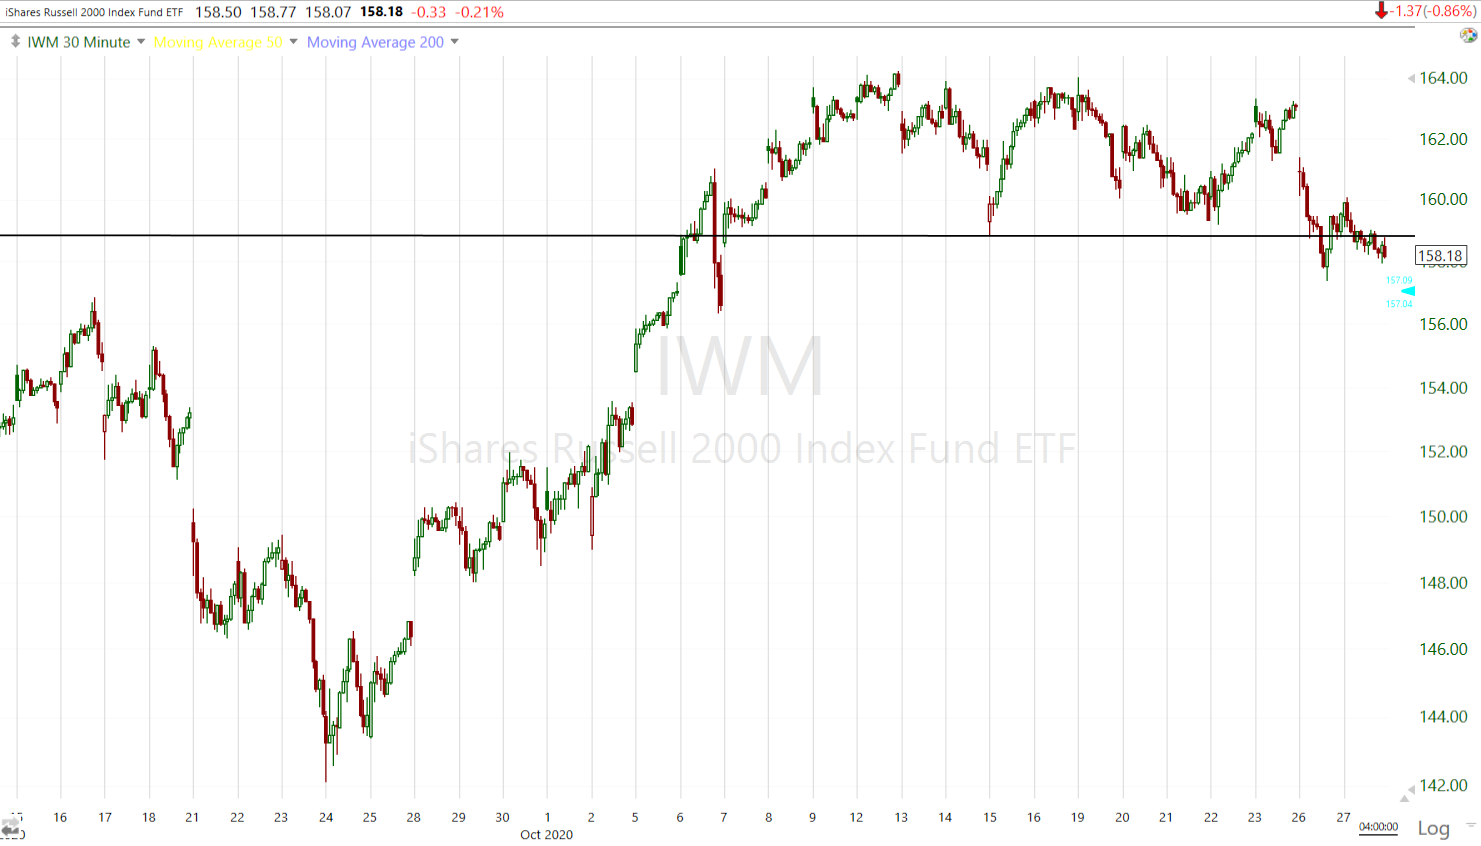 IWM (30m) is probing below support for most of October.
If the major averages had put together a fairly quick test of yesterday’s low, or in S&P’s case the lower channel, the risk-reward for a quick long trade back up to the top of the channel looked enticing. This is what I was considering yesterday. However, the failure to put together such a test leaves the S&P increasingly exposed to a second leg down and USD/JPY’s decline turned the environment even more risk-off.
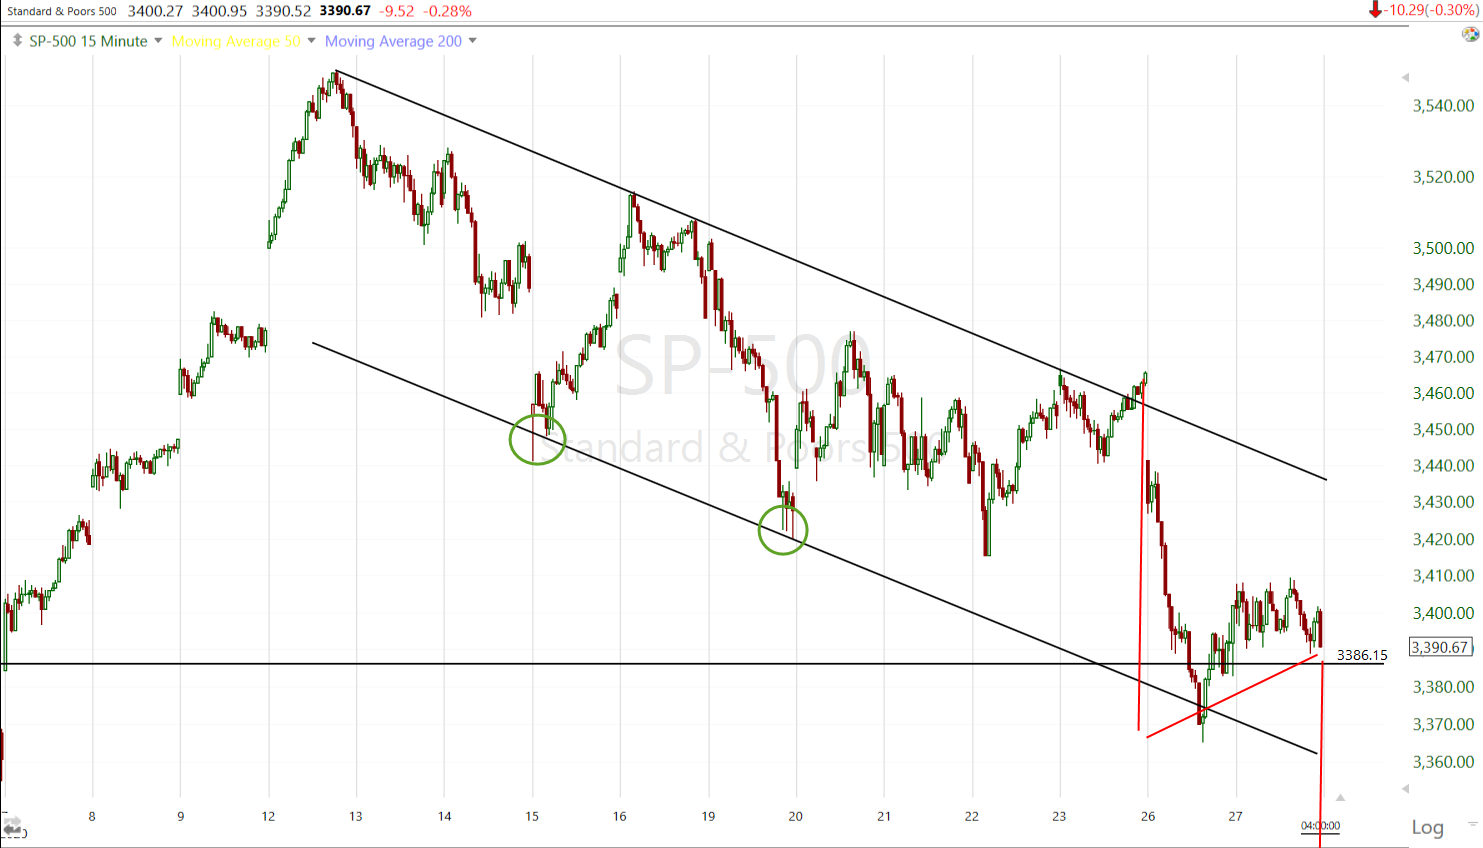 SP-500 (15m) the last two declines to the lower channel tested fairly quickly (green). I was hoping we’d get that test yesterday or early today, but prices consolidated with the S&P’s 50-day acting as resistance, forming a small bearish pattern that increases the probabilities of a second equal leg lower (-2.9%) which would target the $3000 area.
The Dow looks most exposed with the largest second leg measured move of -3.3%.
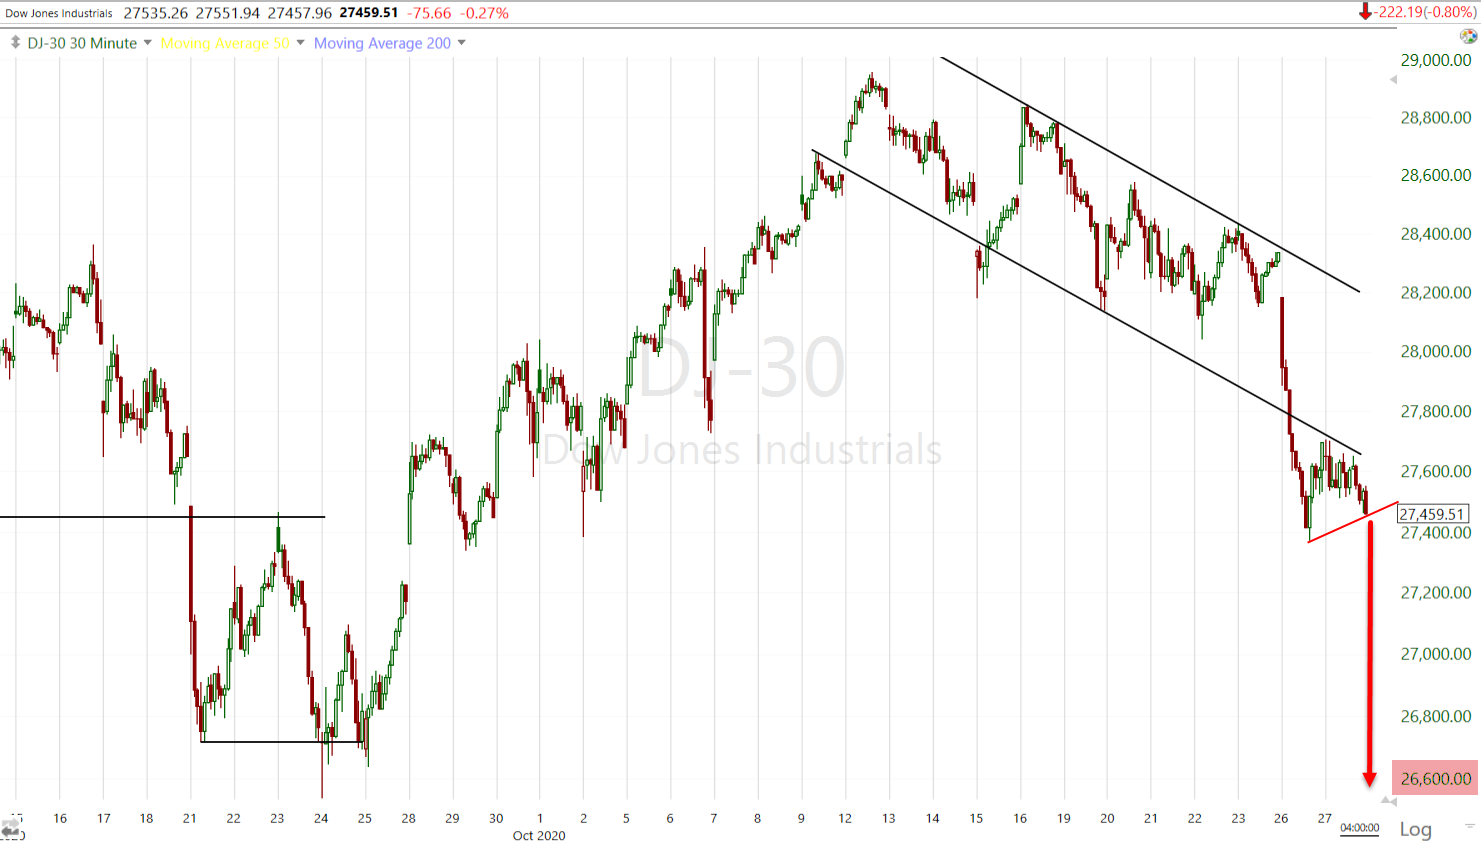 Dow (30m) former support at the lower channel is now resistance just as the S&P’s 50-day was former support and now resistance. I’d estimate a second leg would target the $26,600 area and wipe out the entire advance from September’s low. Suddenly USD/JPY’s risk-off signal last week is making more sense, a signal which it added to today.
Volatility
VIX broke out above its 50-day for the first time since September yesterday and added another +2.75%, increasing the gap between it and the S&P.
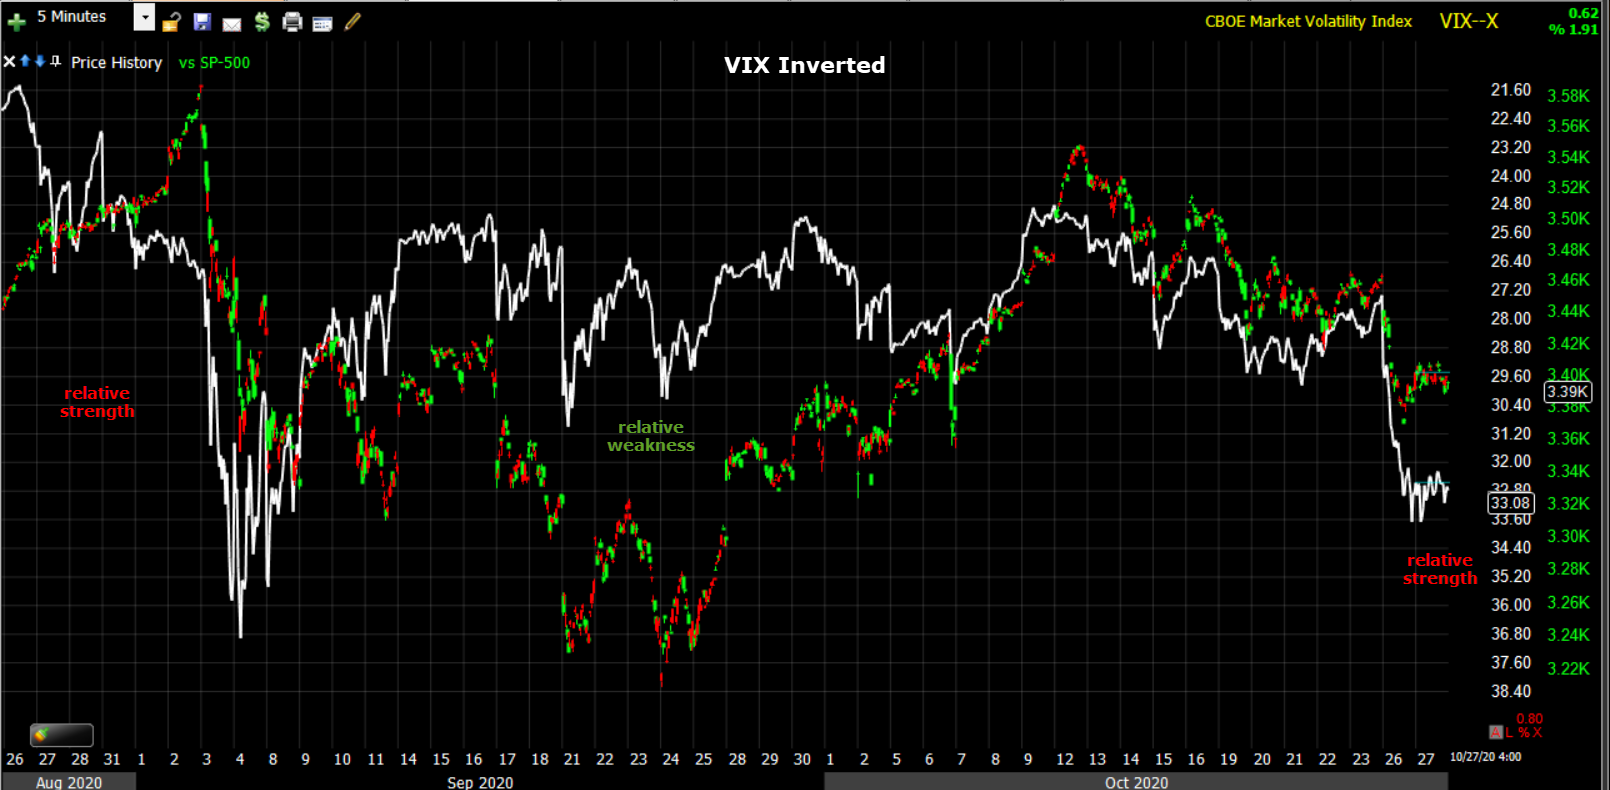 SPX (5m) and VIX’s relative performance leading the S&P generally.
VVIX’s signals are less effective, but recently more extreme.
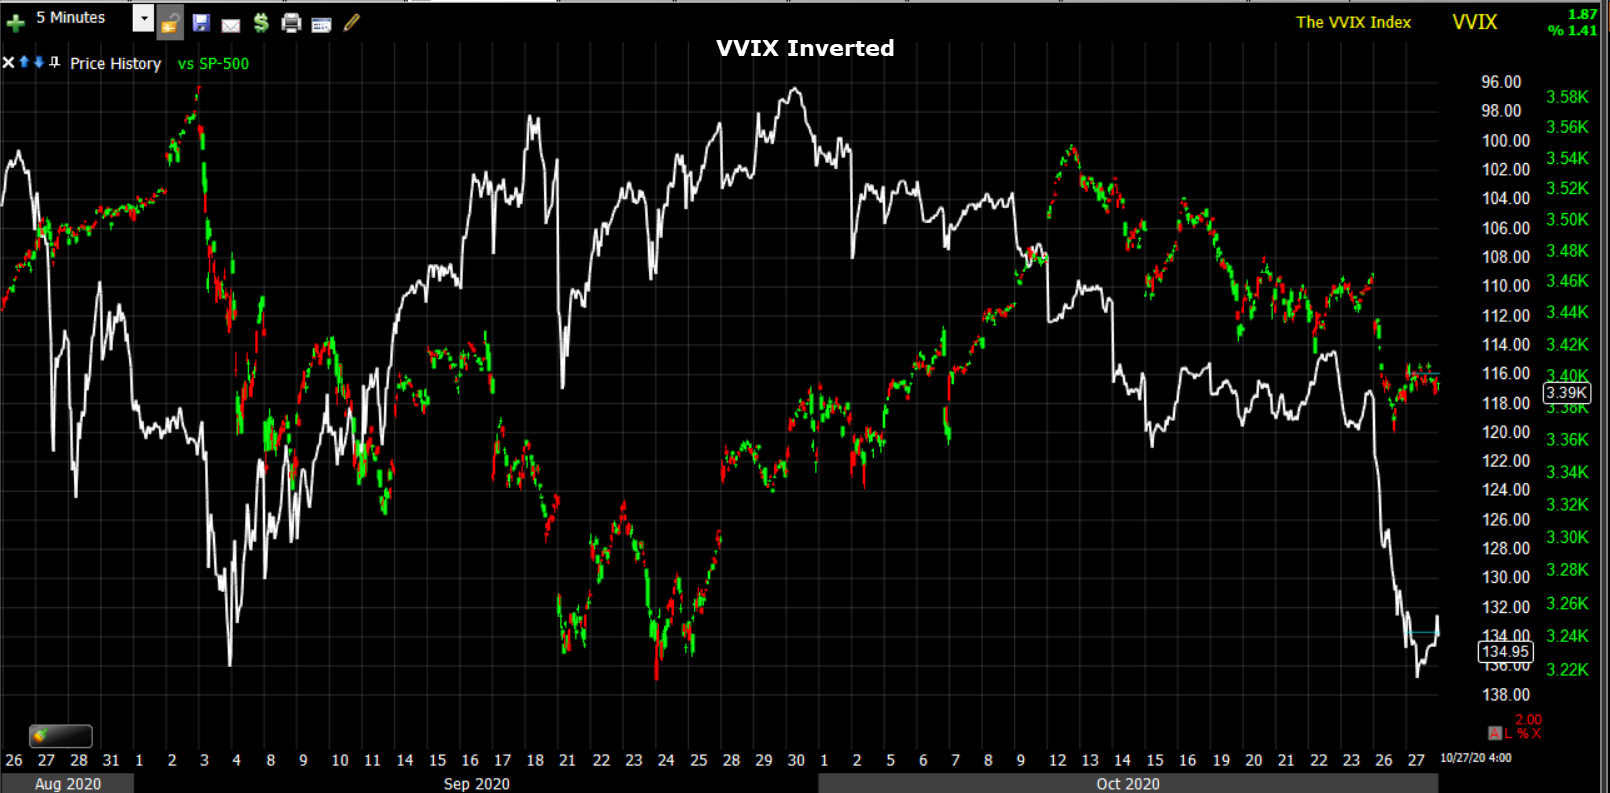 SPX (5m) and VVIX inverted. If nothing else it’s a pretty simple depiction of anticipated risk.
S&P sectors
Growth-sensitive cyclicals that largely outperformed last week, have been the laggards this week. You might notice that beyond day-to-day or week-to-week, the market has had an exceptionally hard time establishing any kind of meaningful leadership for long.
Conversely the large-cap Tech/FANG related Tech and Communications sectors outperformed. Microsoft (MSFT +1.5%) provided support for the tech sector ahead of its earnings report after the close, although the broader Tech sector’s 3C charts looked better into the close than MSFT’s did. Xilinx (XLNX +8.6%) agreed to be acquired by Adv. Micro Devices (AMD -4.1%) in an all-stock transaction valued at $35 billion.
Elsewhere earnings responses were generally disappointing. Caterpillar (CAT -3.2%) and 3M (MMM -3.1%) were notable drags on the industrials sector after the companies refrained from providing guidance. Health care companies Pfizer (PFE -1.3%), Merck (MRK -1.1%), and Eli Lilly (LLY -5.6%) issued in-line/upside guidance, but shares still closed lower.
Materials ⇩ -0.95 %
Energy ⇩ -1.30 %
Financials ⇩ -1.82 %
Industrial ⇩ -2.19 %
Technology ⇧ 0.50 %
Consumer Staples ⇩ -0.26 %
Utilities ⇩ -0.08 %
Health Care ⇩ -0.68 %
Consumer Discretionary ⇩ -0.05 %
Real Estate ⇩ -1.28 %
Communications ⇧ 0.64 %
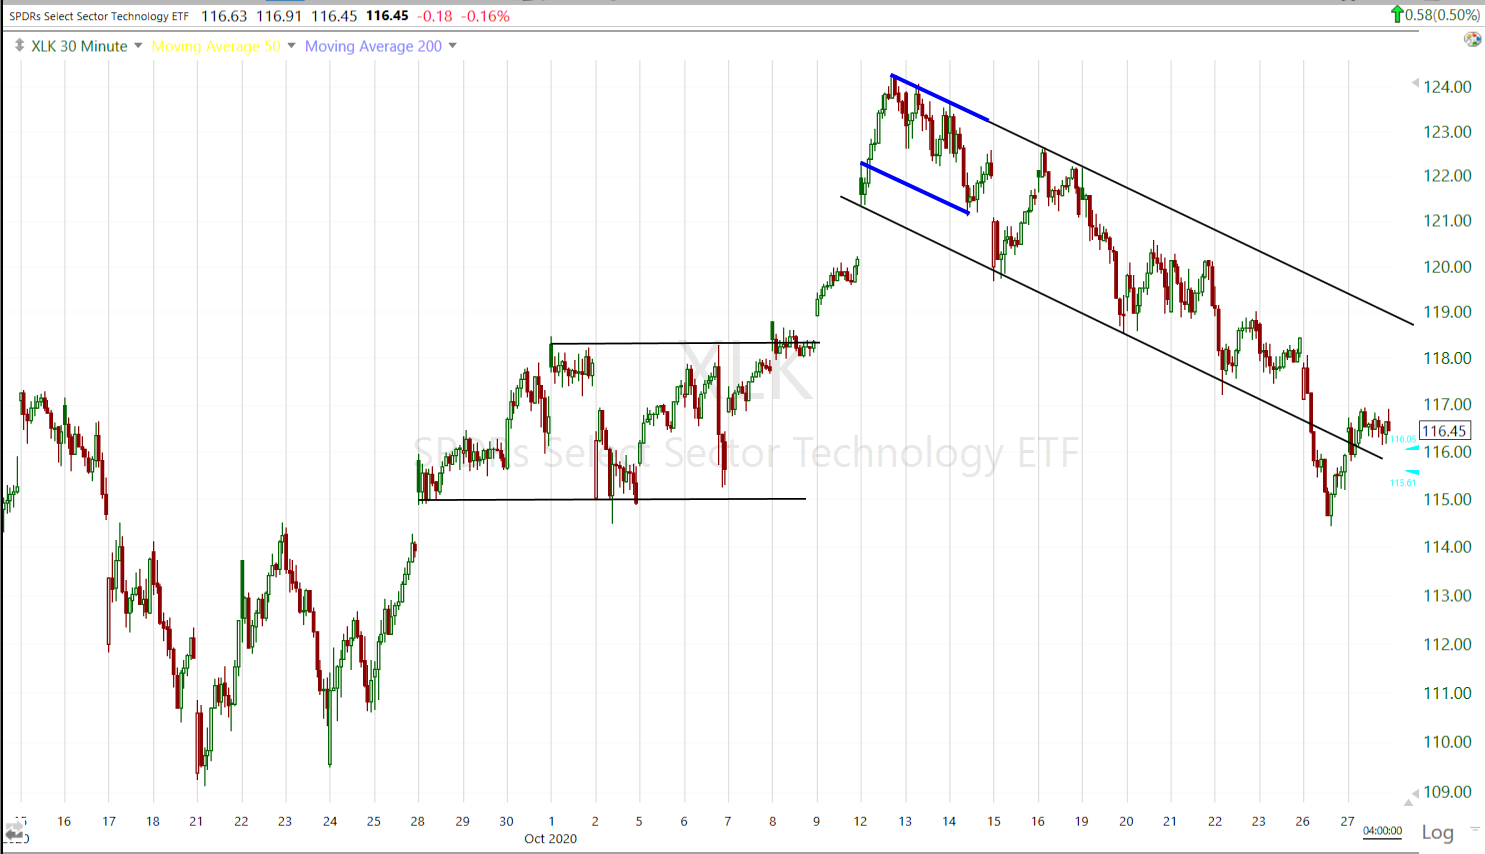 Tech sector (30m) started with a very bullish, small flag (blue). The flag became larger last which was still ok, but the more it pulled back, the less it could be viewed as a consolidation. It has retraced all of the rally from the last breakout. XLK’s 3C chart did show some strengthening before the close and since price is back in the channel, there is a chance that the dip below acts as a channel buster/head fake and runs up to the top of the channel or above (the reverse concept of the S&P’s failed breakout Friday and drop below the channel). However, this is sector specific, not market wide.
The Banks that did so well last week amid the reflationary tone, surging yields and steepening curve, but failed to make a significant trend change, are back in no-man’s land. The KBW Banks Index fell -3% and Regional Banks fell -3.5% (likely exacerbated by losses in the Energy sector they have loan exposure to).
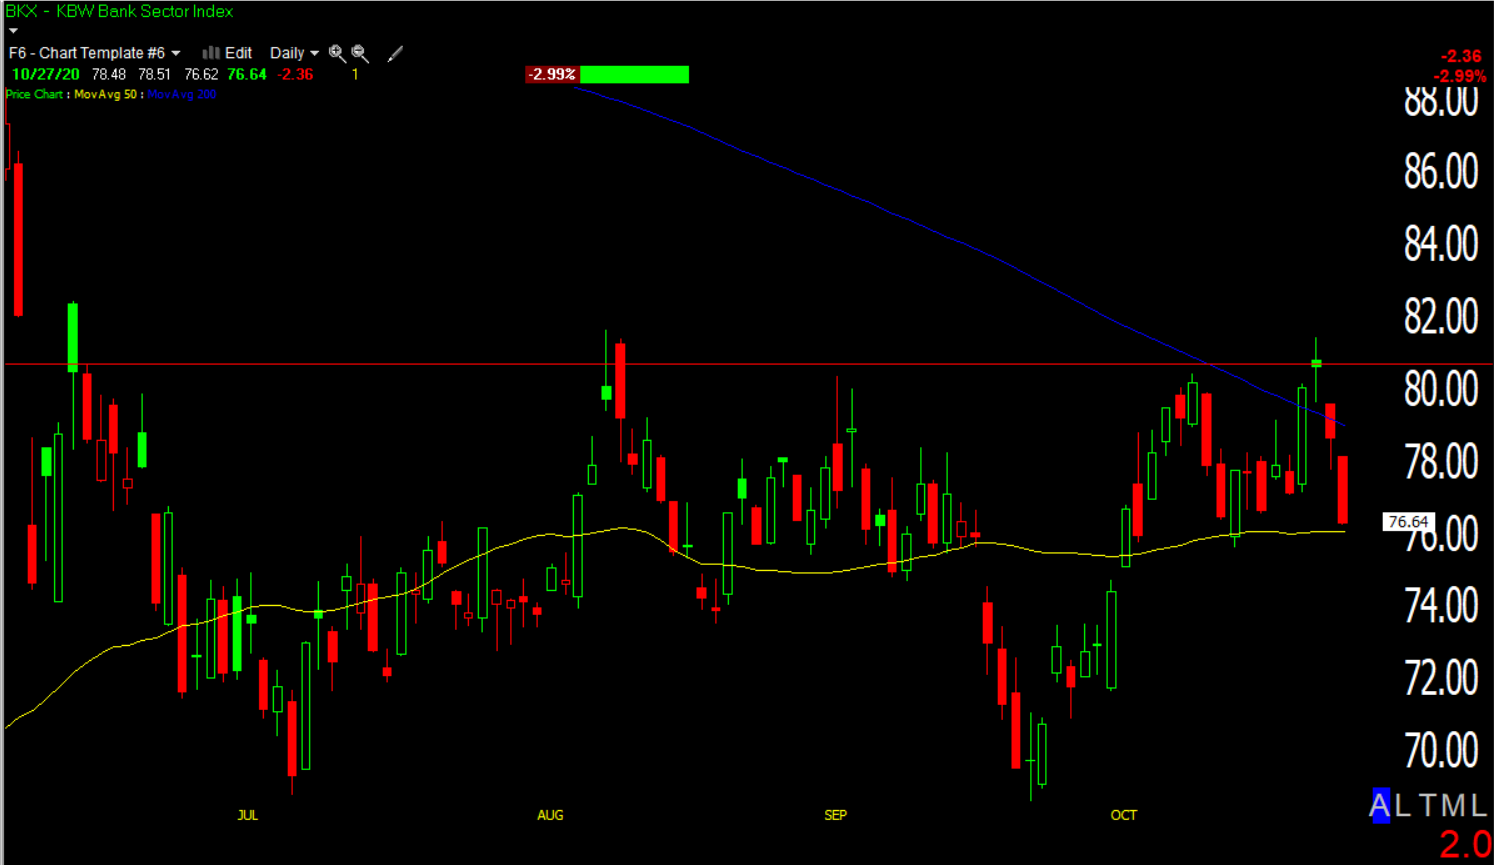 KBW Bank Index (daily) – another failed cyclical/reflation rotation?
Internals
NYSE Decliners (2058) outpaced Advancers (915) by a 2-to-1 margin, but on lighter Volume of 795.7 mln. shares. Yesterday’s heavier volume pointed to the probability of a short-term capitulation day (oversold). Today’s lower volume is typical of a consolidation day and advancers/decliners attest to the bearish bias of the consolidation.
The Dominant price/volume relationship of Close Down/Volume Down is additional evidence of a consolidation day.
Oversold conditions can be worked off through price (a bounce/rally) or time (consolidation). While somewhat improved today, they’re still in oversold territory.
New NYSE 52 week lows ticked up again to the highest since September 25th (one day after the low was put in of the 4 week decline from the September 2nd record high).
NYSE and NASDAQ Composite Advance/Decline lines are lower, suggesting prices follow, whether to a test, or a second leg decline.
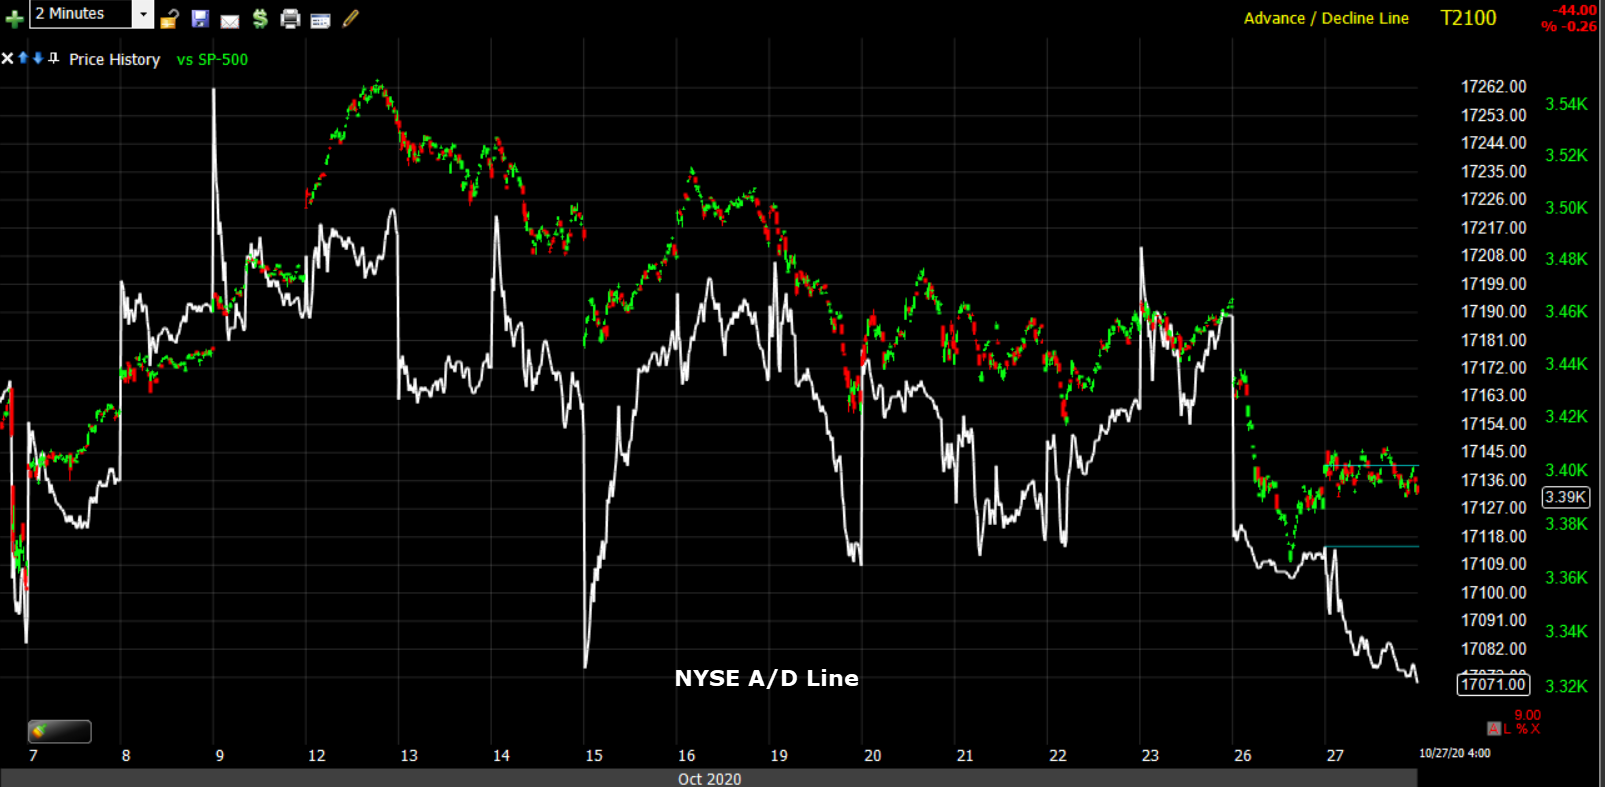 SPX (2m) and NYSE A/D Line
Treasuries
U.S. Treasuries added to recent gains, pushing yields lower across the curve. The 2-year yield declined one basis point to 0.15%, and the 10-year yield declined two basis points to 0.78% in curve flattening trade.
Bond yields are down 3 days in a row with the first hint coming Friday as the S&P tried to break out, but yields didn’t confirm . The yield curve has been flattening over the same period, weighing on banks, cyclicals, and small caps. As a result of the decline in nominal yields, real yields are moving back to netrality with gold (last week real yields suggested an increased risk of gold catching down by about -6%).
Currencies and Commodities
The U.S. Dollar Index decreased -0.1% to 92.96, but came of the session lows into the close, having since retraced the entire day’s loss.
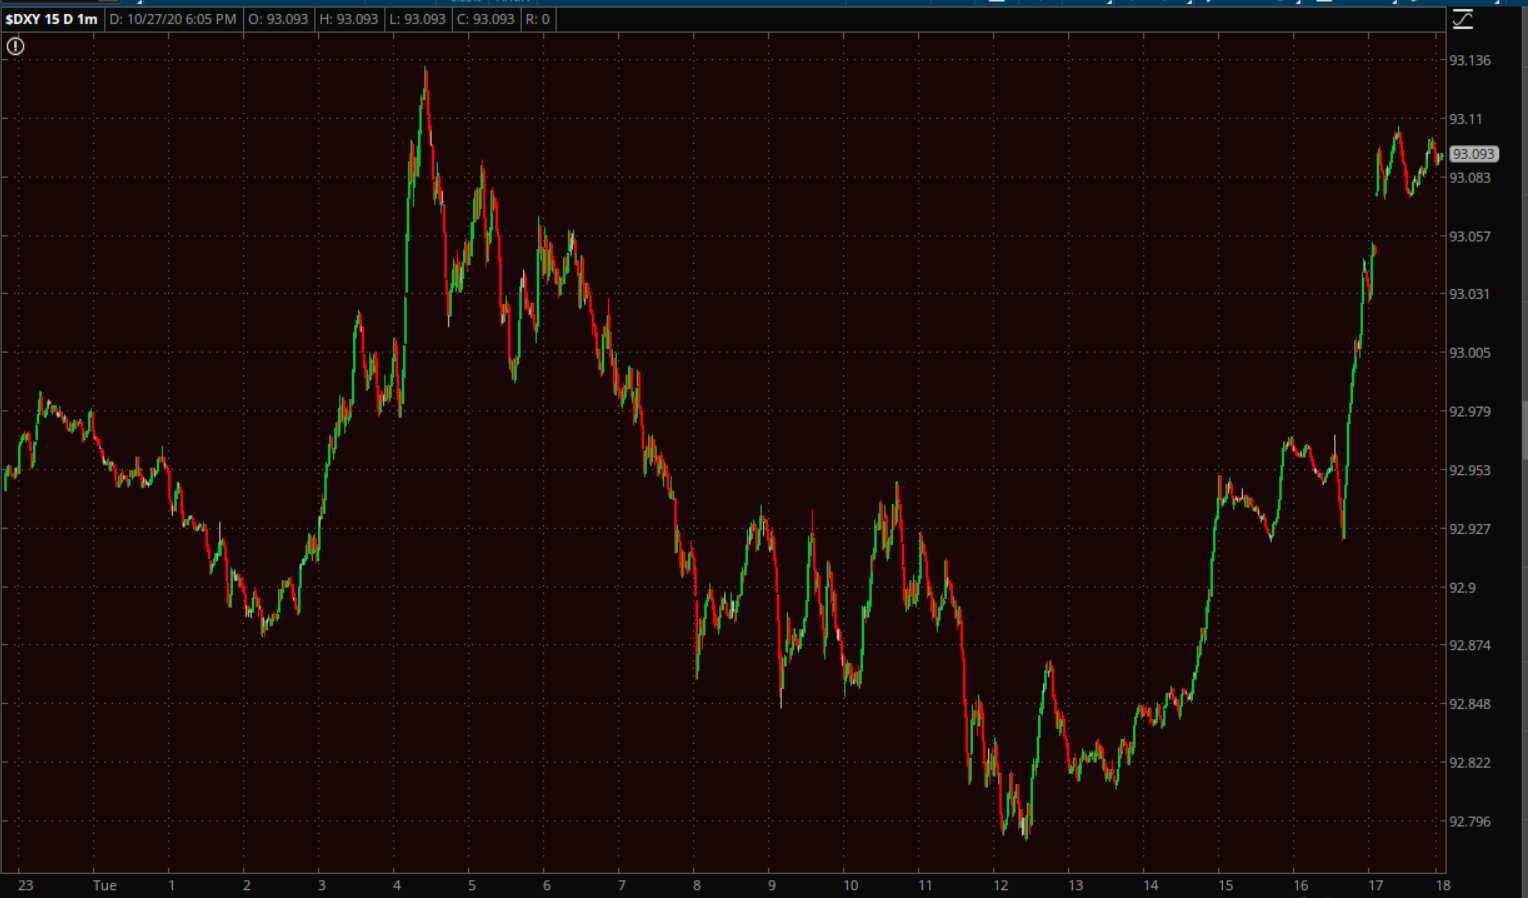 U.S. Dollar Index (1m today)
And the safe-haven Yen was bid again, sending USD/JPY below its bear flag.
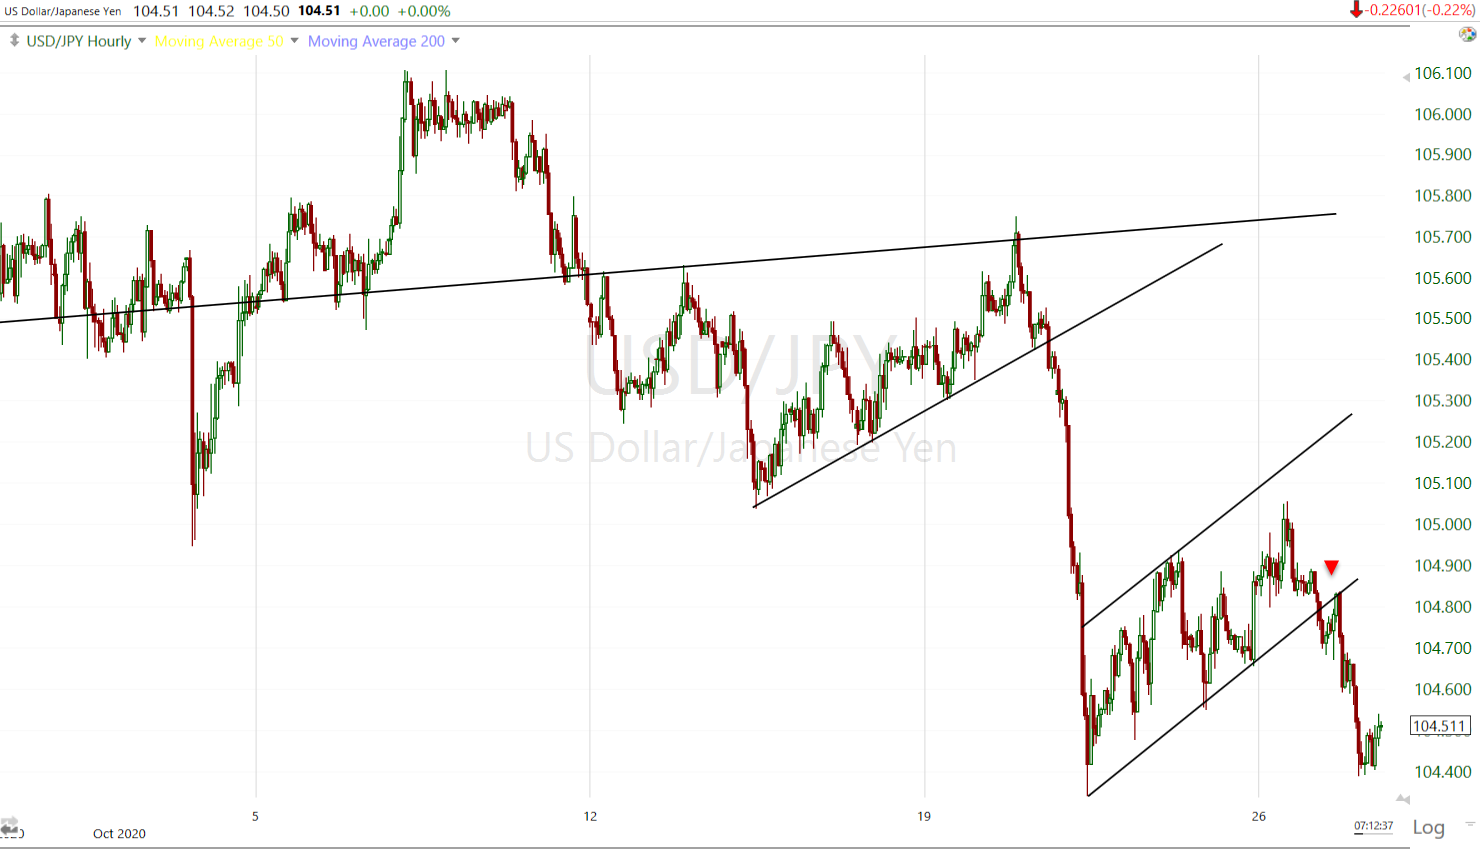 USD/JPY (60m)- Notice after breaking below the flag slowly, it tested the flag from below (red arrow), before plunging more sharply. Such tests are excellent risk-reward entries for traders fast enough to manage the trade. The trend broke, but then gave an excellent entry with a nearby stop, and additional confirmation the trend was broken. I probably don’t need to say it, but I consider this an escalation in risk-off tone, one that’s not suspring as the bear flag pointed to the probability.
WTI crude futures rebounded +2.5% to $39.55/bbl. as U.S. Gulf producers shut production ahead of Tropical Storm Zeta. Much like the concept of backtesting a broken trend, crude did the same.
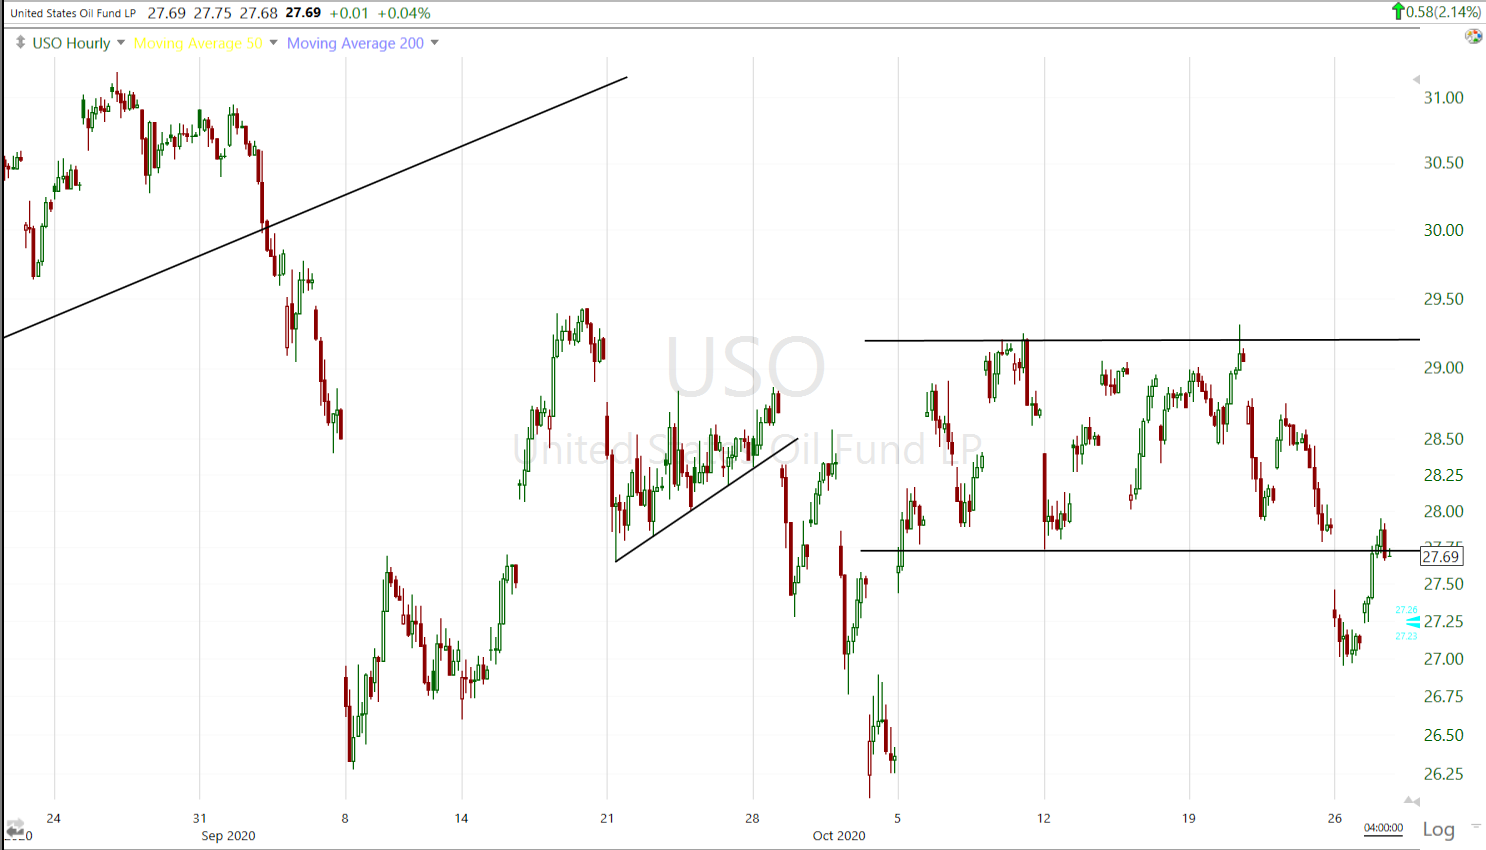
USO (60m) backtesting former support and filling the gap.
Gold futures added a modest +0.3% to $1,911.60/oz after a lower consumer confidence number as well as modest losses in the dollar. As mentioned above, the decline in yields this week is pulling real yields a bit lower and reducing the risk gold catches down to the inverse relationship (last week I estimated that risk to me about 6% lower).
The price action and outlook for gold are unchanged.
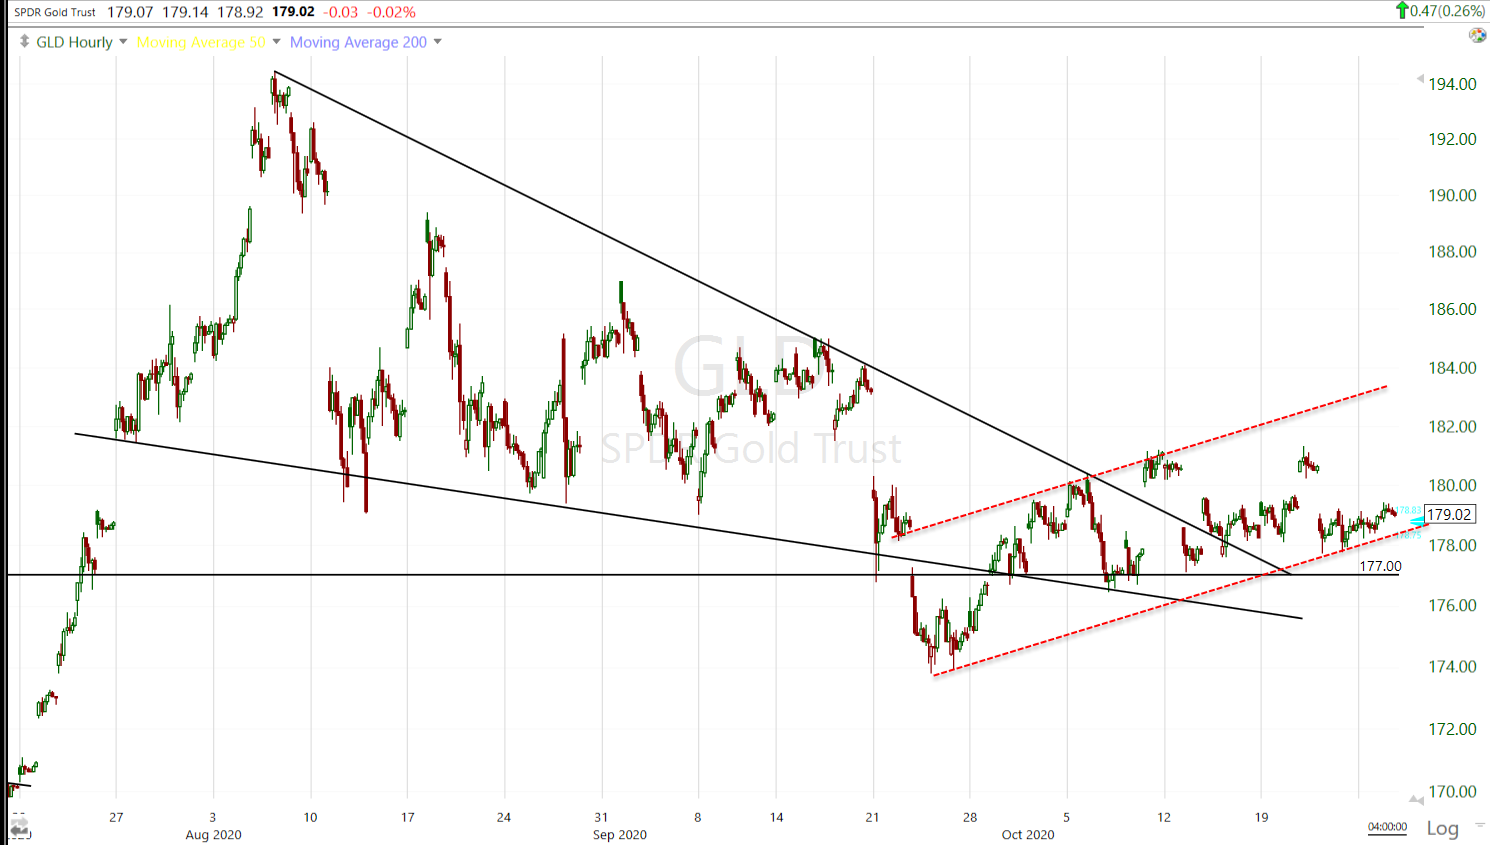
GLD (60m)- a truly bullish consolidation would have broken at by, or before the wedge came to an apex. Since then there has been the shadow of a bearish-like flag (not a true flag). The more yields come down, the better I expect it will be for gold’s near term outlook. The U.S. Dollar is the ther ongoing risk factor, and potentially flight to safety flows.
Bitcoin traded above $13,500 to its highest close since January of 2018, and up over 20% in the last 10 days. GBTC added another +9% today and +28% in two weeks.
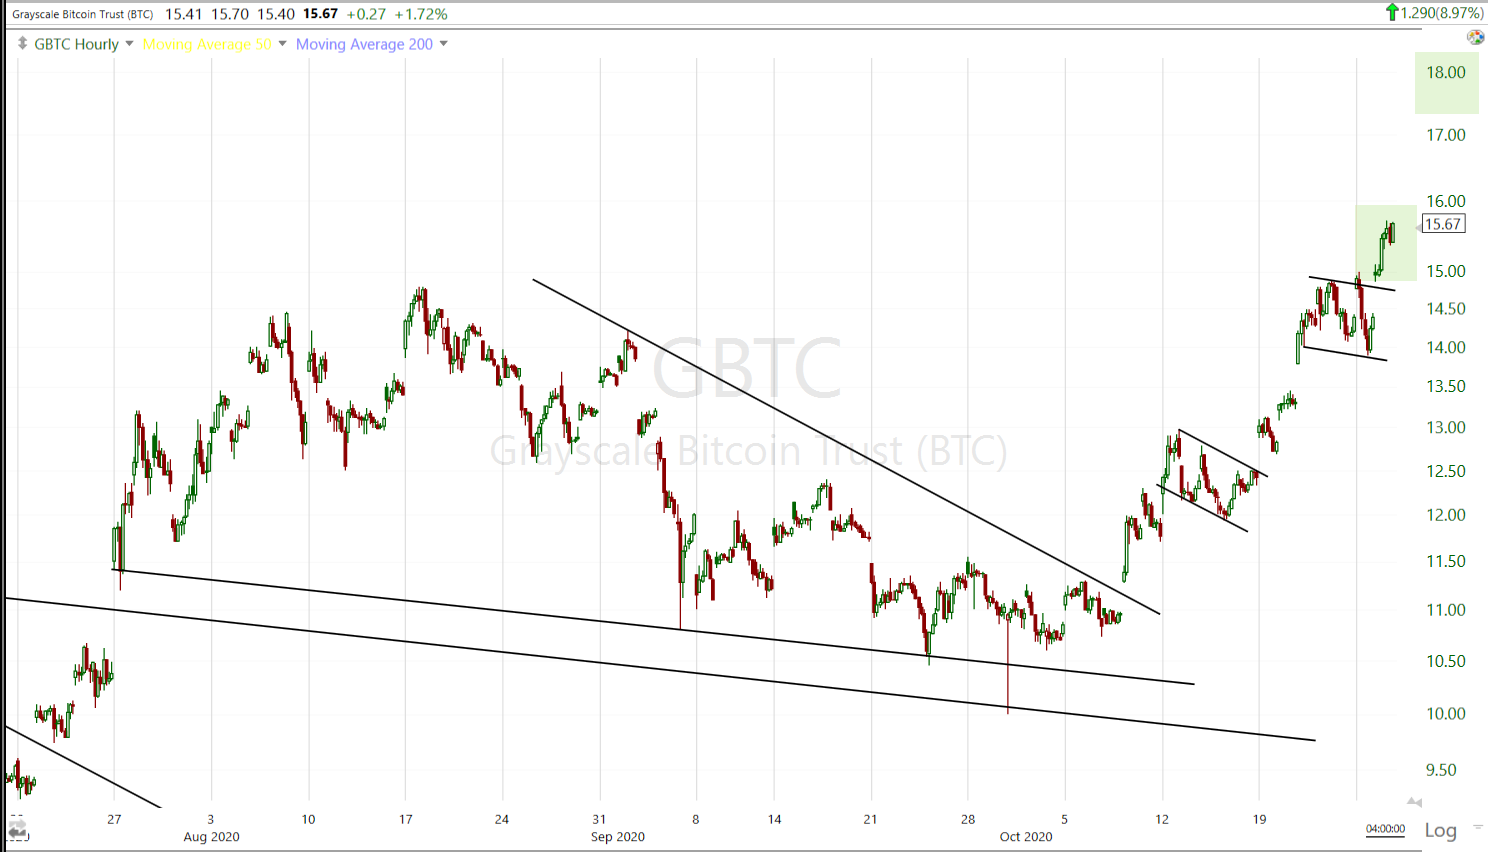 GBTC (60m) another bull flag, another breakout. This is fantastically bullish price action. Rally, rest and consolidate, rally, consolidate…
I updated Bitcoin/GBTC earlier today. The gist is, if BTC takes out supply around $13,900/$14k, there’s a lot of room to run. Patience Pays, at least when there’s a strong edge.
Summary
I’m fond of the phrase that a day is not a trend. When it comes to the reflation rotation, a week, even a month is not a trend, at least not a reliable one. The market has not been able to establish any consistent leadership for the past 2 months. August was the last time there was clear and effective leadership with mega-caps leading, but the rest of the market was falling apart. I can’t say I’m surprised being we’re in earnings season. My expectation weeks ago was that the market would trade choppy from day-to-day, week to week, in a mostly lateral range along the S&P’s 50-day. So far it has been pretty close.
The election is almost here and that’s adding to uncertainty and lack of conviction. Last week the market was pretty certain of a blue wave and a reflationary wave due to increased stimulus hopes, infrastructure spending, etc. This week it seems that was a distant memory. I imagine that back and forth will continue right up to the election, and there’s a not insignificant chance the election is contested. I’ll have to look back to the Bush/Gore election and see if I can glean any insights. It would seem to me that the Dollar could be a major benficiary and as discussed last week, with the massive short position at the long end of Treasuries, they could be set for a massive squeeze too.
That’s to say nothing of a second wave of COVID. Just last week I posted the chart of infections and noted the market was totally ignoring it, a few days later and the market is now increasingly focussed, especially as it relates to Europe. European shares fell to the lowest since May amid concern about the faster spread of the coronavirus on the continent. BREXIT is out there as well with negotiating teams starting intense daily talks, and these are likely to continue as both sides push to finalize a deal by the middle of November.
The CBOE SKEW (Black Swan) Index is surprisingly low at $127, but it has trended higher nearly every day (similar to VVIX) since October 1st from 116.
In the meantime, I think the most significant development today was USD/JPY legging down again and that makes long side market exposure much less attractive. In fact I’d be thankful for a decent bounce to sell with USD/JPY positioned as it is now. The one asset that’s trading with conviction is Bitcoin and I expect we have more to go on the upside.
Overnight
Microsoft blew away earnings after the close, but there’s little reaction (-0.2%) as 3C charts suggested this afternoon. S&P futures are down -0.55% and coming pretty close to testing Monday’s low.
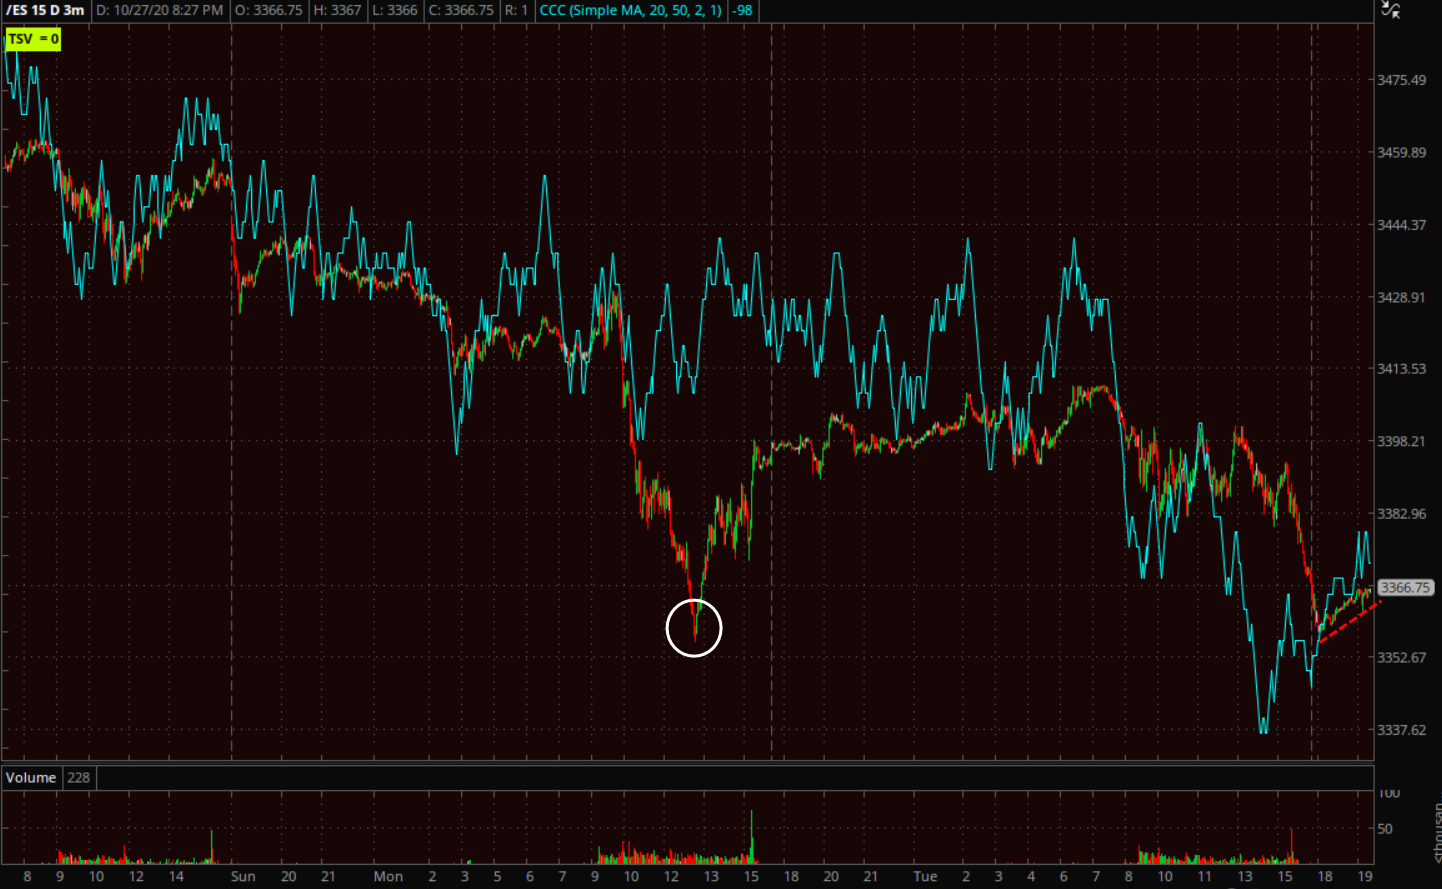 ES (3m) the overnight price action has a small bearish slant (red dashed line). 3C is leading lower.
The U.S. Dollar Index, which surged into the close, is up +0.2%, further pressing index futures.
WTI crude is down -1.7% following a bigger than expected crude inventory build after the close.
Treasury futures on the long end are higher.
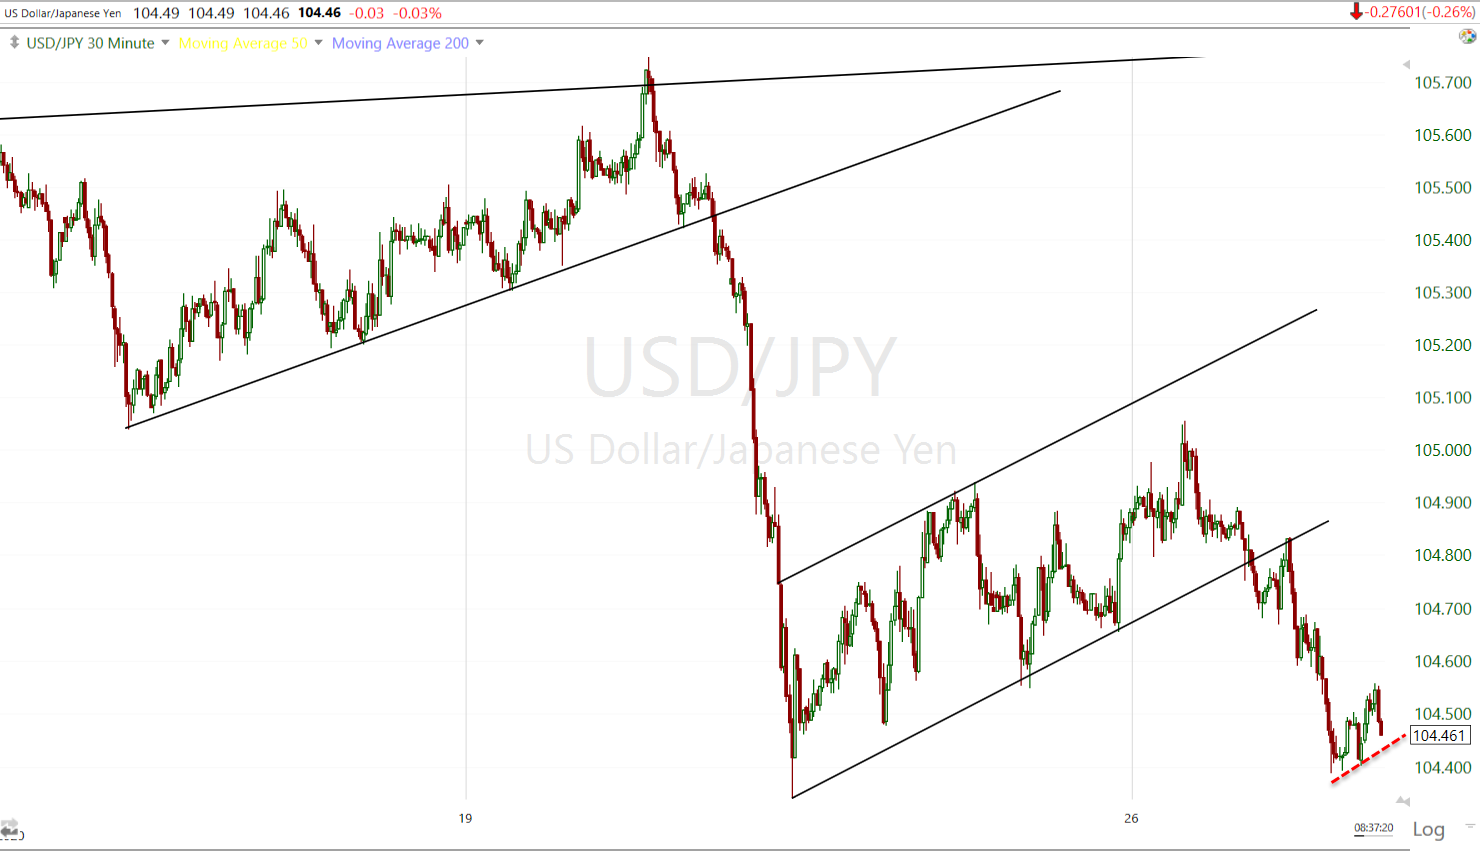 USD/JPY(30m) has a small bearish consolidation (red dashed line) that looks similar to S&P futures and for good reason.
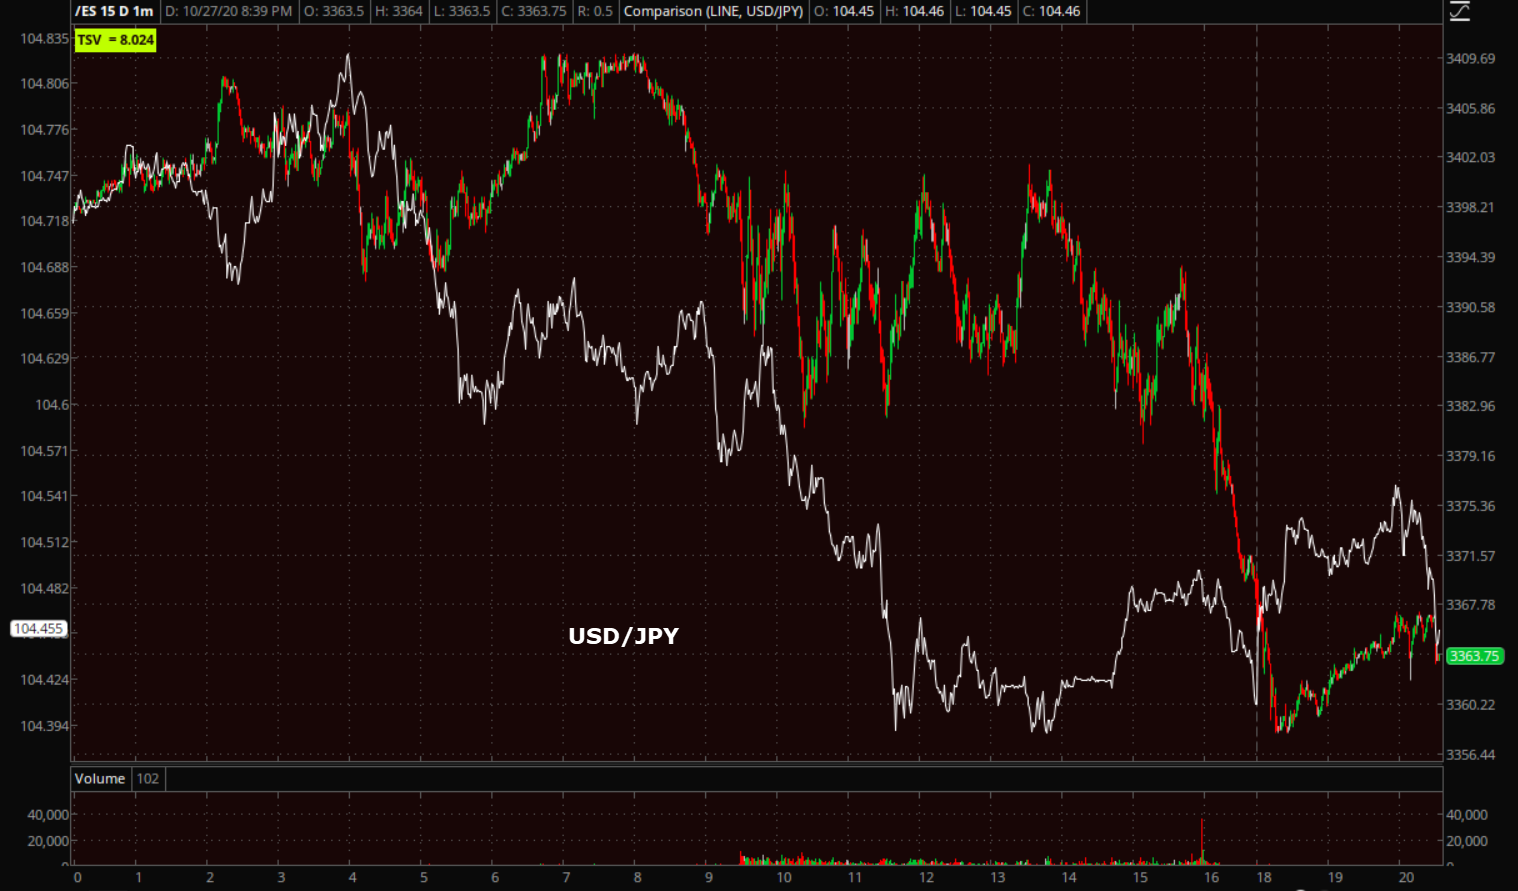 S&P futures (1m) and USD/JPY leading lower.
Investors will receive the weekly MBA Mortgage Applications Index on Wednesday. The Bank of Japan and the European Central Bank have monetary policy decisions Thursday, followed by briefings from Governor Kuroda and President Lagarde. The first reading of U.S. third-quarter GDP Thursday is anticipated to be the strongest on record following a record dive in the prior quarter as many businesses were shuttered by the pandemic.