Stock Market Daily Wrap
The day and earnings season began with JPMorgan Chase (JPM +1.2%), Citigroup (C +1.6%), and Delta Air Lines (DAL +3.3%) coming in with better-than-expected earnings results, while Wells Fargo (WFC -5.4%) missed top and bottom-line estimates due to higher expenses. The results contributed to noticeable price changes in the stocks and some sectors, but the price action in the broader market was relatively tight-ranged. At its high, the S&P 500 was up just +0.2%.
The Dow showed relative strength related to company specific earnings and news. Just after noon risk sentiment started to build while volatility came under sell-side pressure. High-beta and growth sensitive sub-sectors like Semiconductors, started advancing. That advance hit a brick wall and VIX jumped 14% instantly as Bloomberg reported that existing tariffs on Chinese imports will remain for at least ten months. I have to wonder whether Treasury Secretary Steve Mnuchin – who runs an undisclosed investment fund out of the Cayman Islands and is a principle in trade talks – and some of his buddies may have known this. That could explain why deep out of the money puts were bought sending SKEW rocketing higher. Remember the move up in SKEW started the day that the trade deal was once again claimed to be done in mid-December. Furthermore, the high reading SKEW signal (or hedges) is in effect for a month afterward.
From a sector standpoint, the S&P 500 Technology (-0.6%) and Real Estate (-0.5%) sectors were today’s laggards. Interestingly it was the large-cap Tech FAANG stocks that showed signs of buyer exhaustion Monday. Amazon was the specific FANG posted yesterday.
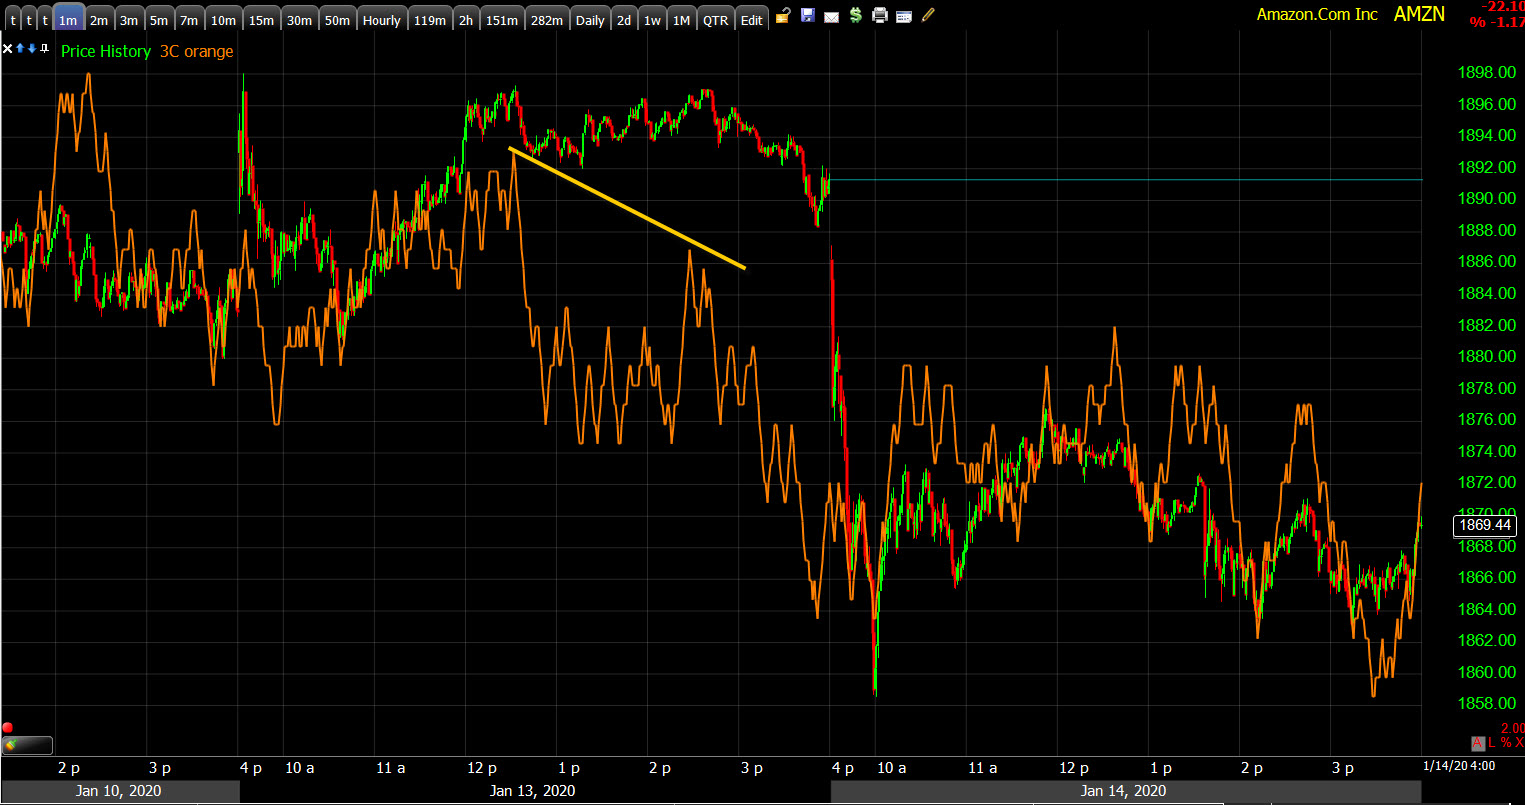
AMZN (1m) 3C negatively diverging from price yesterday as Amazon was at session highs.
AMZN (-1.15%) declined as much as -1.7% on the open this morning. The other heavily weighted FANGs were laggards the entire day with Amazon, Facebook and Apple all losing more than 1%. Generally speaking, the group doesn’t look any better today and some look even worse.
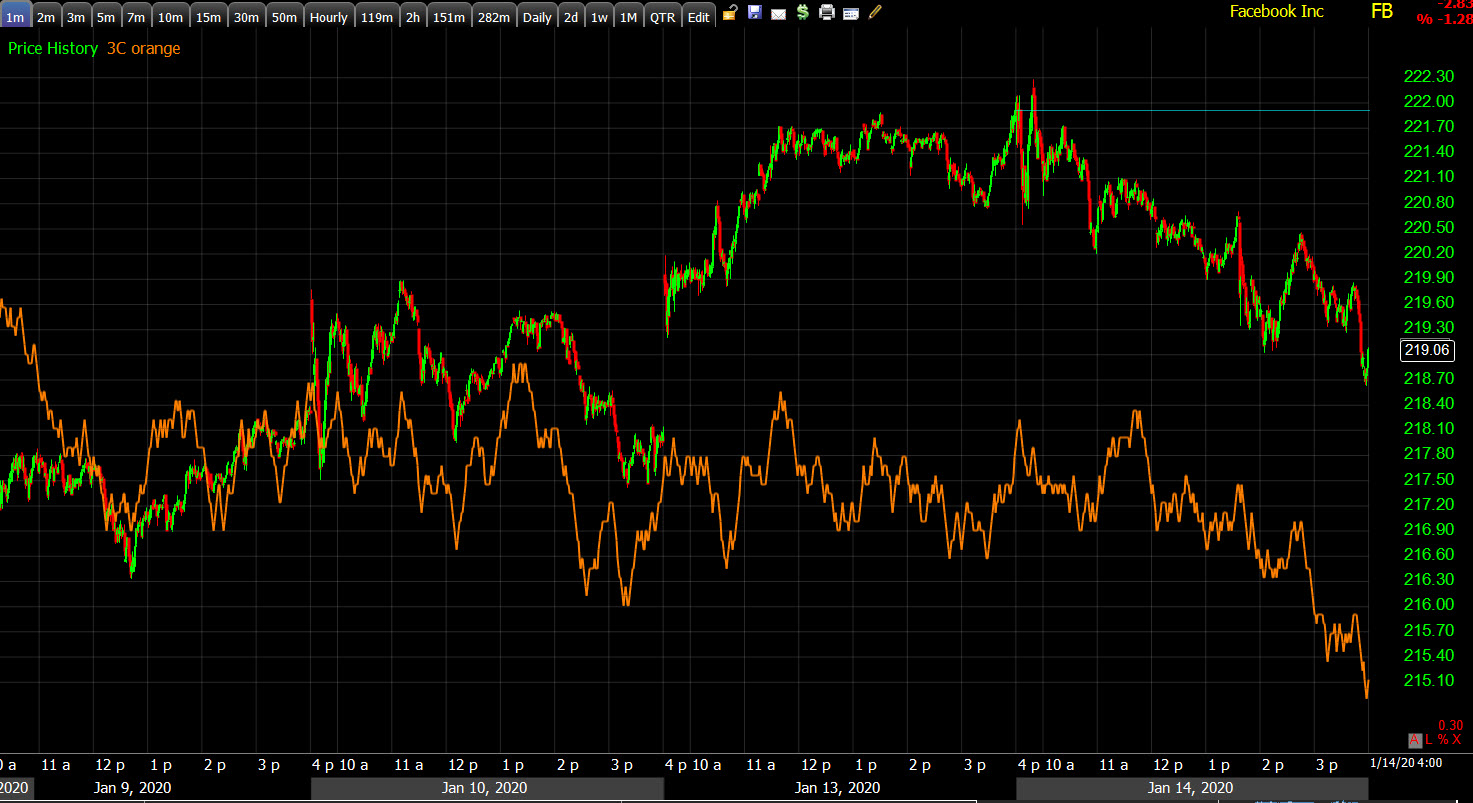
Facebook/FB (1m) negatively diverging yesterday and leading lower today.
Today’s key economic report was inflation or CPI. Total CPI was up 0.2% m/m, as expected, while core CPI, which excludes food and energy, was up a softer-than-expected 0.1% (consensus +0.2%). The reading won’t cause any immediate re-think of the Fed’s policy position. The inflation rate isn’t running away from the Fed, which has adopted a willingness to let inflation run above its longer-run goal for a bit before moving on rates. The CPI data takes a backseat to the PCE price data as the Fed’s preferred inflation gauge, and the latest report showed core-PCE inflation up just 1.6% yr/yr.
The NFIB Small Business Optimism Index declined to 102.7 from 104.7.
Averages
NASDAQ-100 showed relative weakness and Small Caps showed relative strength. The trend since the start of 2020 has been the exact opposite. I’m not sure what to make of it yet, a day is not a trend. Dow performed got a boost from earnings issues and from news. A recent study indicated that Dow component Walt Disney’s (DIS +0.9%) streaming app may have been downloaded more than 40 million times.
S&P 500 ⇩ -0.16 %
NASDAQ ⇩ -0.41 %
DOW JONES ⇧ 0.11 %
RUSSELL 2000 ⇧ 0.37 %
S&P sectors
Early S&P sector action was mixed with no apparent bias outside of earnings movers. In the early afternoon a risk-on bias developed, and by the close cyclical sectors Materials and Technology were the worst performing. Real Estate was a laggard all day, but came off its lows with Utilities in what looked like a more defensive posture heading into the close. The Financial sector had shown relative strength most of the day sitting just under a 3 week consolidation’s resistance, but then faded in the afternoon to close to end red as risk sentiment waned and yield curves flattened more.
Materials ⇩ -0.41 %
Energy ⇧ 0.02 %
Financials ⇩ -0.19 %
Industrial ⇧ 0.01 %
Technology ⇩ -0.47 %
Consumer Staples ⇧ 0.03 %
Utilities ⇧ 0.29 %
Health Care ⇧ 0.61 %
Consumer Discretionary ⇩ -0.03 %
Real Estate ⇩ -0.49 %
Communications ⇩ -0.25 %
Dow Transports +0.9% outperformed after Delta Air Lines +3.3% reported earnings. Biotechs (S&P +2.9%, NASDAQ +1.6%) also outperformed and retraced most of the last 2 days’ decline and boosted the Health Care sector. The Retail sector +0.6% was another bright spot.
Internals
NYSE Advancers (1655) still beat out Decliners (1227) as small caps outperformed. Volume was on the heavier side at 915.9 mln. shares.
There is no Dominant price/volume relationship today.
VIX declined from shortly after the open. Just after noon time evidence of sellers became apparent on 3C charts and that coincided with the more aggressive buying in high-beta and small caps before the tariffs news. VIX jumped more than 14% in seconds as the news hit the wire.
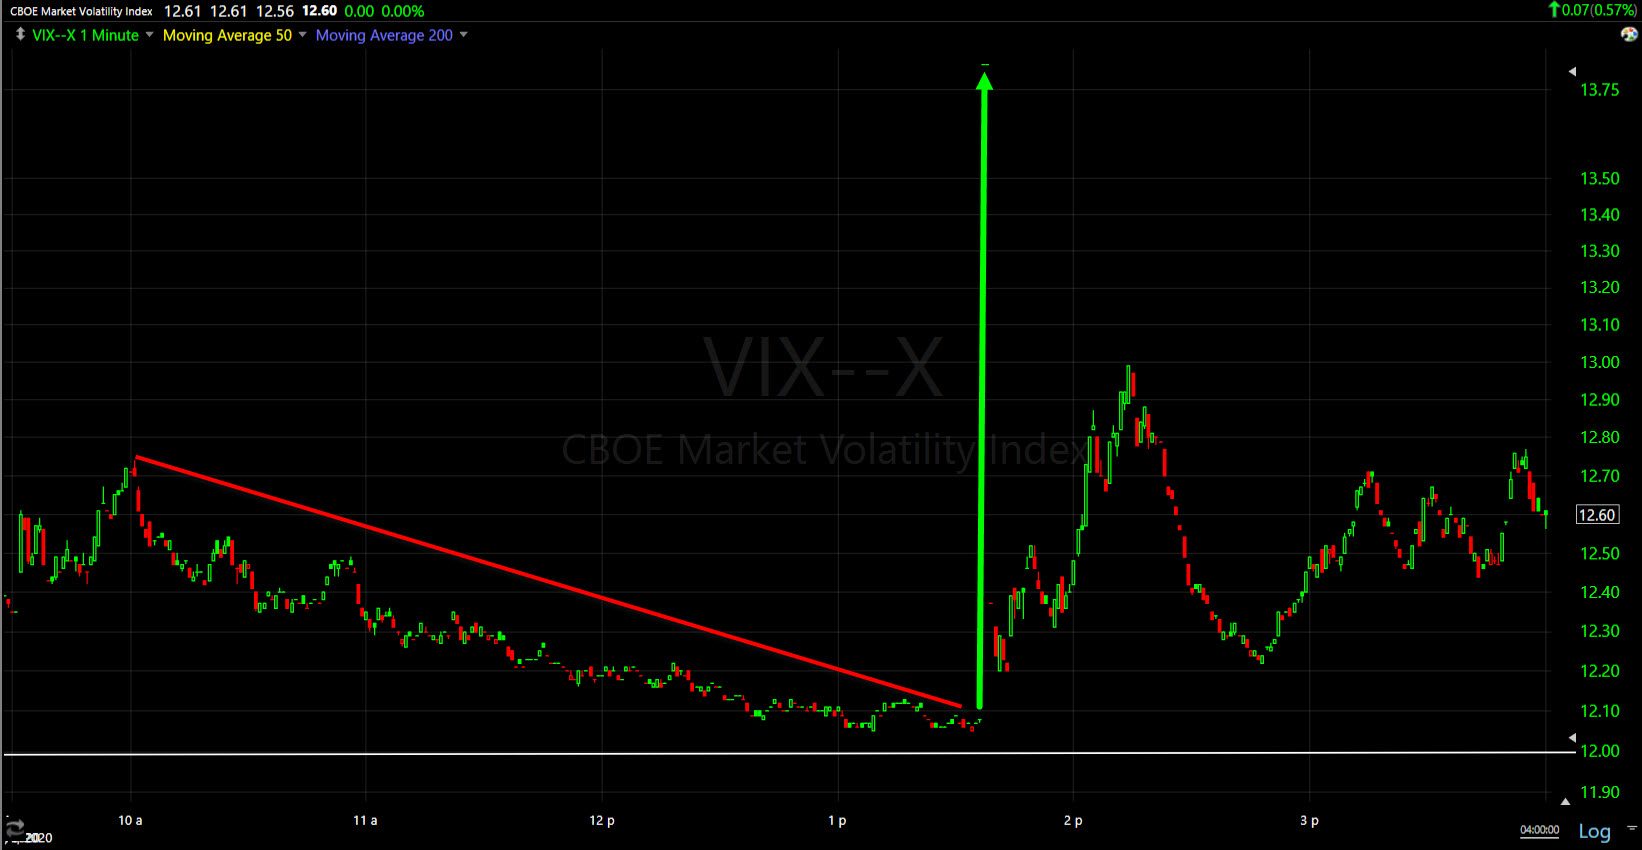
VIX (1m today) down from 10 a.m. That spike is not bad data, I saw it as it happened and assumed the same at first, but I also expected it would settle down.
I still like the long volatility idea with the Absolute Breadth Index having printed an extreme low.
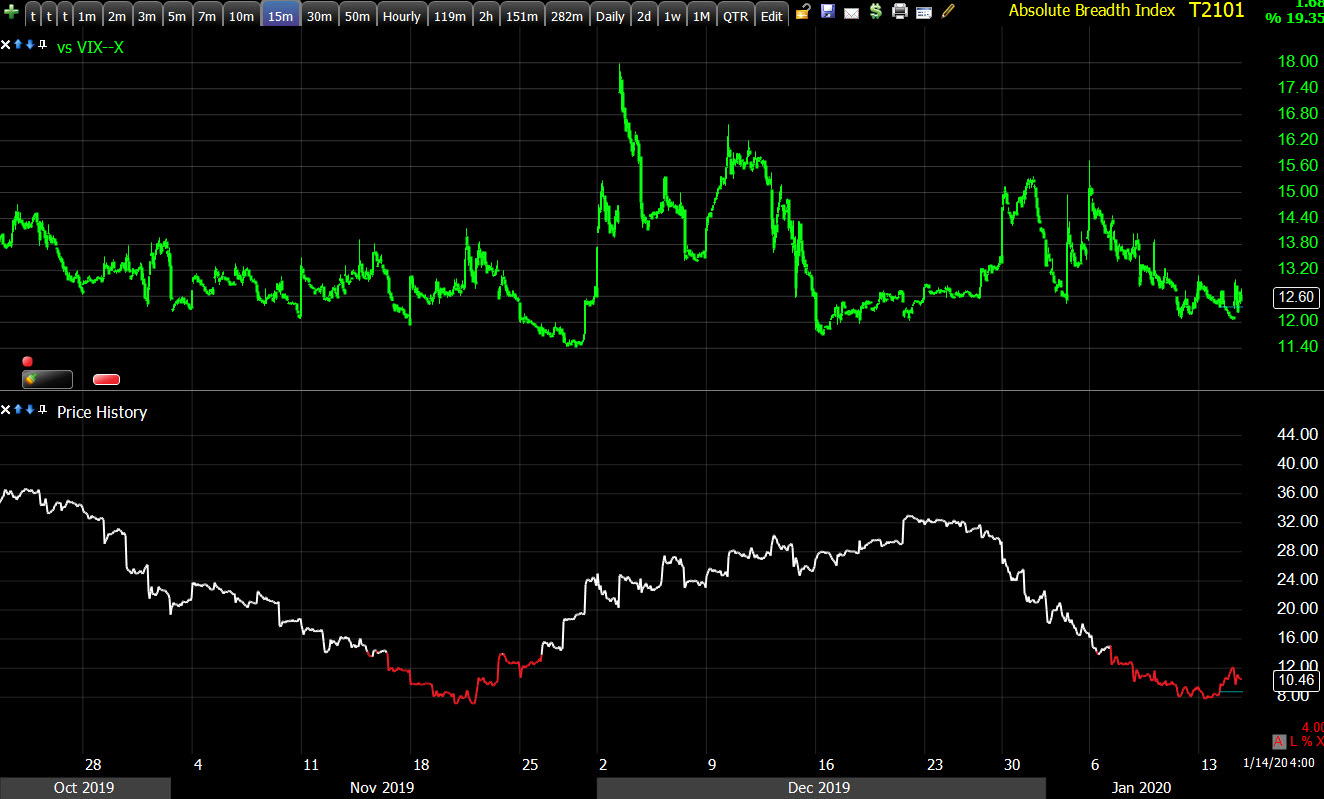 VIX index (green 15m) and Absolute Breadth Index with readings below 14 in red depict market conditions that precede double digit moves in volatility, usually 2-4 weeks out. The last time I mentioned ABI at an extreme 2 year low was November 30th, VIX gained more than 25% in two days.
Another factor that figured into my decision to buy volatility (long) exposure Friday is a trend of support for VIX nearby. You can see it around $12 on the 1 min chart above.
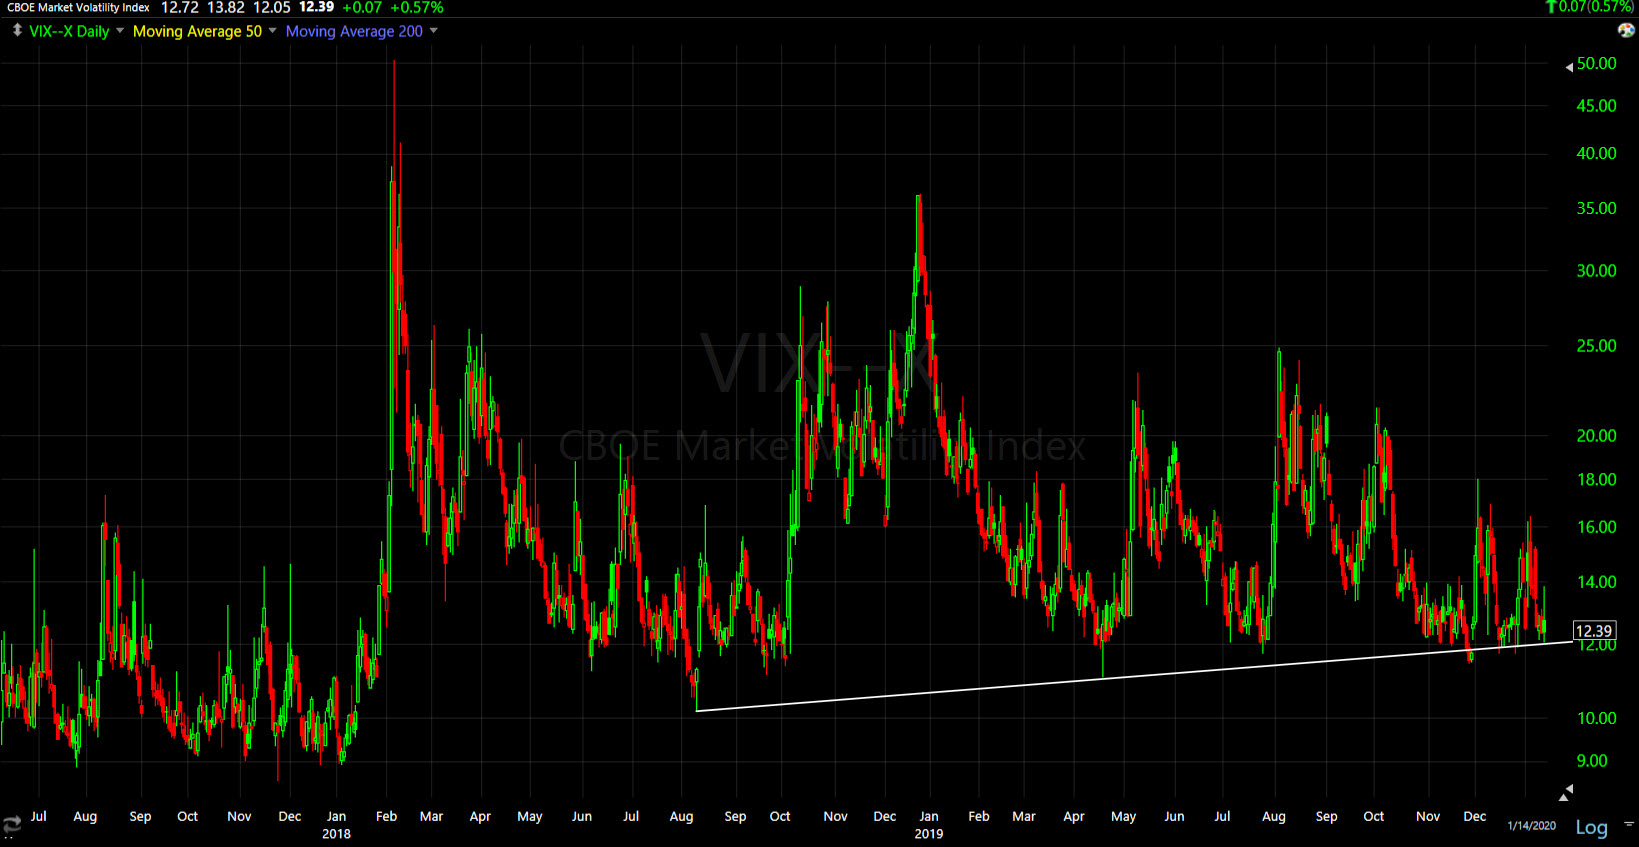 VIX (daily) has a support trend right at the $12 area from August of 2018. The trend of relative strength (VIX making higher lows as the S&P makes higher highs) reaches back to the start of 2018. The last time this happened was 2007 heading into the S&P’s top and Financial crisis. Unlike then, the Fed was not engaged in quantitative easing/balance sheet expansion, which typically has the effect of suppressing volatility. That’s the main risk I see to the trend of relative strength (higher lows rather than lower low which would be normal). I made my decision with what I know now.
Treasuries
U.S. Treasuries finished mostly higher. The 2-year yield was unchanged at 1.58%, and the 10-year yield declined three basis points to 1.82% in curve flattening trade. The curve flattening was modest the first half of the day, but increased this afternoon and Financials lost their gains for the day. While the flattening today was not extreme, when added to last week’s flattening, the curve is the flattest in almost a month.
Currencies and Commodities
The U.S. Dollar Index finished flat at 97.38, in a flat range for the fourth day.
WTI crude increased +0.3% to $58.30/bbl. If WTI Crude can get above $59, it would reduce the probabilities of completing the second leg lower (another 5% down). In that scenario, I would expect the former broadening formation trend line at $61 to $61.50 to become resistance.
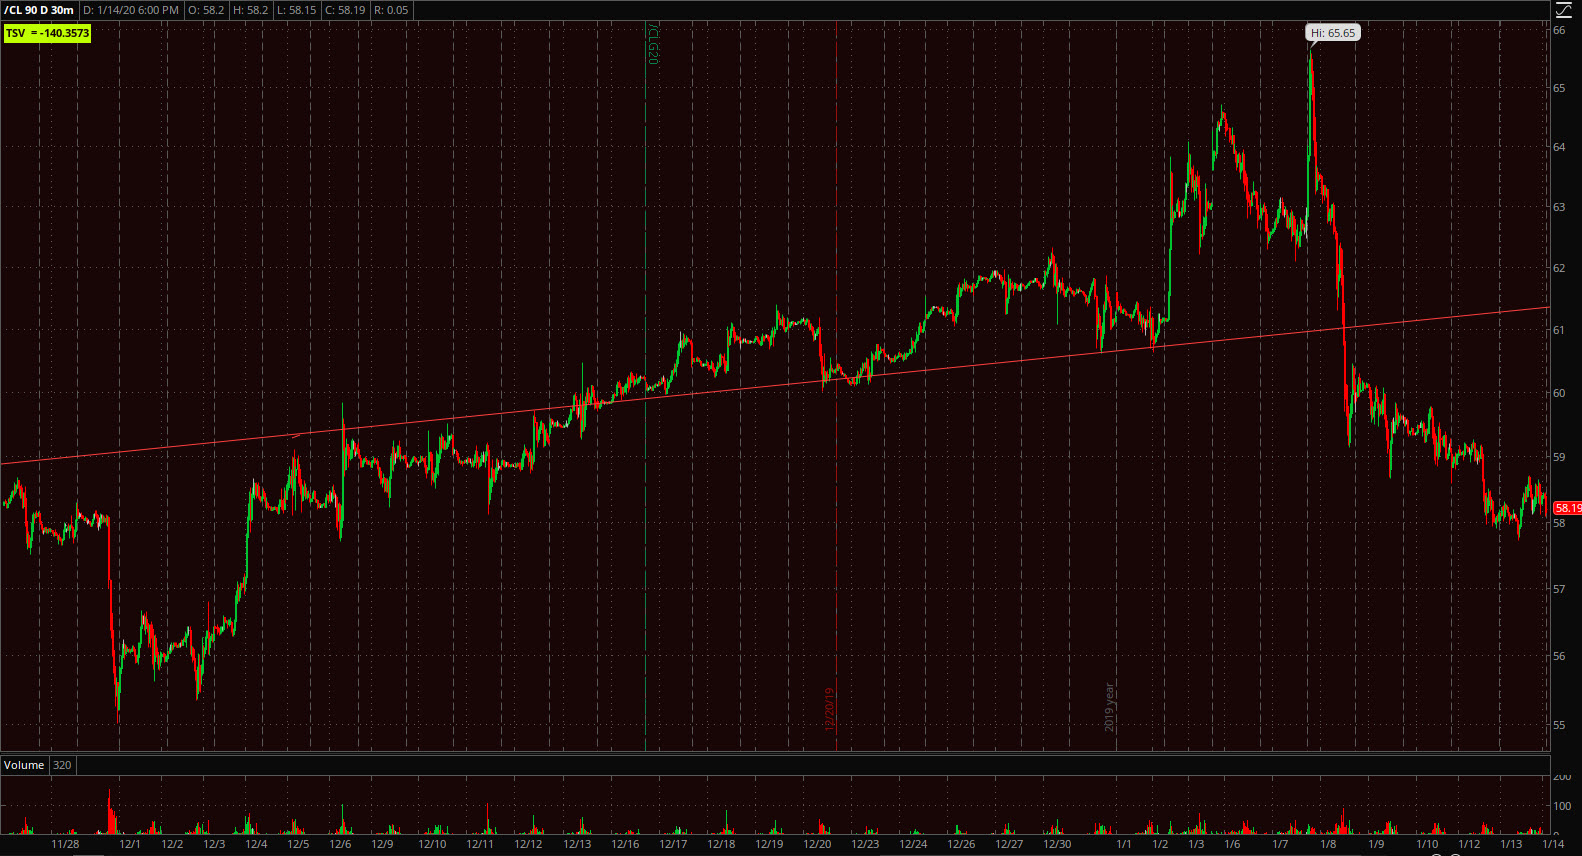 WTI Crude oil (30m) trend line near $61-$61.50
I think gold is acting fine for a correction so far. Last week gold was stretched, up something like 10-days in a row. Gold futures did hit my measured move target. A couple of days ago I mentioned that Gold’s pull back looked like it may be a bull flag, I think that’s still a reasonable assumption at this point.
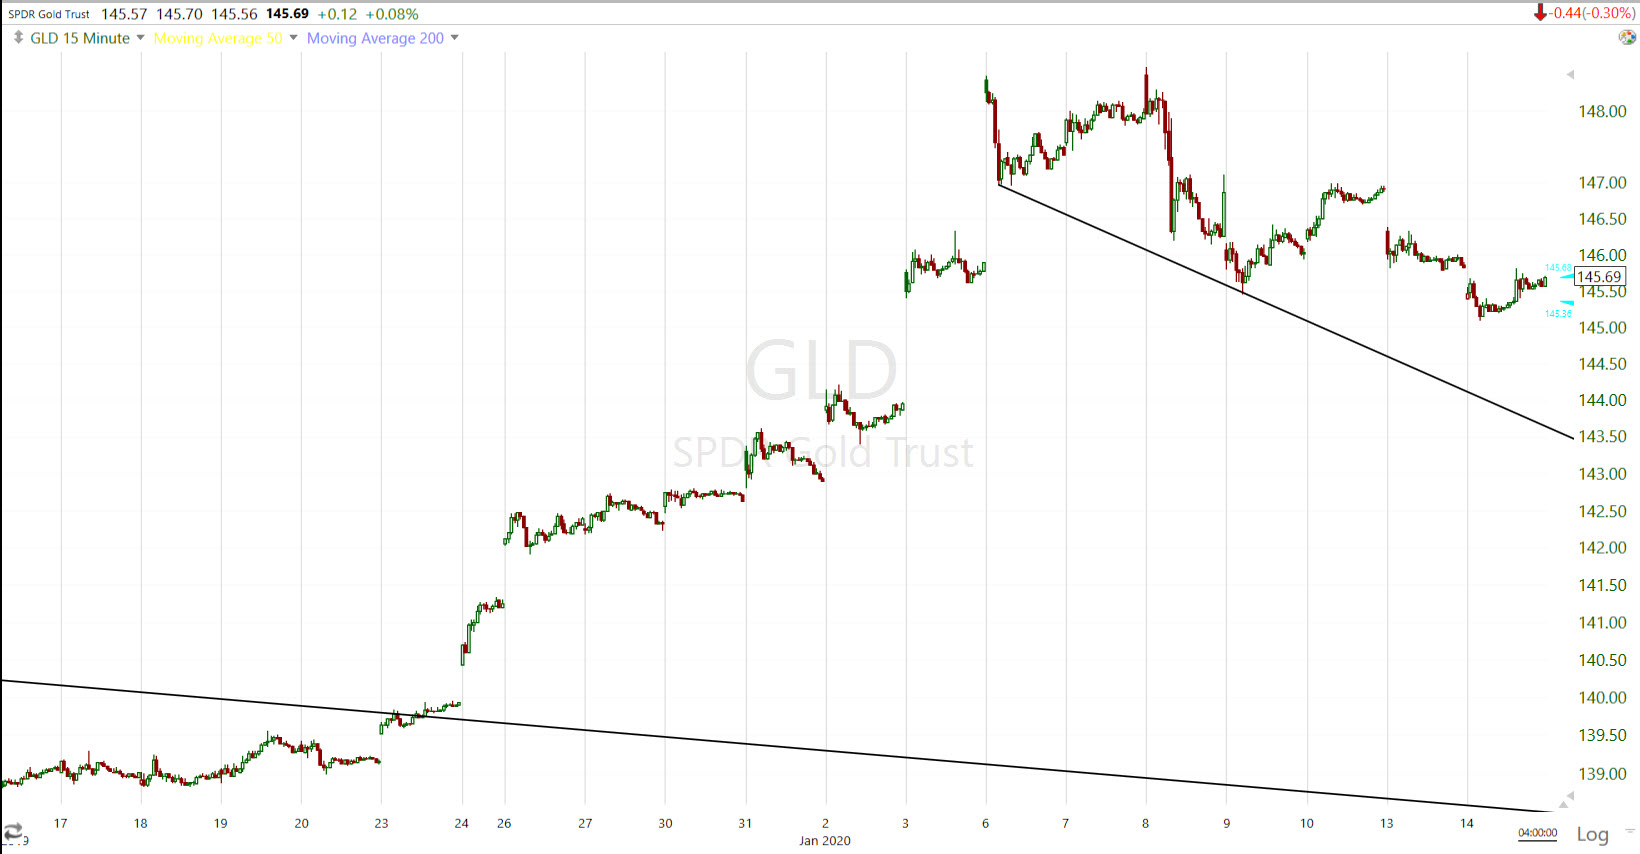 GLD (15m) the trend lines and consolidation may change, but so long as GLD holds above the trend line currently at $143.50, it is constructive in my view and taking on the shape and characteristics of a bullish consolidation (declining volume).
Summary
It is earnings season and the market has high expectations, at least for guidance to reassure investors that the economic and earnings turnaround that has been priced in as of Q4 2019, sees follow through in the earnings. The Q4 2019 trade deal optimism and multiple expansion rally came almost immediately after peak recession fears in August. Quite a swing in sentiment in a short time. With earning season here, investors expect to see the rubber meet the road.
The liquidity fueled (Fed) Q4 rally that started with trade optimism, was not based on the data getting better, or at least not convincingly better, it was based on expectations it will get better. Stocks are historically very expensive as they have gained on all “P” and no “E” — multiple expansion.
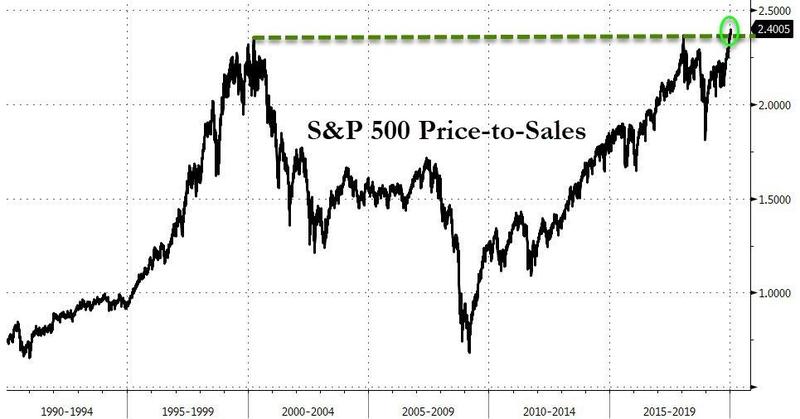
There are dozens of ways to measure valuations and most are either at their highest in a decade or more, or highest ever. For instance, the S&P’s Price-to-Sales is at the highest ever and that says something considering the 1999 to early 2000 Tech bubble valuations.
The S&P’s PEG Ratio is at a record high, and the S&P 500 is trading at 18.5x forward twelve-month earnings. This is a 24% premium to the 10-year average, according to data from FactSet.
Overnight
S&P futures are currently down -0.2% in the early overnight session. There’s some damage on the 3C charts from Friday, despite Monday’s bounce back and the brief risk-on episode this afternoon.
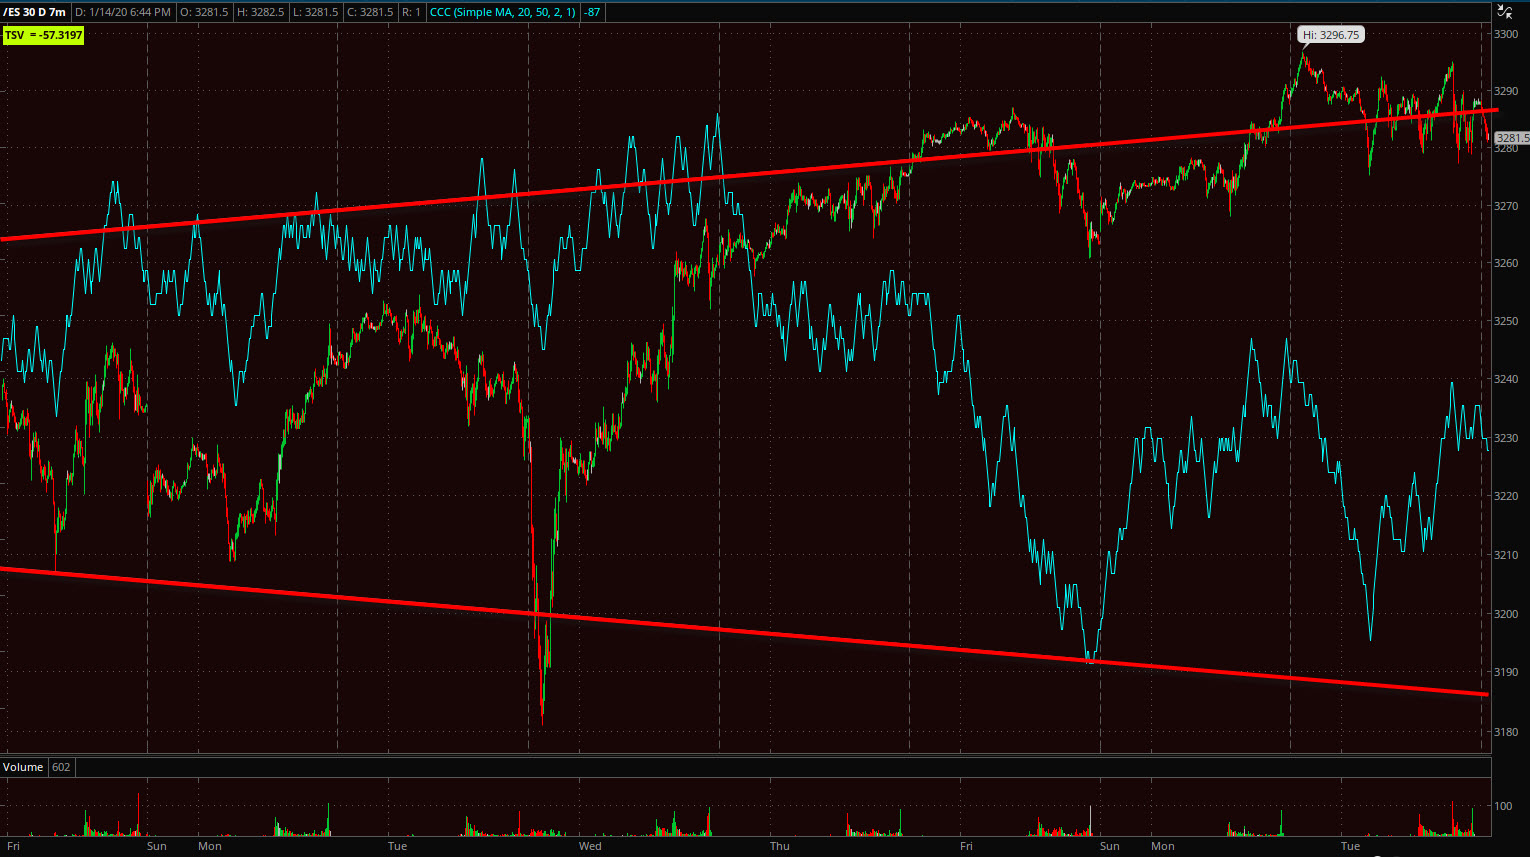
S&P futures (7m) this is the broadening formation from last week and the week before. 3C started moving lower heading into Friday. $3275, $3270 and $3260 look like they’ll be tested sooner than later.
Russell 2000 futures are showing some early and modest relative weakness -0.3%. In the Afternoon Update I mentioned that gold and Treasury futures’ 3C charts were firming up, and volatility to a lesser extent. It’s too early to say whether the sell-side efforts in VIX futures are over or not. The 3C chart has not normalized yet. Gold futures are up +0.3% tonight, while copper futures are down -0.4%. Futures are looking more risky tonight than they have this week.
Tomorrow’s economic data includes the Producer Price Index for December, the Empire State Manufacturing Survey for January, the Fed’s Beige Book, and the weekly MBA Mortgage Applications Index on Wednesday.