Stock Market Daily Wrap
The Deja Vu continues at the same level for the same reasons, euphoria over vaccine news, and with the same lack of follow through.
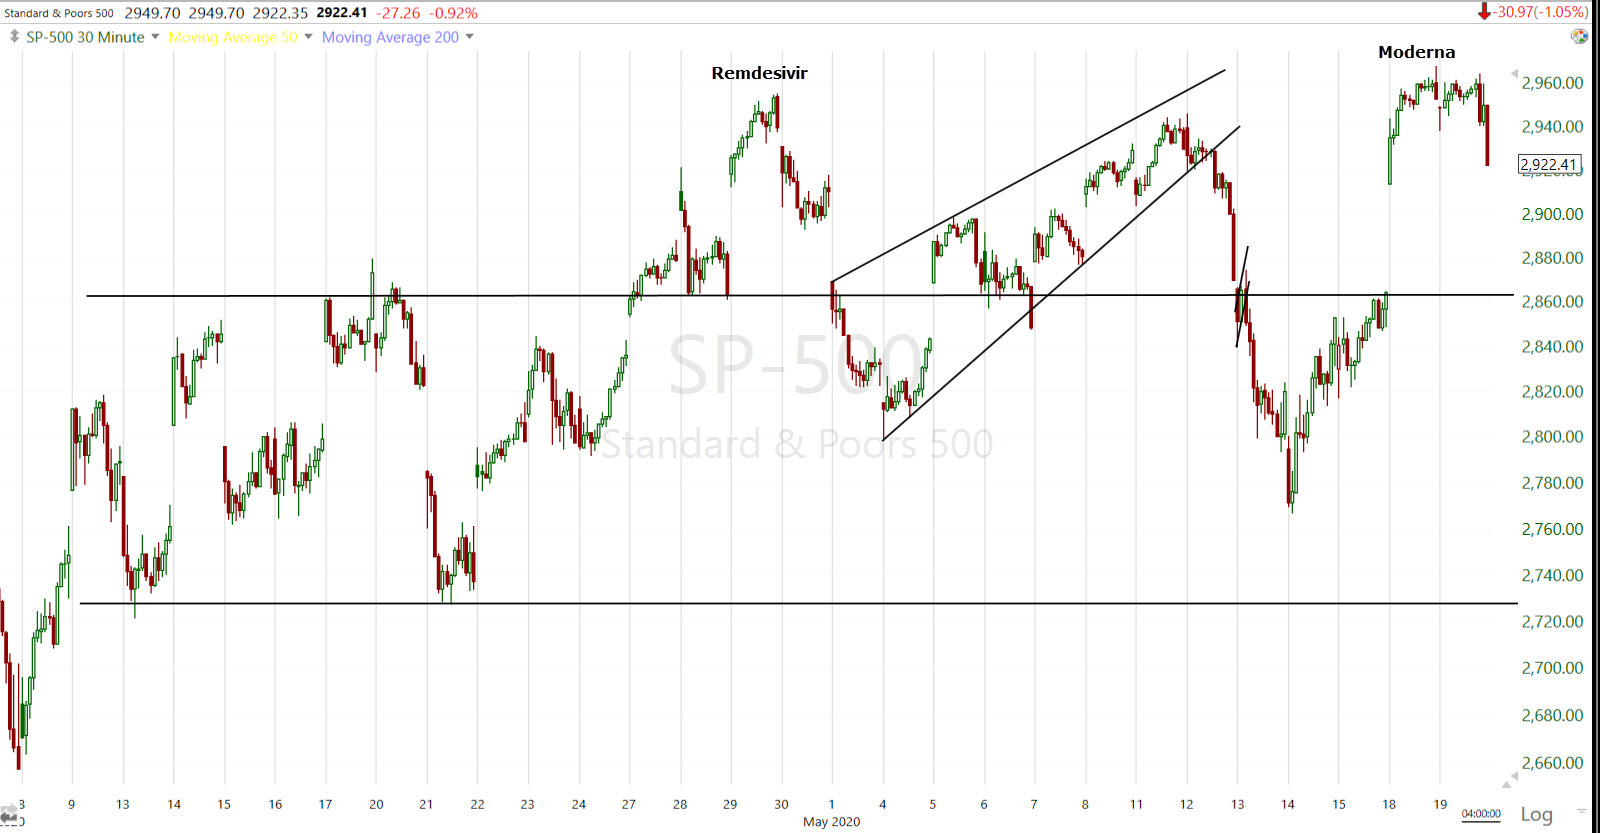
SP-500 (30m) last time we were here was due to news about Gilead’s Remdesivir, which was positive news, but far from a game-changer.
 SP-500 (30m) since the Fed’s last stimulus program on April 9th, the S&P has traded in a lateral range for 5 weeks. It’s not that surprising given we were also headed into earnings season, but there are more signs that the market has lost a cohesive narrative to further gains and trade is getting more emotional and chaotic. Prices found resistance for a third time at the 5/8th or 61.8 Fib retracement of the 2020 crash. The 50% level has provided support at least 3 times.
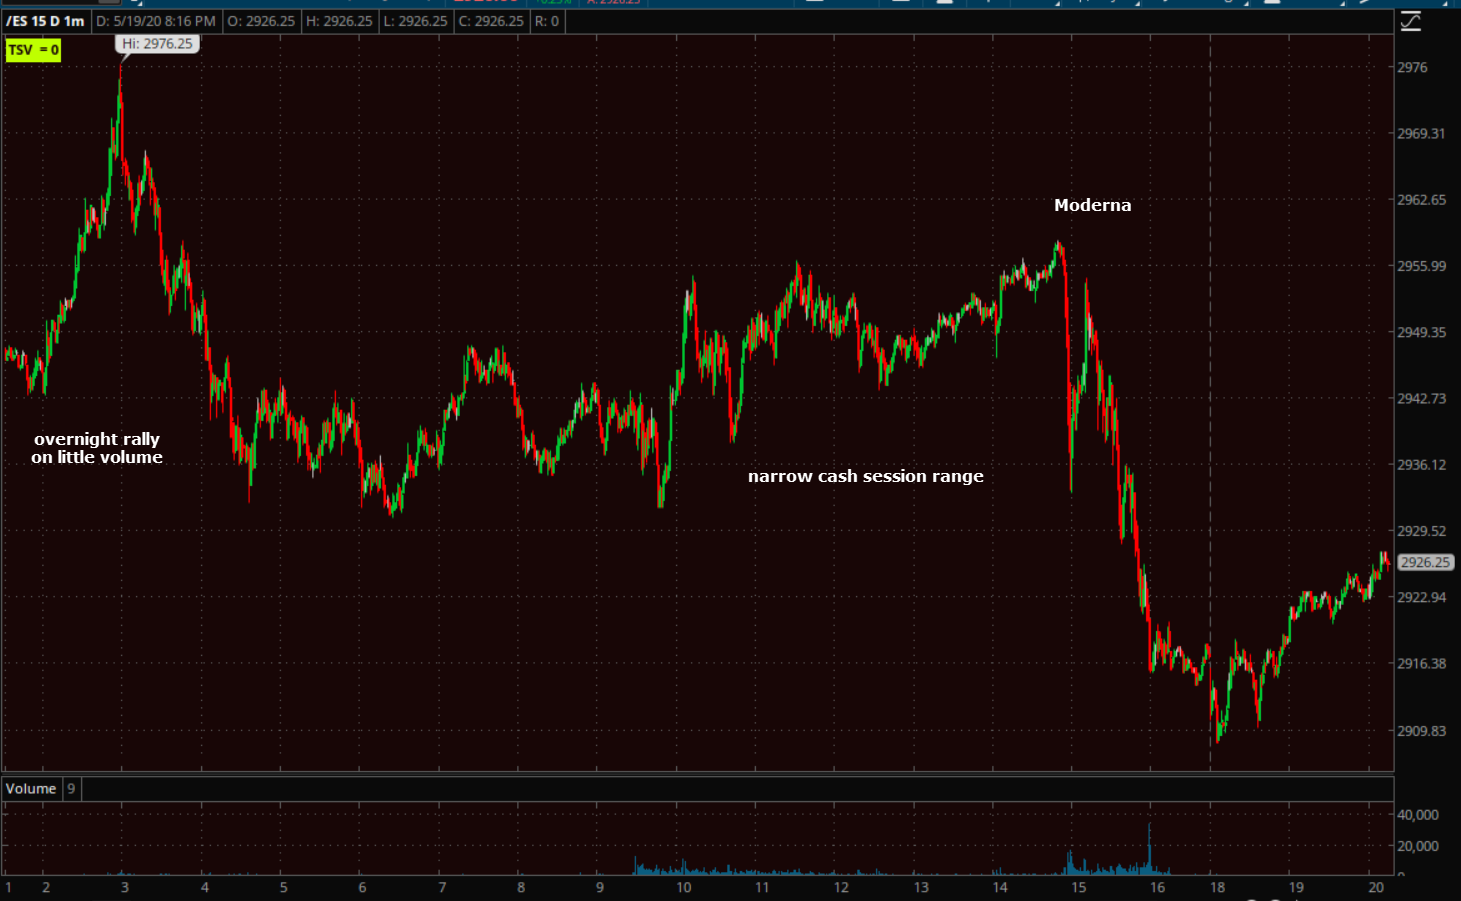
Yesterday’s strong rally was driven by news that Moderna’s (MRNA -10.5%) Covid-19 vaccine candidate — the frontrunner in the American market — seemed to be generating an immune response in Phase 1 trial subjects.
Commenting on yesterday’s market action, Morgan Stanley’s prime brokerage desk wrote today that yesterday’s Moderna news driven rally caught hedge funds offsides, causing them to cover a near record short position.
“Monday was one of the largest days of buying we have seen in recent months, as HFs covered short positions as the market rallied higher. Equity L/S funds were the largest net buyer, with ~60% of the net activity coming from covers, and the remainder coming from long additions.”
That may explain in part why there was no 3C confirmation yesterday shortly after the open, and why there was no follow-through today. As mentioned last night, we’ve seen a lot of these very strong 1-day moves with no subsequent follow through (short covering). In fact, until an afternoon decline, the S&P’s intraday price range was the narrowest in 3 months.
Did the hedge funds get head-faked? The afternoon decline was also on Moderna related news. Stat News wrote of Moderna, “The company’s stock valuation also surged, hitting $29 billion, an astonishing feat for a company that currently sells zero products.”
Also raising eyebrows, the company leveraged up the good news of a trial of only 8 healthy individuals, to offer up a 17.6 mln share secondary at $76 right after yesterday’s close. The good feelings were short lived when stocks, which had been treading water today, slipped this afternoon on the article from Stat News which continued…
“While Moderna blitzed the media, it revealed very little information — and most of what it did disclose were words, not data. That’s important: If you ask scientists to read a journal article, they will scour data tables, not corporate statements. With science, numbers speak much louder than words.”
This is exactly the kind of news/rumors and lack of intelligent sponsorship that creates broadening formations as pointed out in the Dow yesterday.
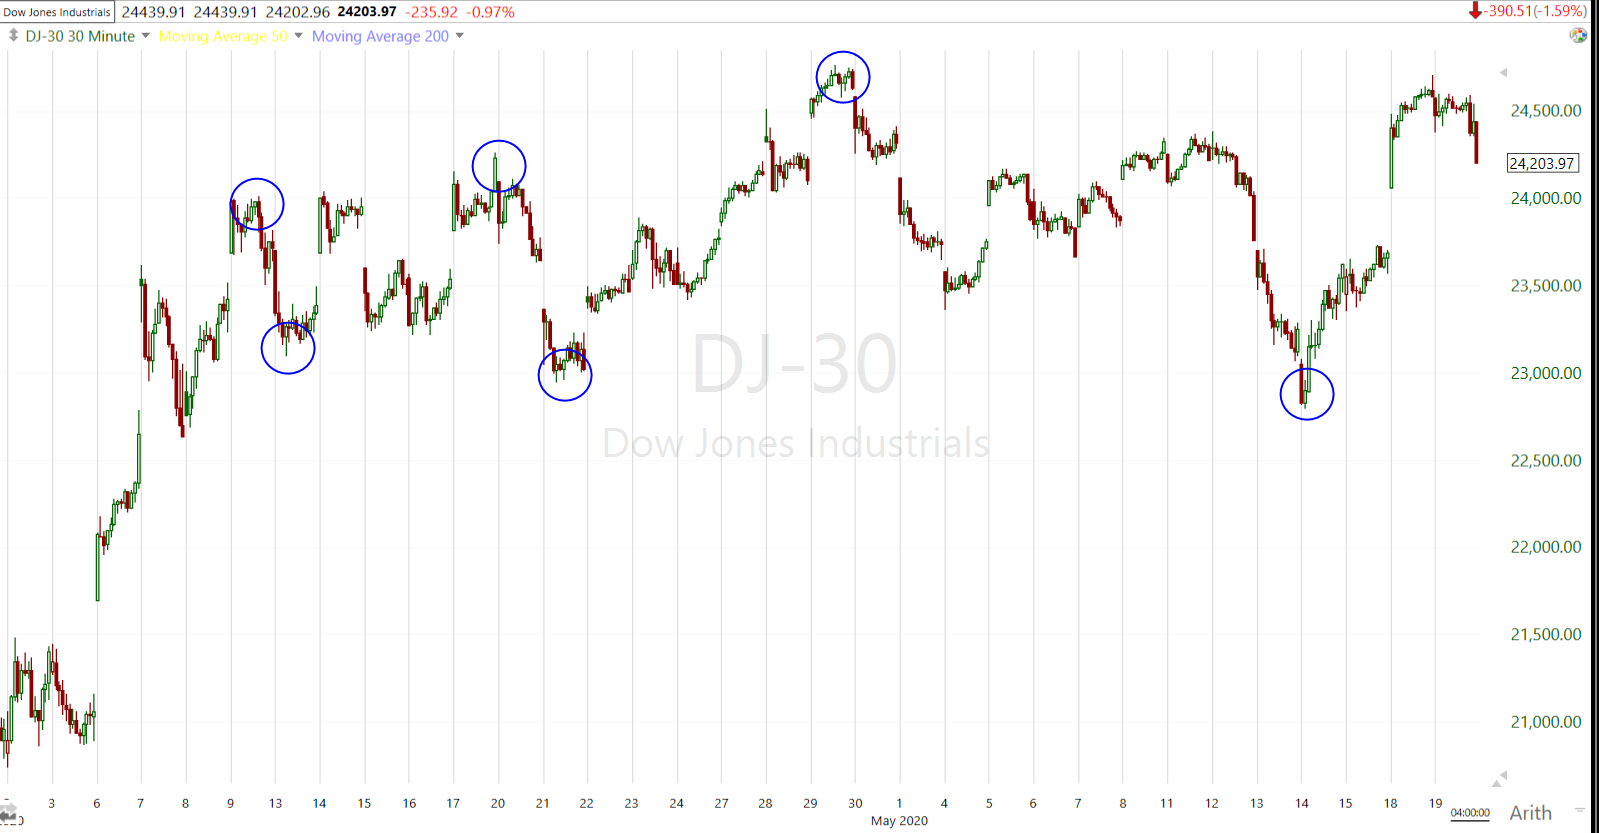 Dow (30m) Last night I showed at least 3 recent example of broadening formations (S&P April 2019, Crude November 2019 and Dow/S&P 2018-2020), none of them ended well.
And under the hood…
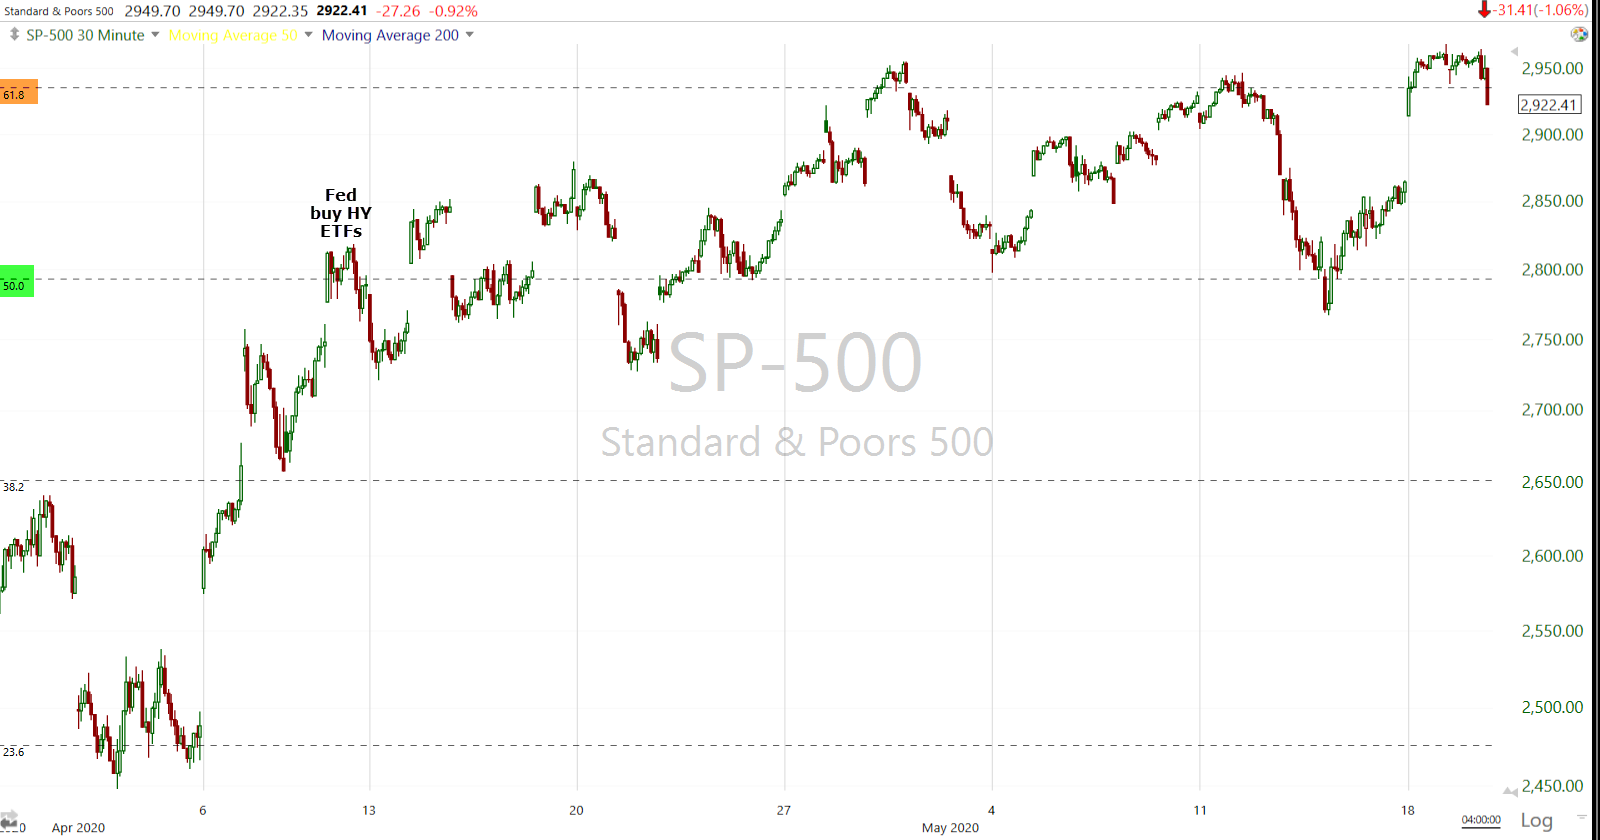
SPY (30m w/ Fib retracement levels) 3C is negatively diverging at each of the successive rallies to the 61.8 fib, but I don’t see any substantial positive divergences at the 50% level. I highlighted the price/volume trends, they explain why 3C is increasingly negatively divergent through the range. Rallies are occurring on less and less volume while declines are occurring on heavier volume.
Averages
No follow through buying today. Yesterday’s best performers, Dow and Russell 2000, were today’s worst.
S&P 500 ⇩ 1.07 %
NASDAQ ⇩ -0.36 %
DOW JONES ⇩ -1.59 %
RUSSELL 2000 ⇩ -1.95 %
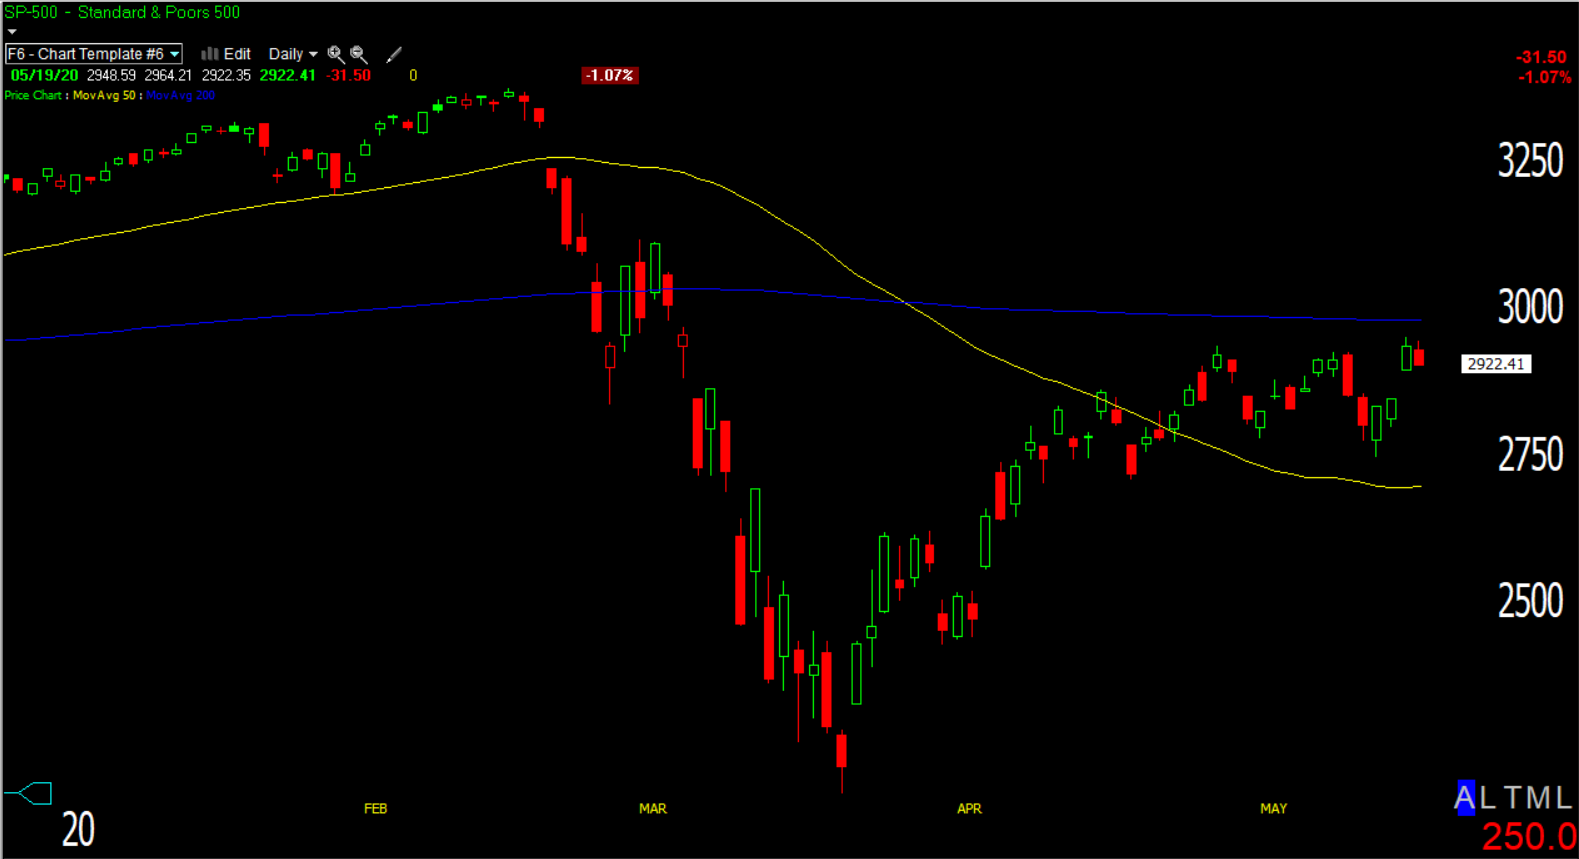
SP-500 (daily) and all of the other majors closed at session lows. It’s pretty easy to see the choppy sideways price trend since the S&P crossed above its 50-day (yellow) and below its 200-day (blue).
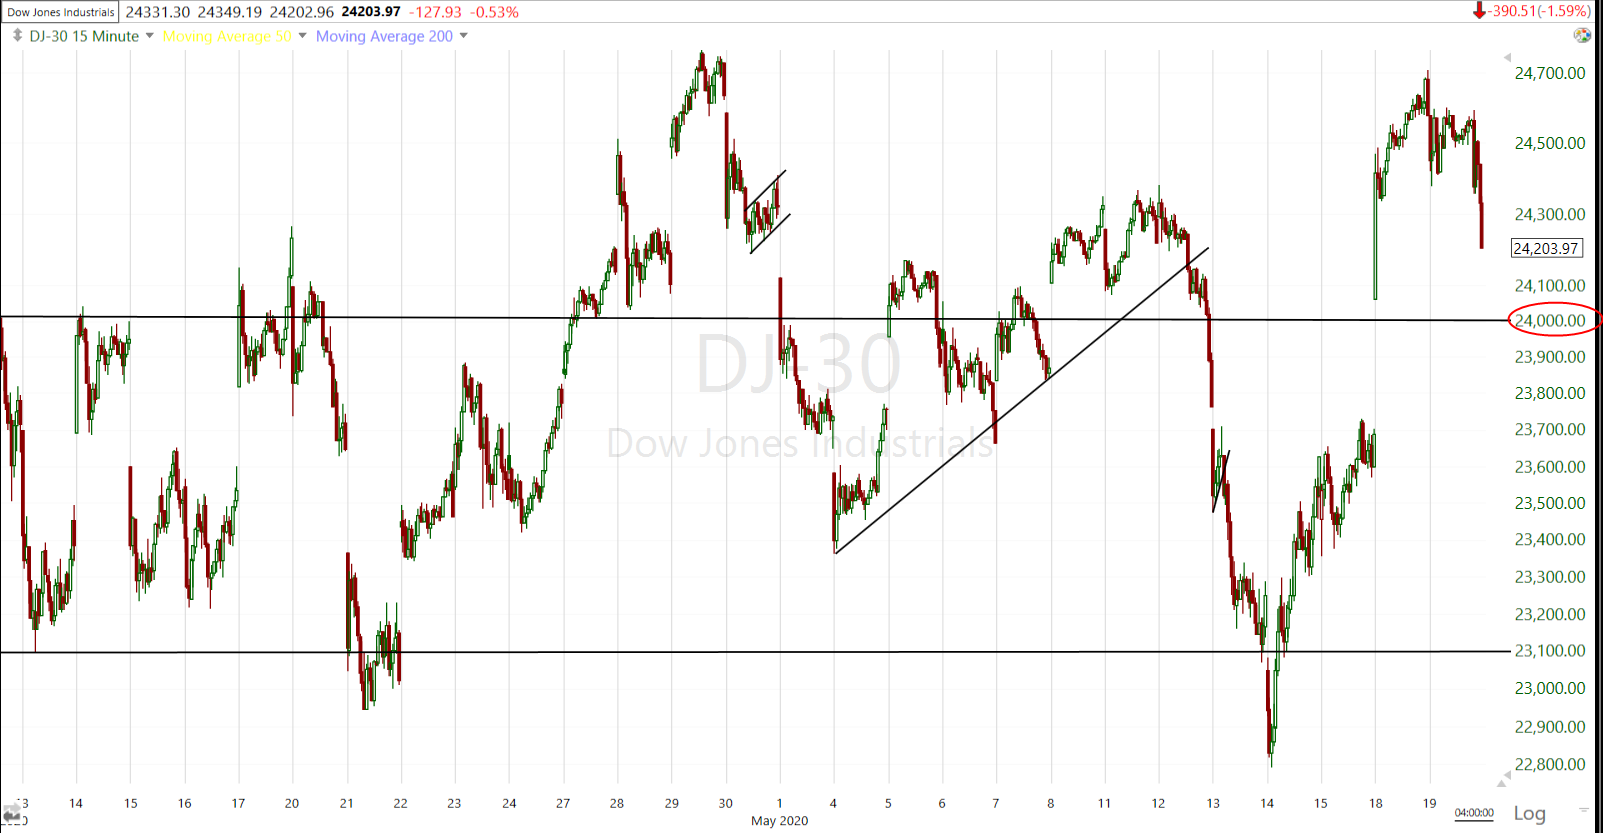
Dow Industrials (15m) sold off into the close, but still above the key 24,000.
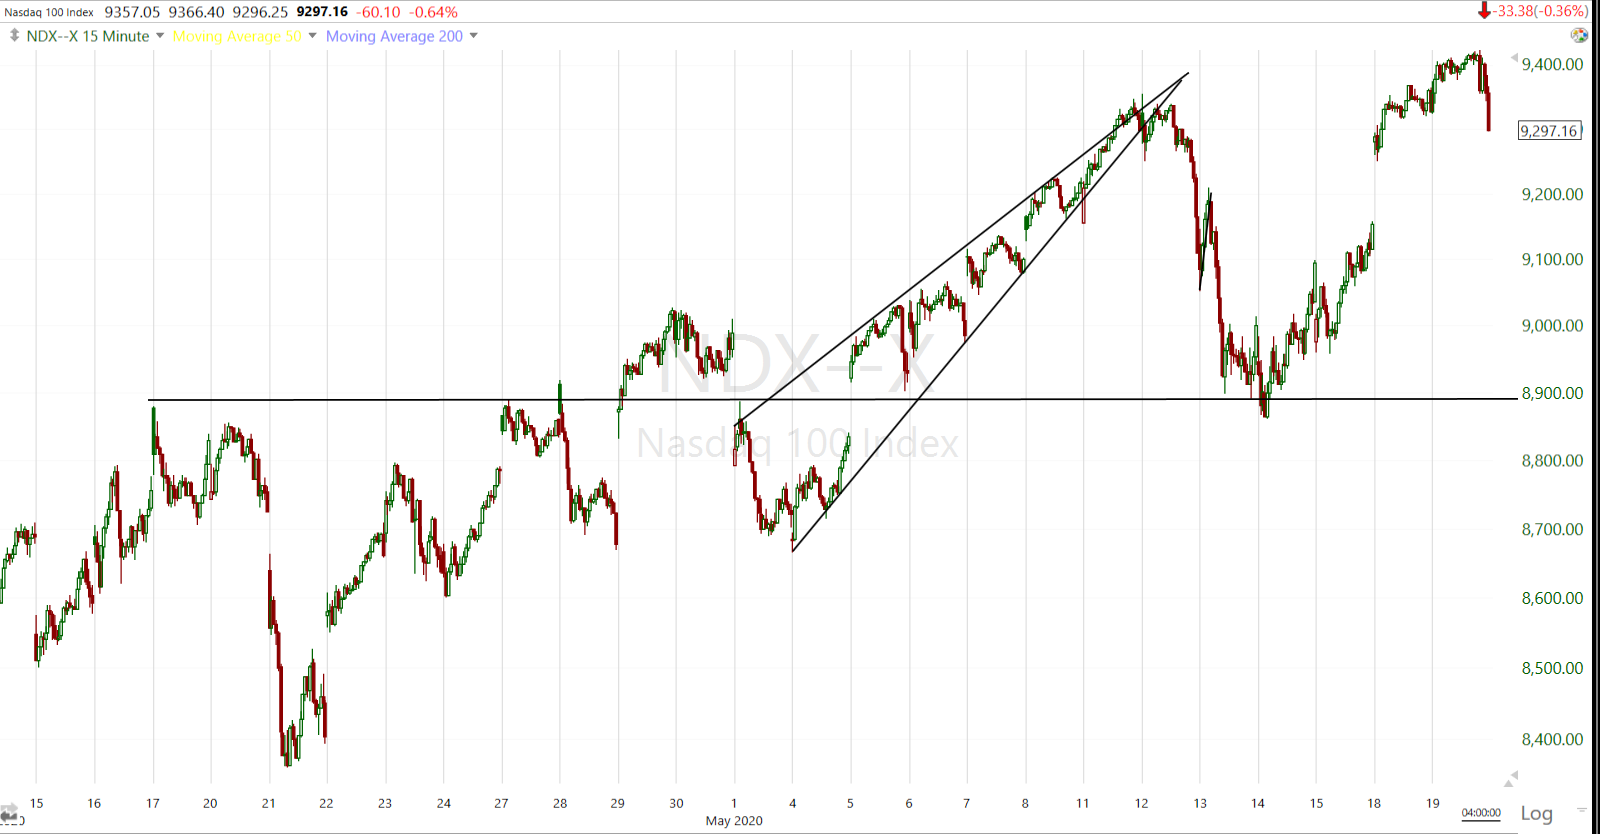
NASDAQ 100 (15m) made a slight higher high after last week’s decline to a higher low. It still has the most constructive price trend, although 3C shows weakness since the rising wedge.
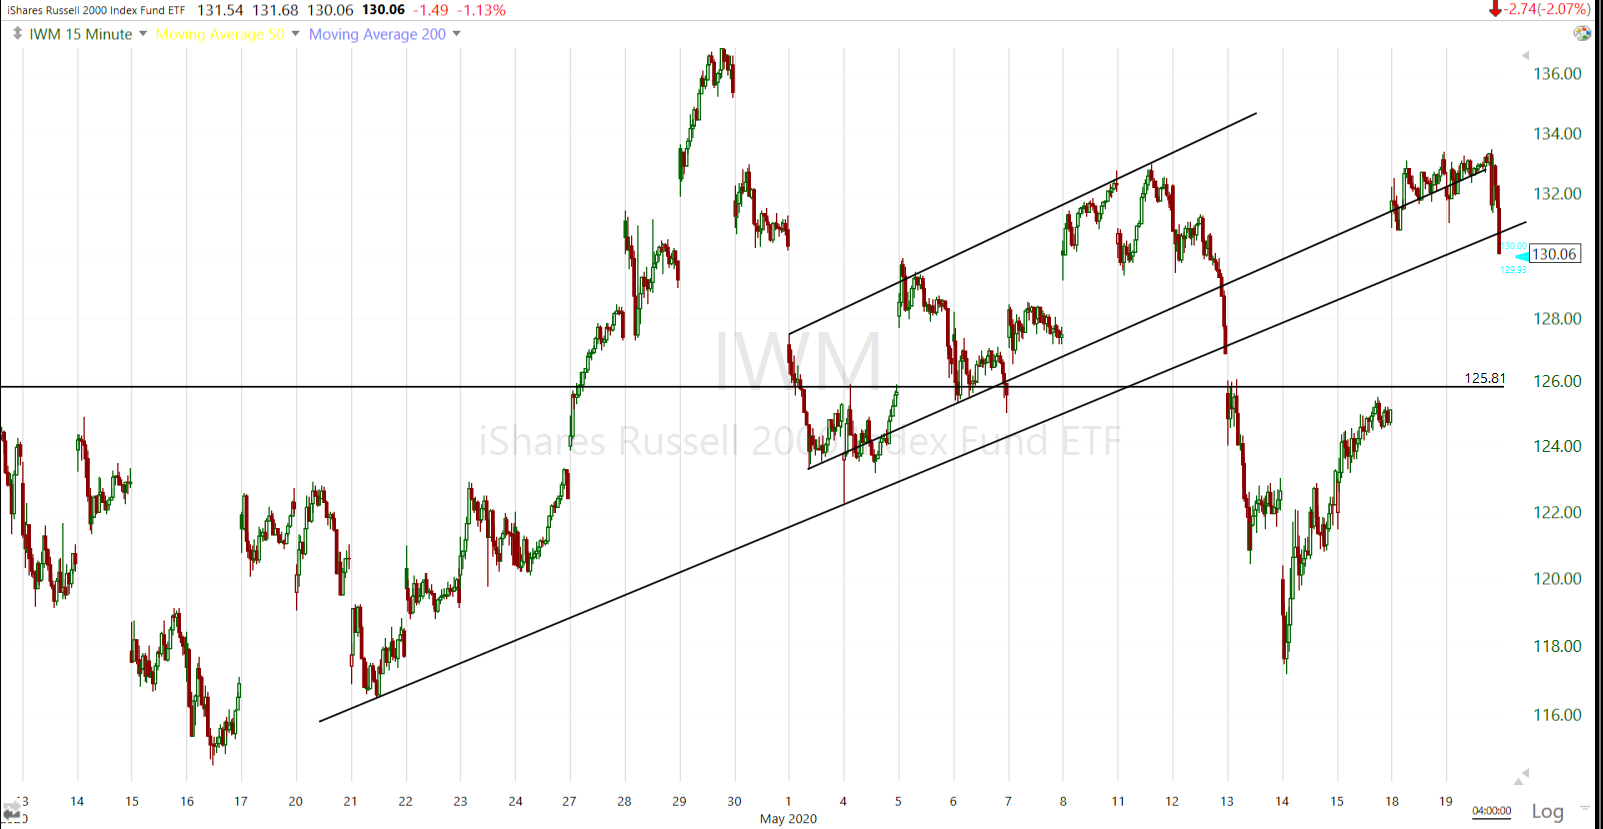
IWM (15m) sold off into the close.
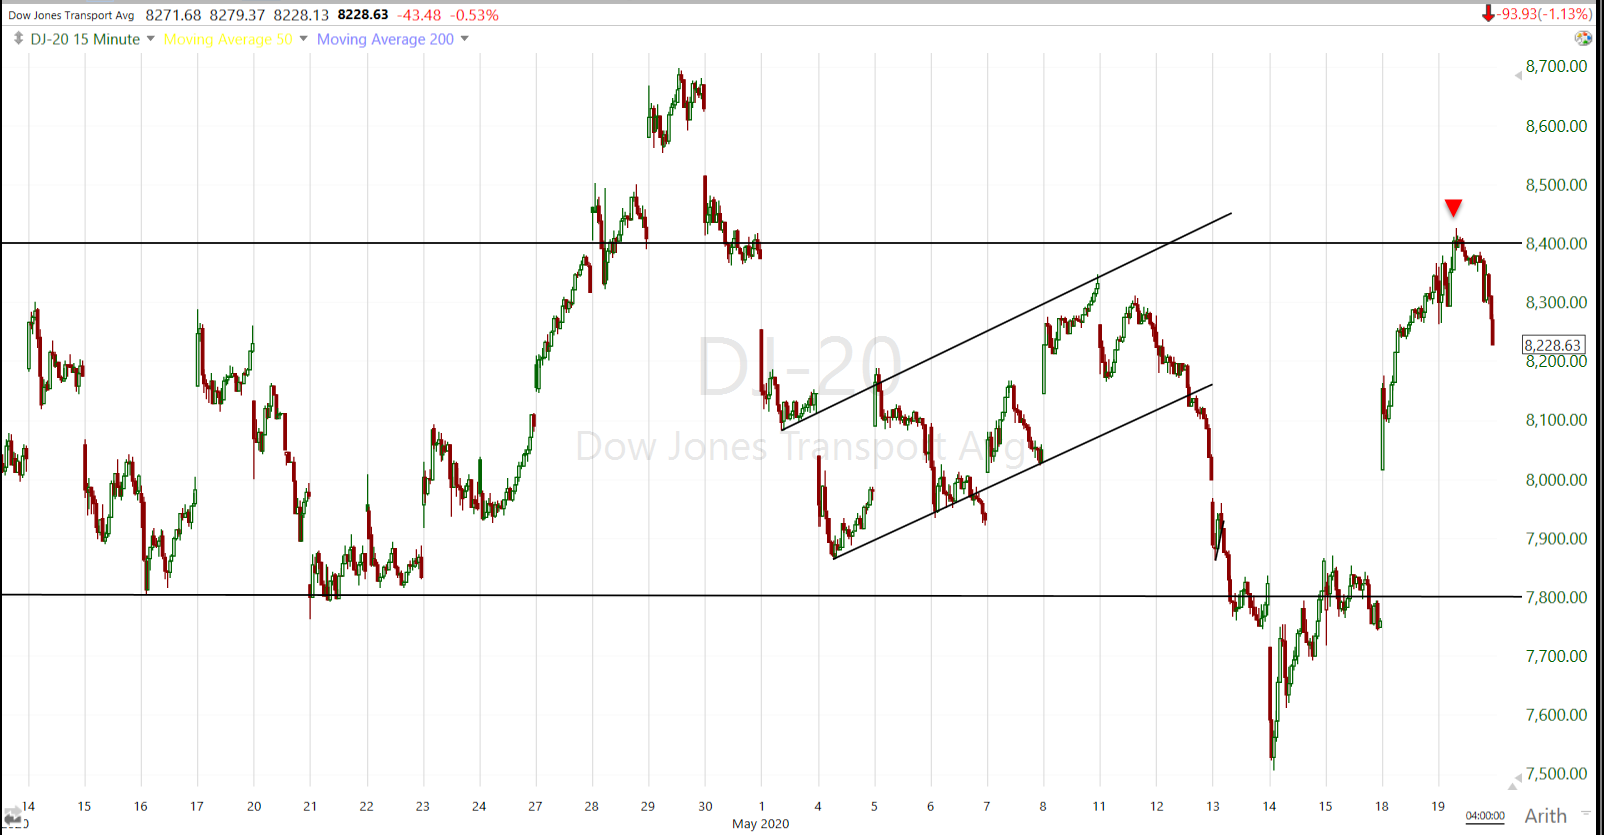 Dow Transports -1.1% (15m) found resistance at 8400.
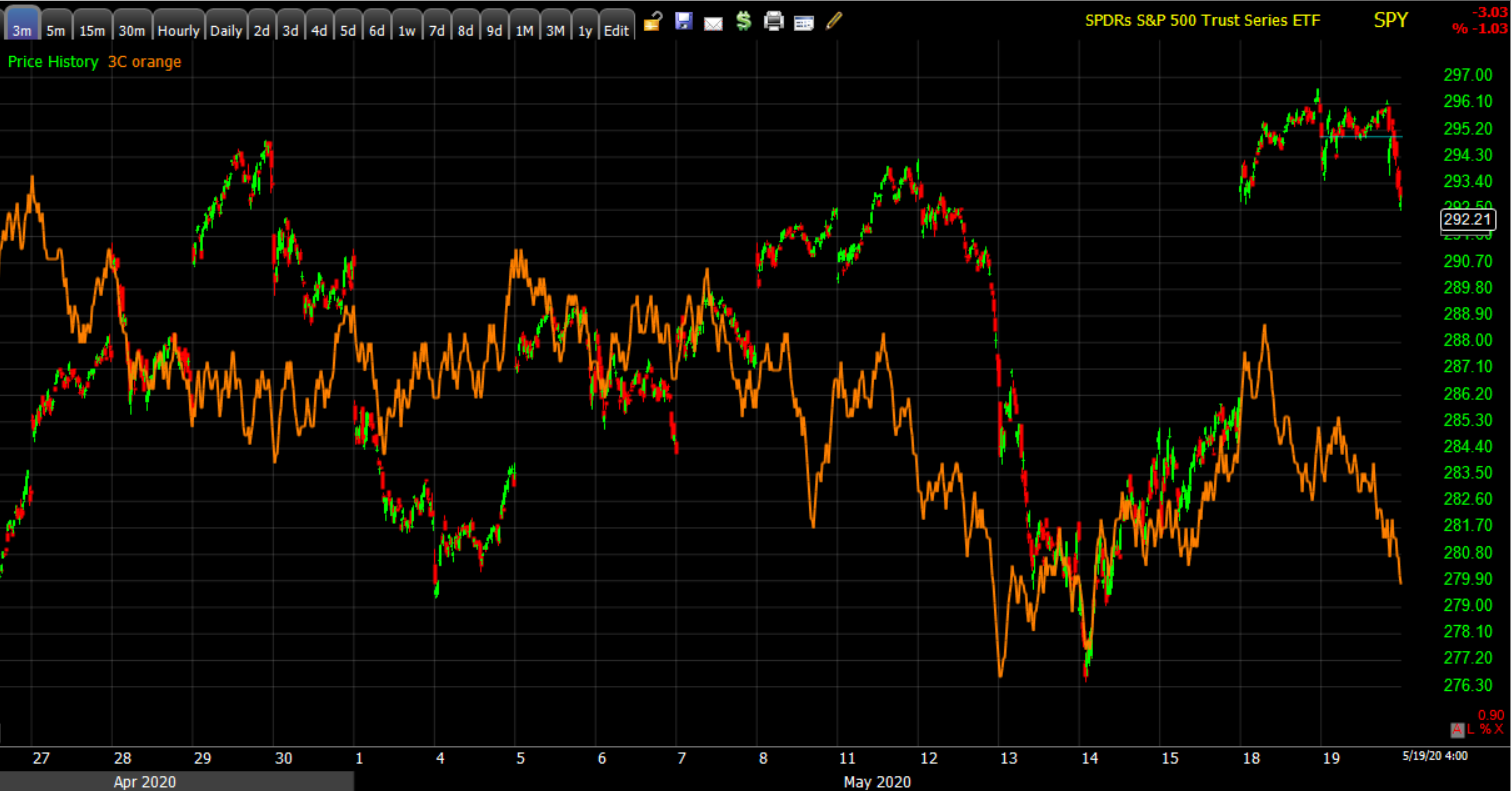 SPY (3m) Like the longer term (30m) chart above, 3C is negatively divergent at each of the 3 rallies to the 61.8 fib level. Monday 3C confirmation fell off shortly after the open (likely as short squeeze ended), it got worse into the close today.
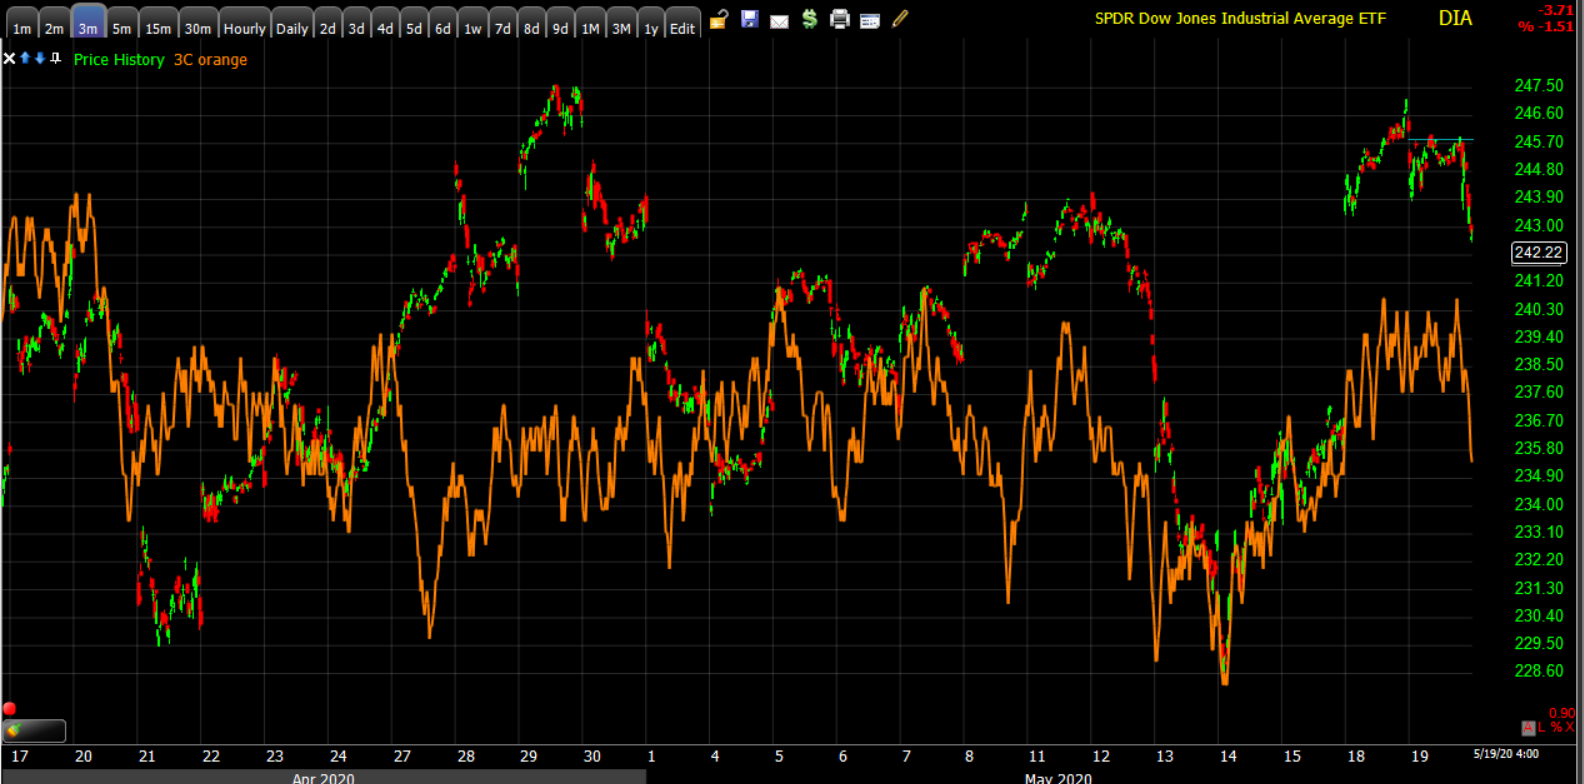 DIA (3m) had the best confirmation coming into the week and really didn’t flash any alarming negative signals yet this week, but is negatively divergent on a relative basis.
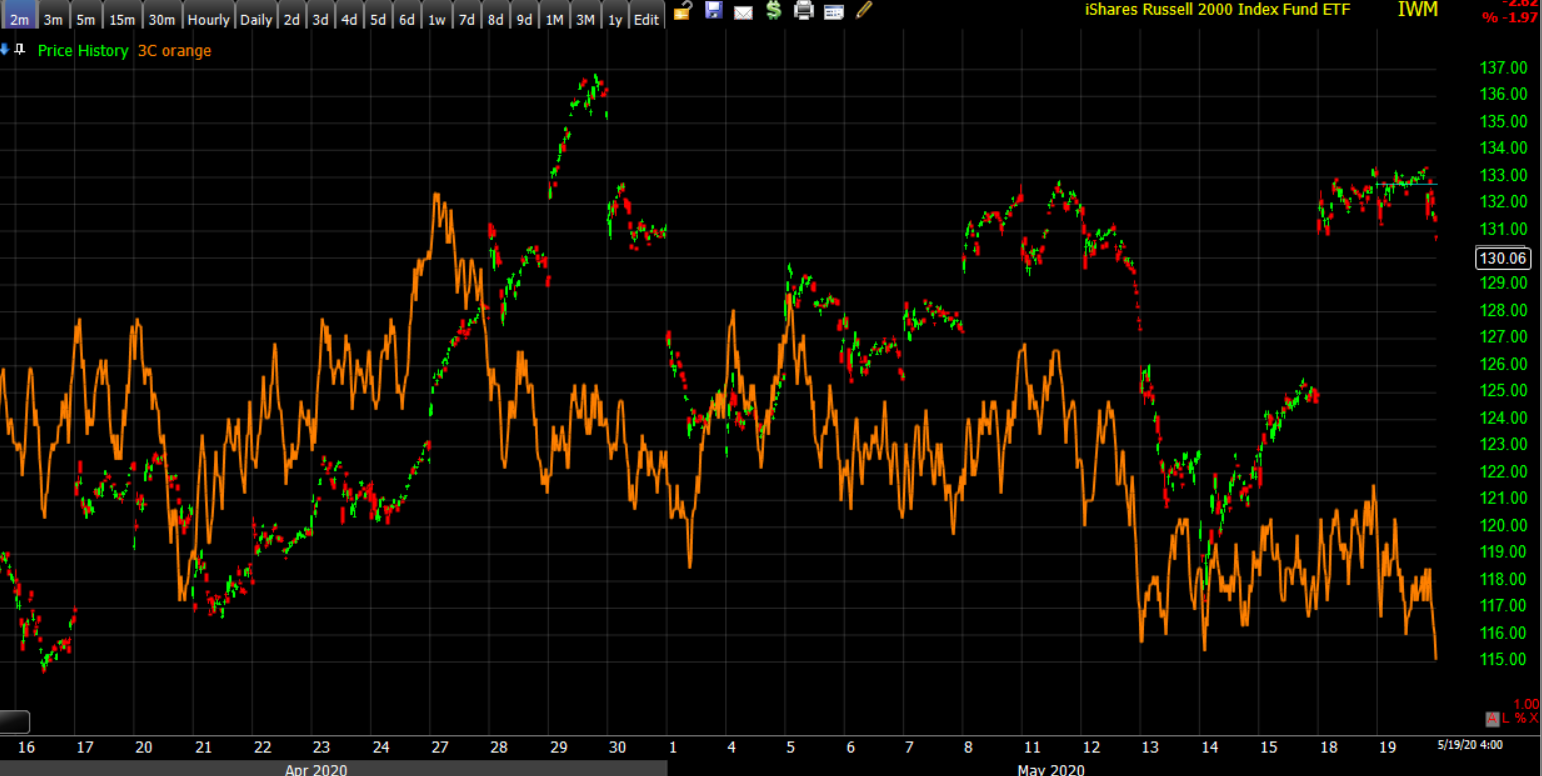
IWM (2m) I think IWM’s 3C chart looks the worst with barely any attempt at confirmation Monday despite the largest gain, and leaning toward a leading negative divergence.
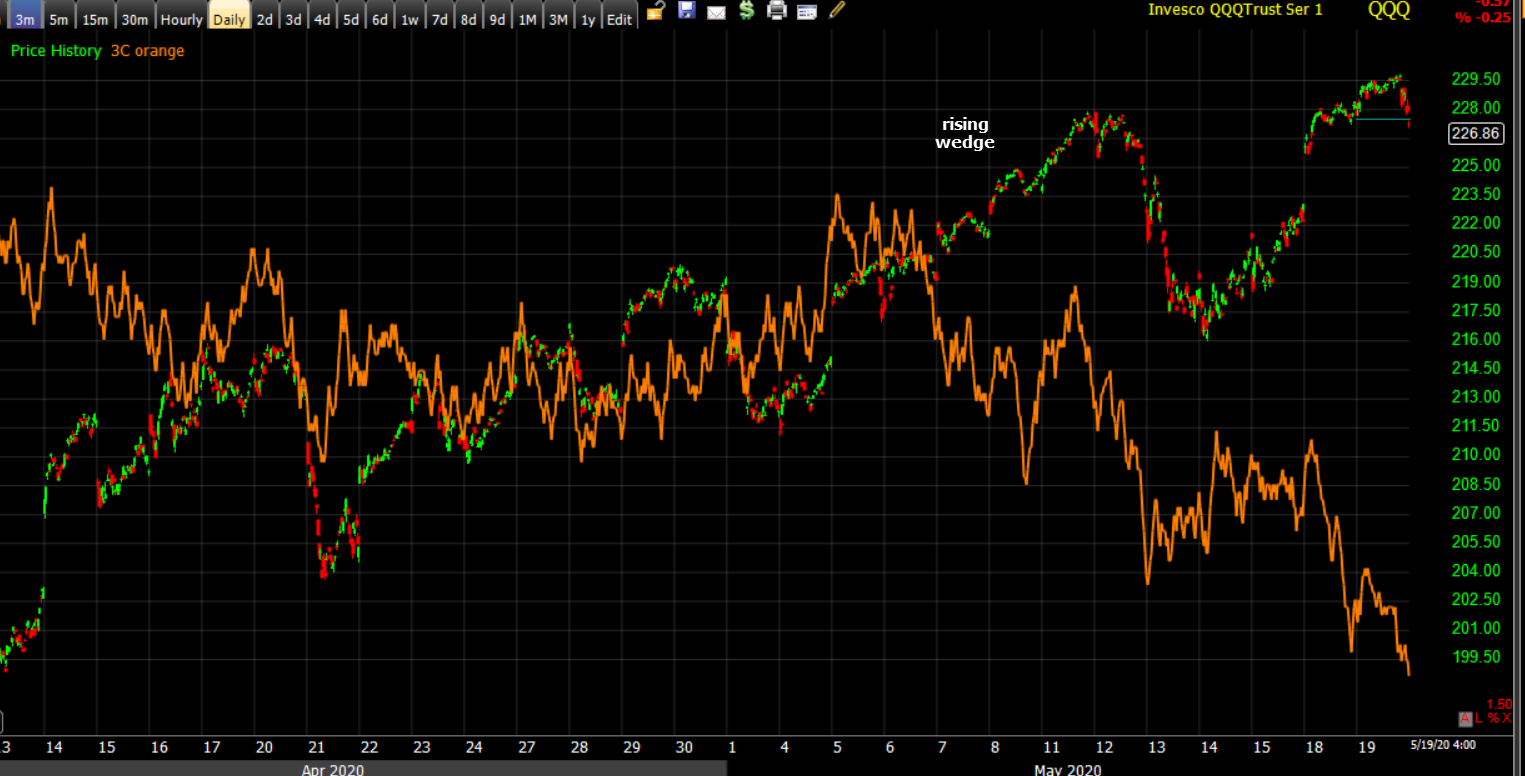 QQQ (3m) is starting to look interesting since the negative divergence into the rising wedge, now leading lower. Although NASDAQ has the strongest price trend of higher highs and higher lows, this divergence is looking more and more interesting.
Volatility and Powell
In Washington, Fed Chair Powell and Treasury Secretary Mnuchin testified before the Senate Banking Committee regarding the government response to COVID-19. Mr. Powell reiterated the Fed’s commitment to using its full range of tools to support the economy, and Mr. Mnuchin said he’s prepared to increase risk and lend more money. The testimony was a non-event for stocks, but there was a very clear transition on VIX futures’ 3C charts from leading negative overnight and during the event, to turning slightly positive just as it was ending. The chart below reveals the Fed’s invisible hand.
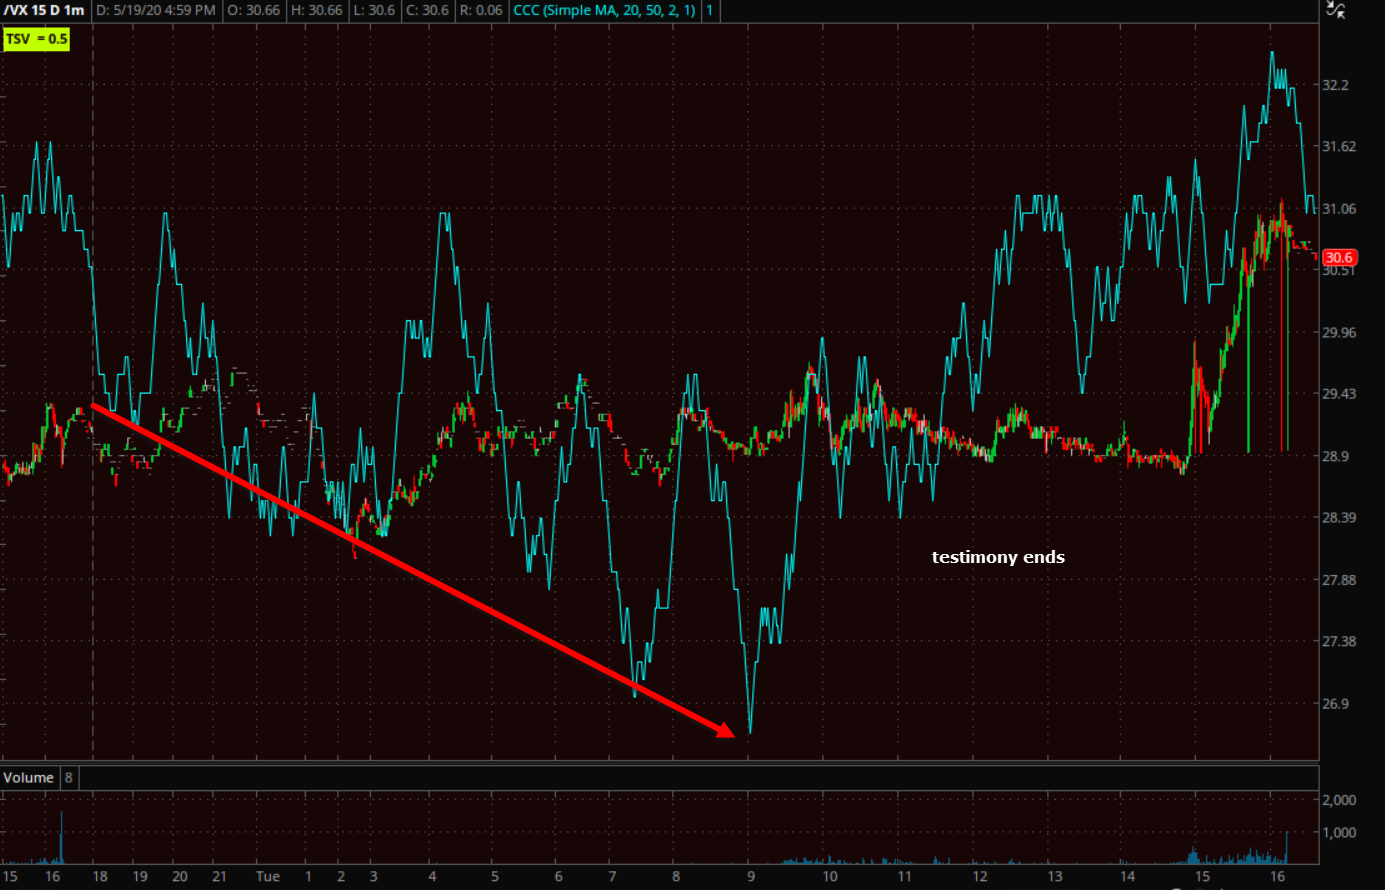
VIX futures (1m) 3C leading to new lows as prices were flat or even rising slightly. I’ve seen this so consistently so many times over so many years there’s no doubt in my mind that this is an orchestrated effort by, or on behalf of the Fed, to do their best to make sure the market doesn’t have any embarrassing adverse reactions to Fed events or speakers.
Over the last week VVIX has been rising, apparently sensing risk related to the U.S.-China relationship as many of the moves mimic those of the Yuan. After an 8 week decline, VVIX also made a trend turn last week.
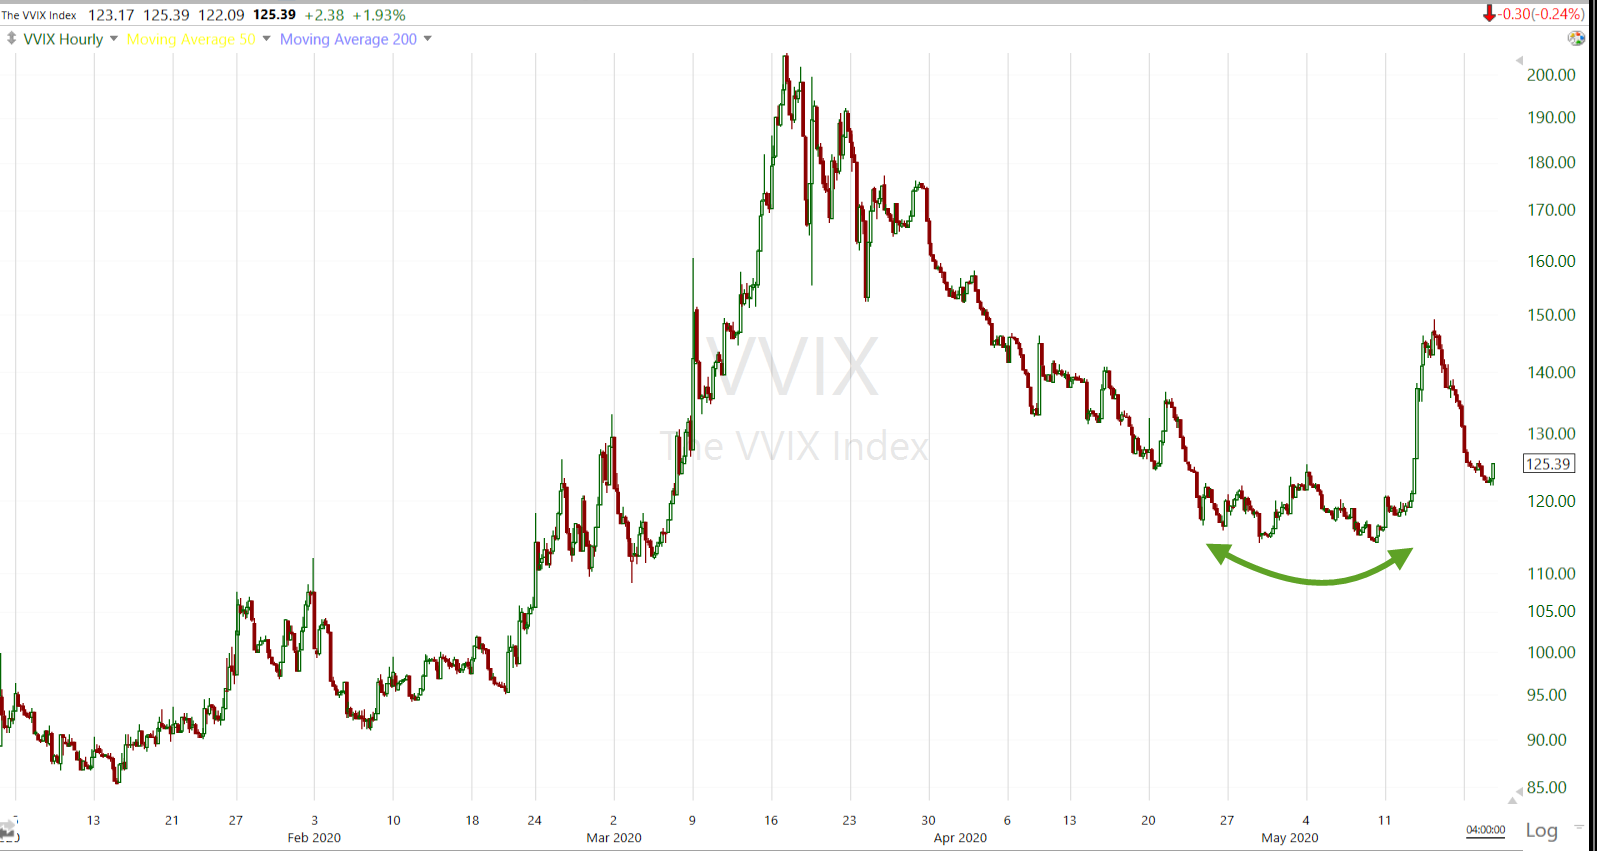 VVIX (60m)
VIX is also showing relative price strength, at least 10% above what I’d expect relative to the S&P. VIX may be following in VVIX’s footsteps.
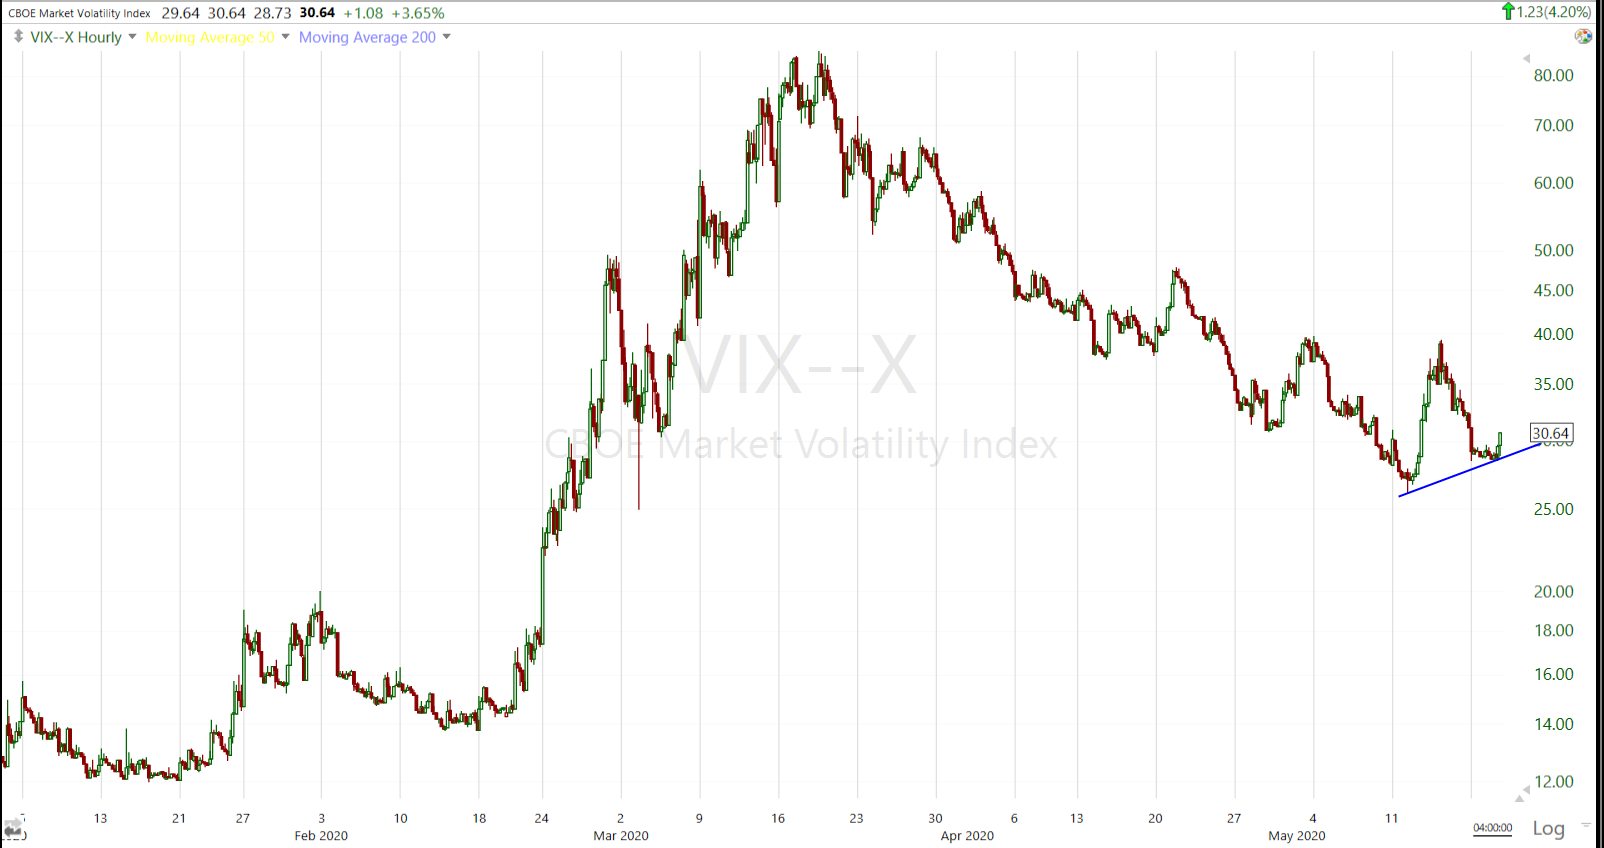 VIX (60m) should have been making a new lower low here, not a higher low.
S&P sectors
All 11 S&P sectors ended lower with yesterday’s leaders like Financials and Energy, today’s laggards. The KBW Bank Index lost -3.5% and Regional Banks lost -4.5%. The mega-cap heavy Technology, Consumer Discretionary and Communications gave back the least.
Materials ⇩ -0.96 %
Energy ⇩ -2.80 %
Financials ⇩ -2.44 %
Industrial ⇩ -1.28 %
Technology ⇩ -0.37 %
Consumer Staples ⇩ -1.84 %
Utilities ⇩ -1.65 %
Health Care ⇩ -1.20 %
Consumer Discretionary ⇩ -0.36 %
Real Estate ⇩ -1.94 %
Communications ⇩ -0.02 %
Many S&P sectors traded up to resistance areas and were turned back, most notably Financials and the Banks.
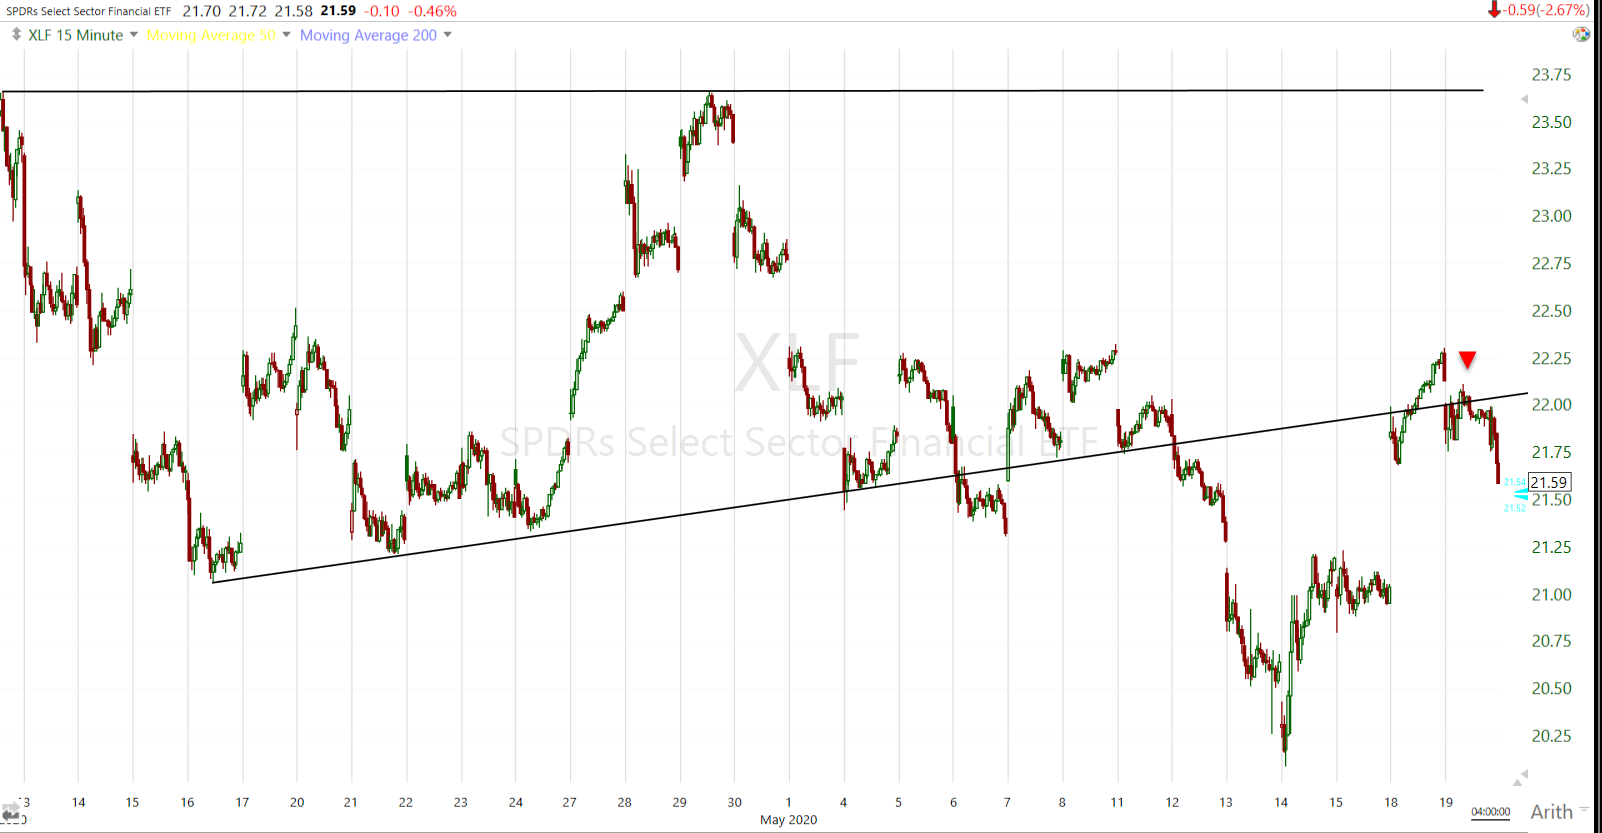 Financial sector (15m)
The mega-cap heavy sectors are still in the best shape in terms of price trends, like the influential Technology sector.
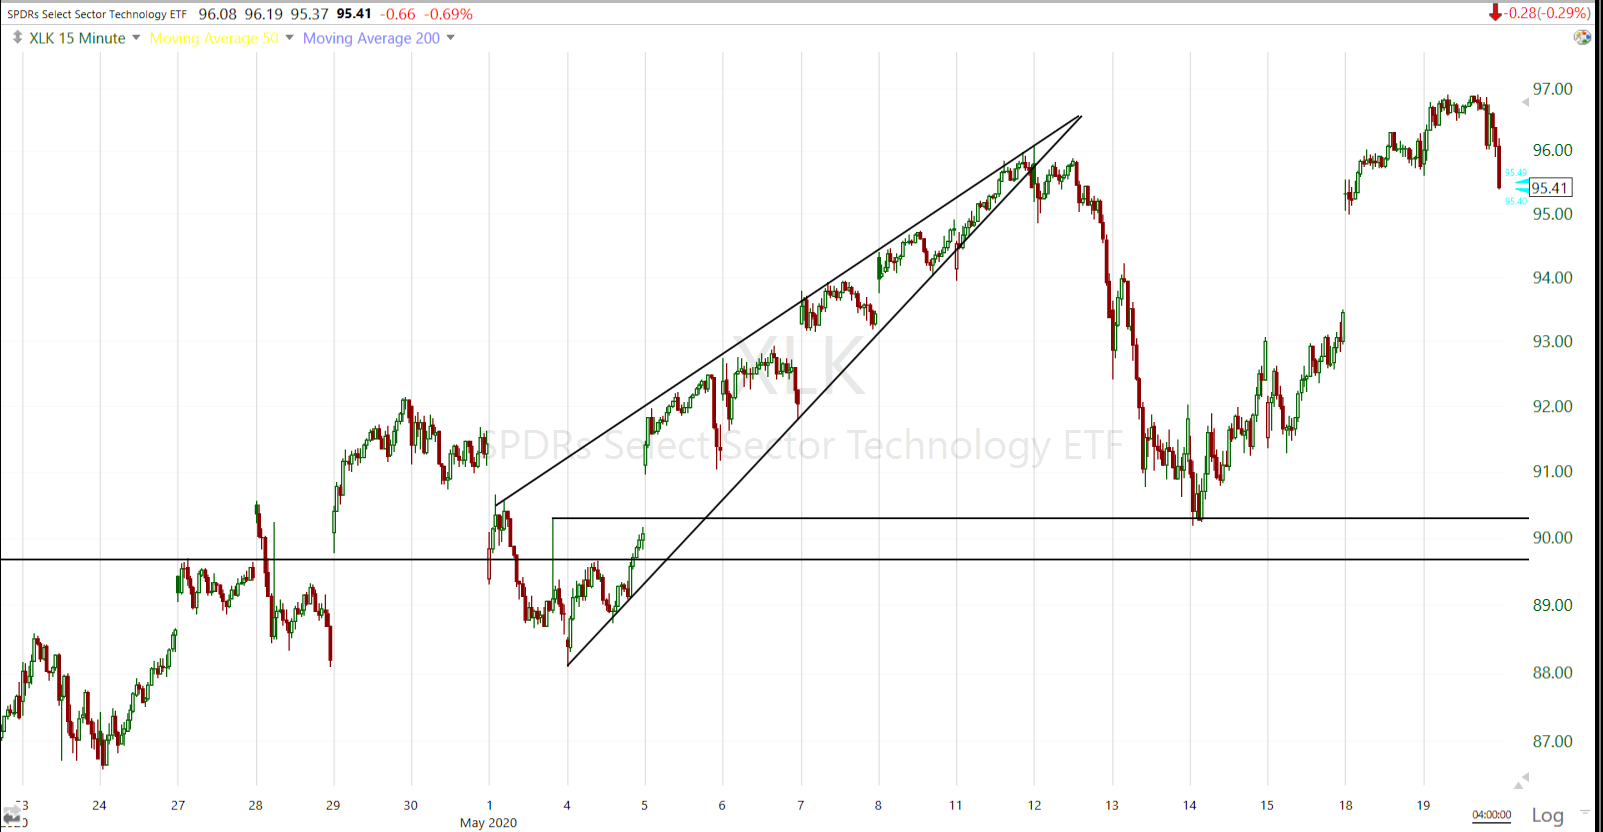 Technology sector (15m) made a higher low last week after falling from a bearish rising wedge, and made a slight higher high this week, but did close weak.
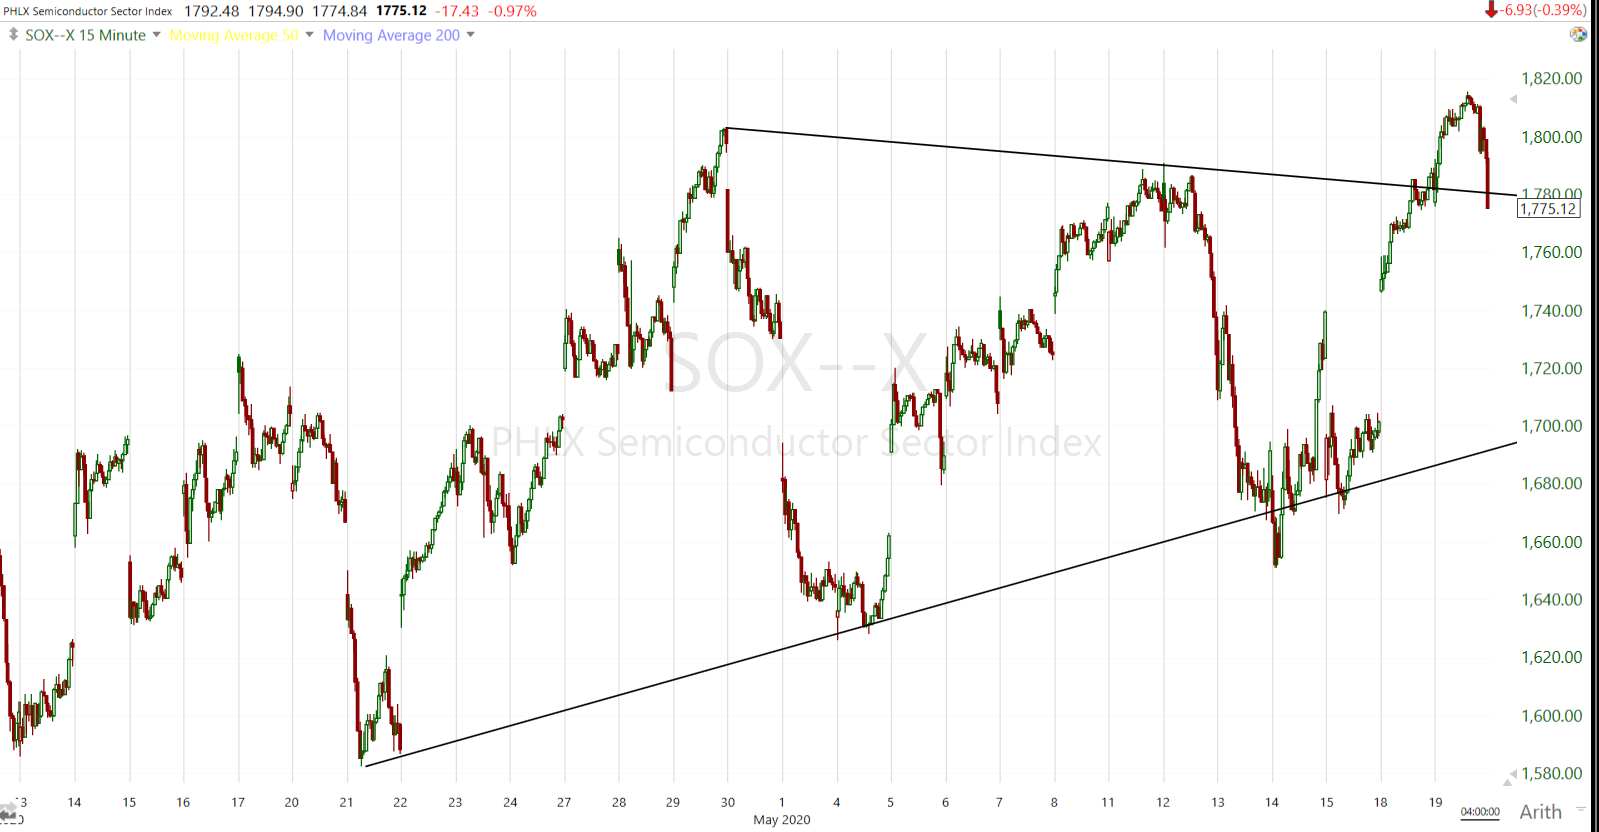 Semiconductors (15m) broke out today, but couldn’t hold it by the close.
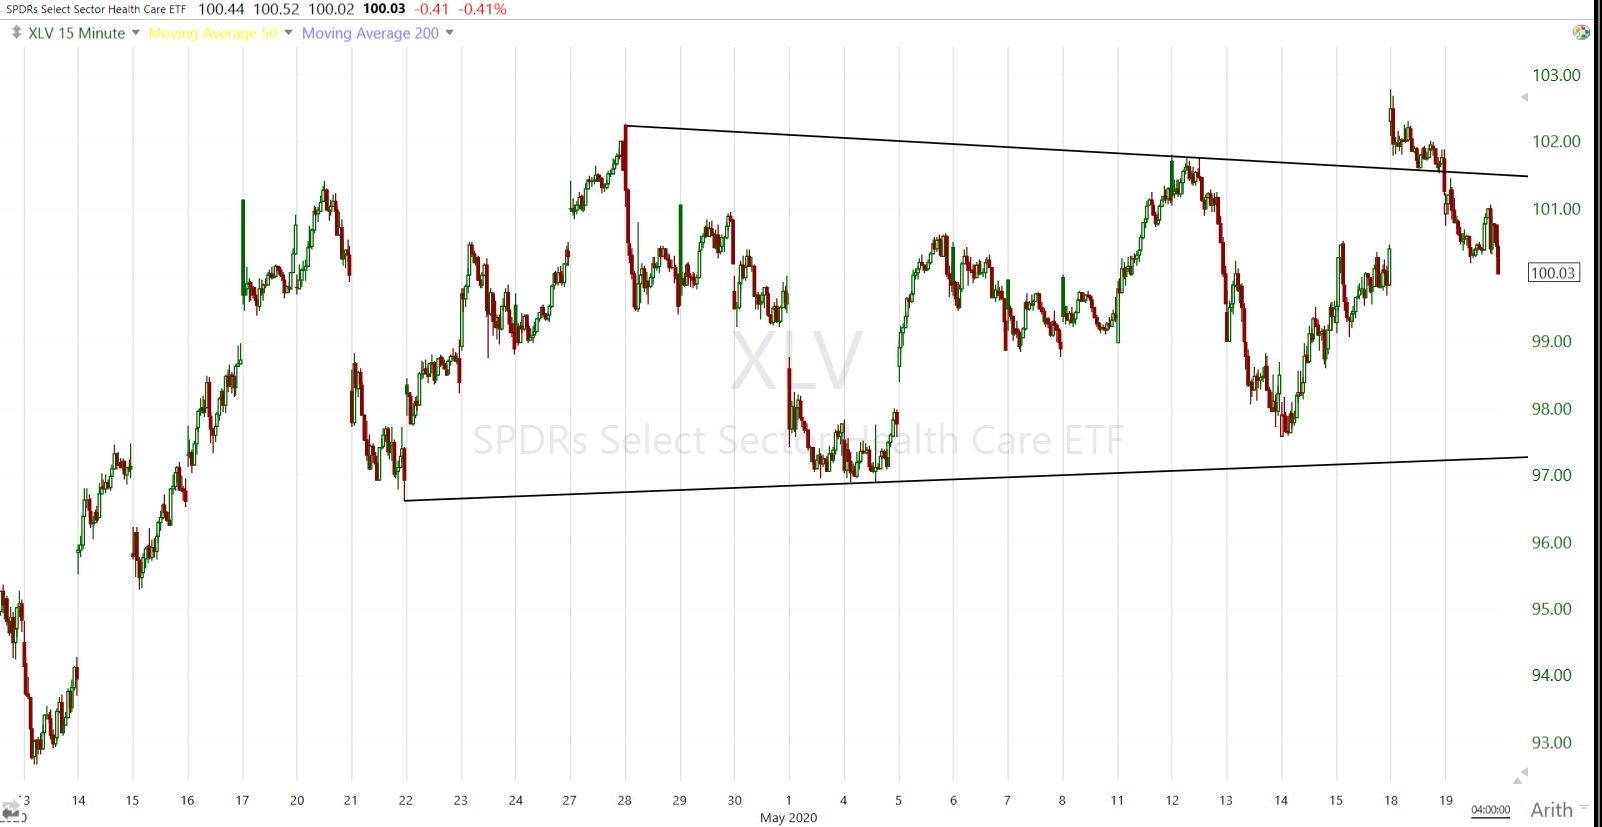 The Health Care sector (15m) broke out yesterday with the vaccine news, but lost it today, although it did have an interesting positive 3C signal this afternoon before the Moderna news.
Internals
NYSE Decliners (1760) exceeded Advancers (1118) on lighter volume of 875.1 mln.
The Dominant price/volume relationship is Close Down/Volume Down, a very common relationship for a consolidation day.
Internals are consistent with a consolidation day. There is no 1-day oversold condition. Market breadth continues to deteriorate.
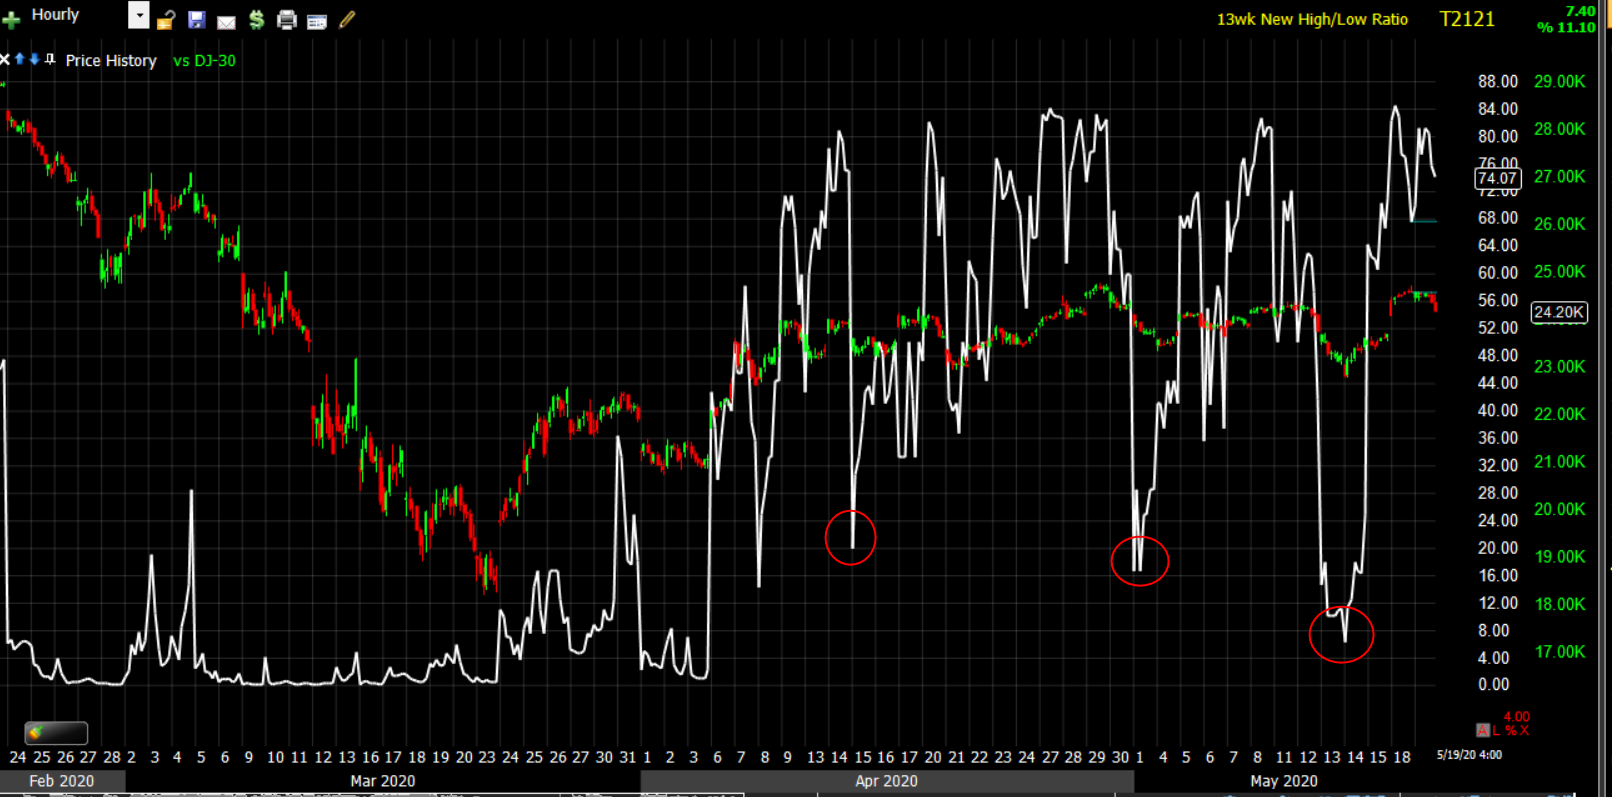 NASDAQ 100 (60m) and 13 week new high/new low ratio. This breadth indicator is an oscillator which can identify areas of likely overbought/oversold. I point it out here because it depicts the same increasingly chaotic trade as the Dow. The indicator declines in the price range show deeper and more severe readings (lower lows), or increasingly more unstable dynamics.
Here’s another flashback or deja vu chart…
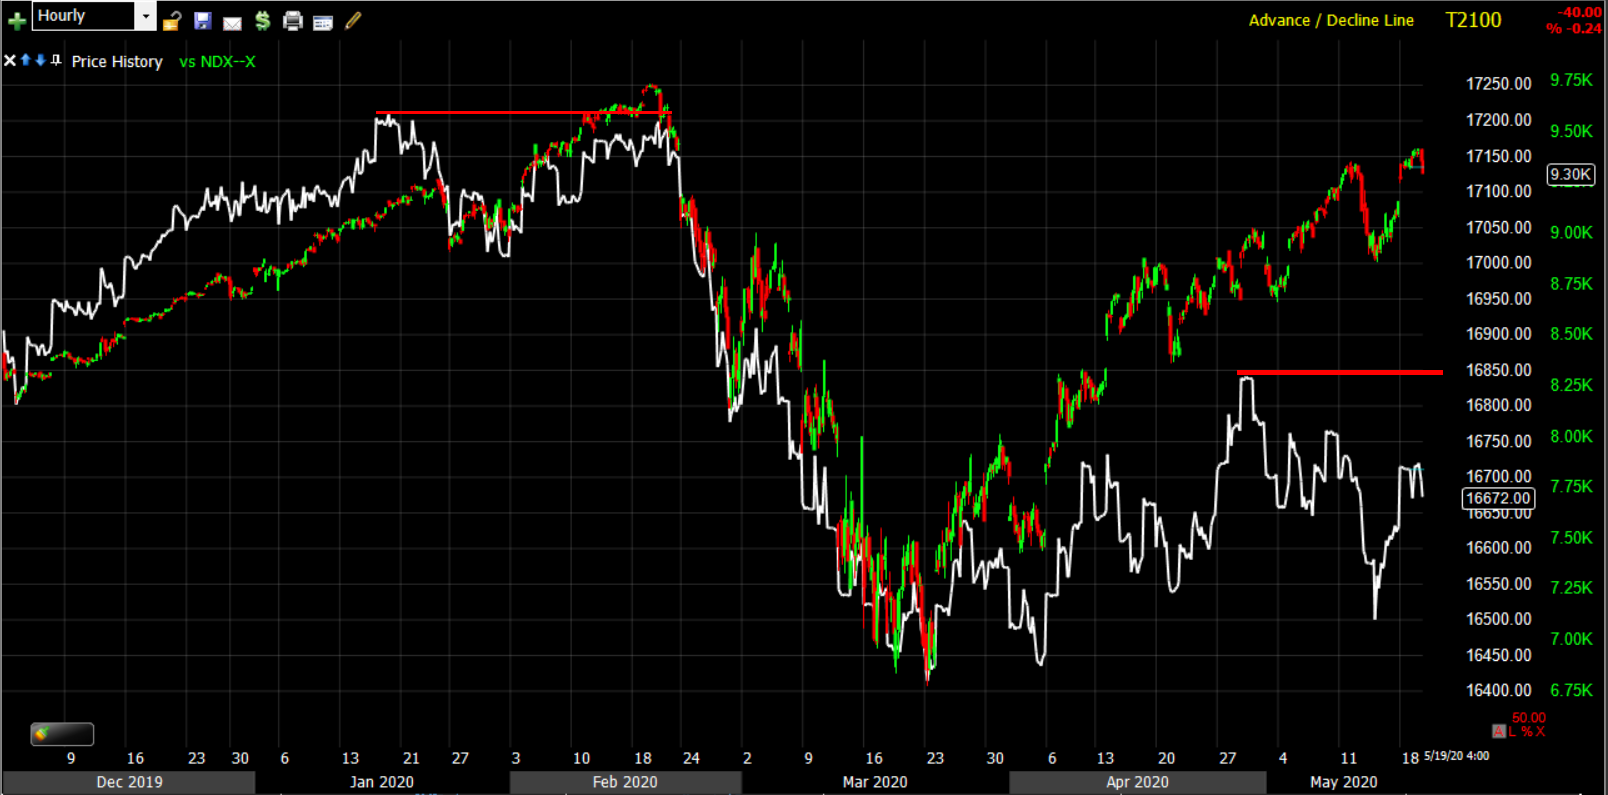
NASDAQ 100 (60m) and NYSE Advance/Decline line. Like early 2020, 5 or 6 stocks drive the market’s upside and mask the weakening internals under the hood. The picture here is worse than at the February high as fewer and fewer stocks participate in higher highs.
Treasuries
After being down sharply Monday, U.S. Treasuries found support overnight and ended the session with small gains. The 2-year yield declined one basis point to 0.18%, and the 10-year yield declined three basis points to 0.71%, retracing some of yesterday’s curve steepening that benefits banks.
Currencies and Commodities
The U.S. Dollar Index declined 0.1% to 99.55. Speaking of ranges, the Dollar Index is going on its 8th week.
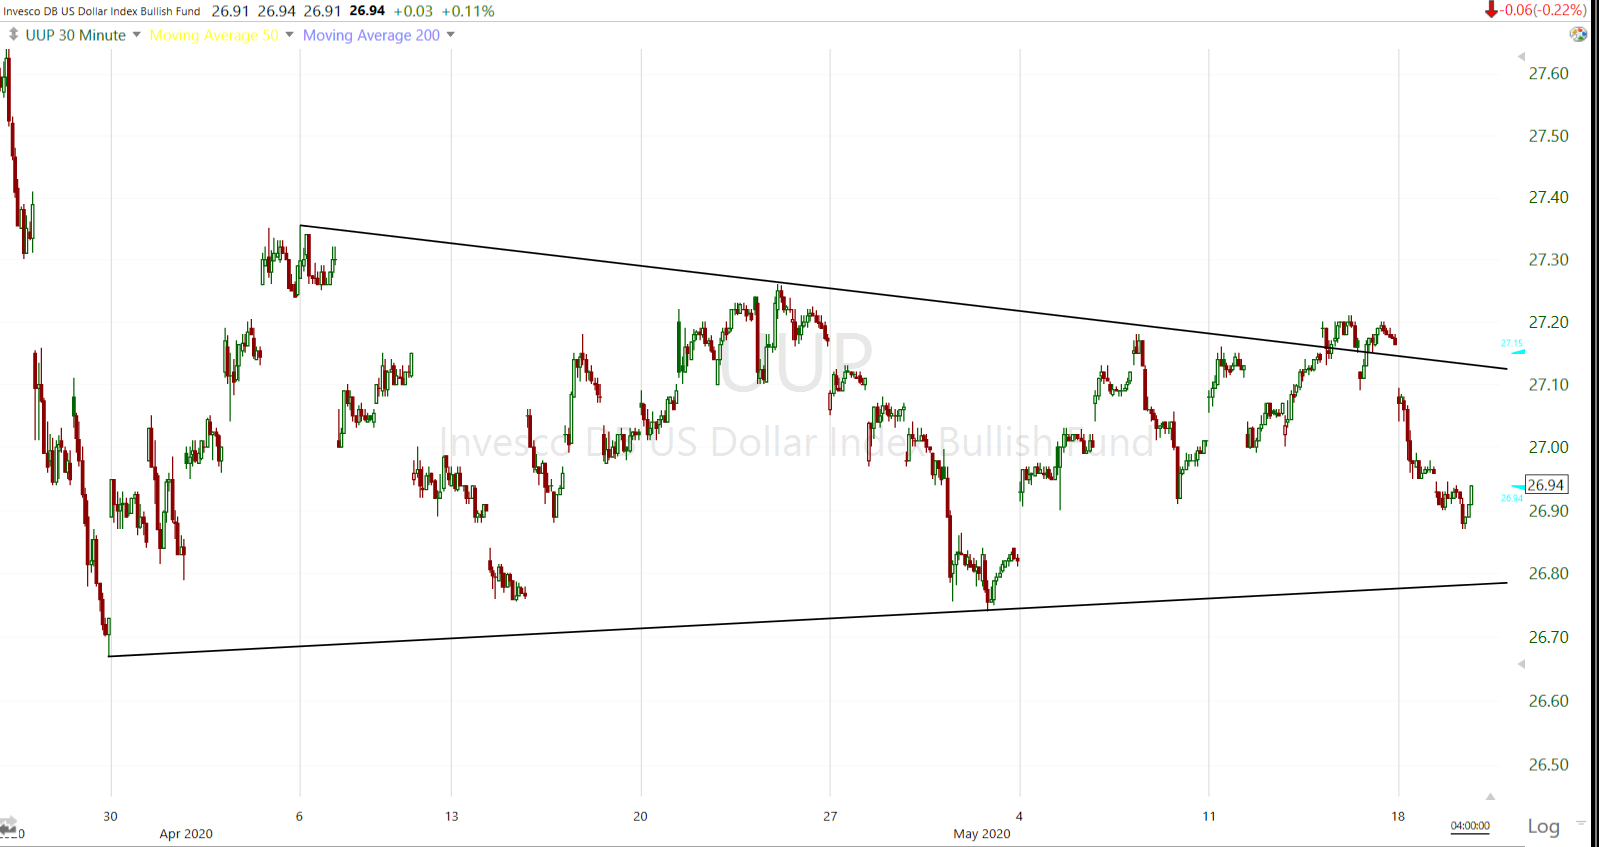
UUP (30m) – over the last 2 months the U.S. Dollar and stocks have had an inverse relationship, dollar strength hurting stocks and weakness helping them. Notice the near breakout last week as stocks had their worst week since the crash.
Equity investors haven’t given U.S. – China tensions a second thought, but the currency market hasn’t forgotten.
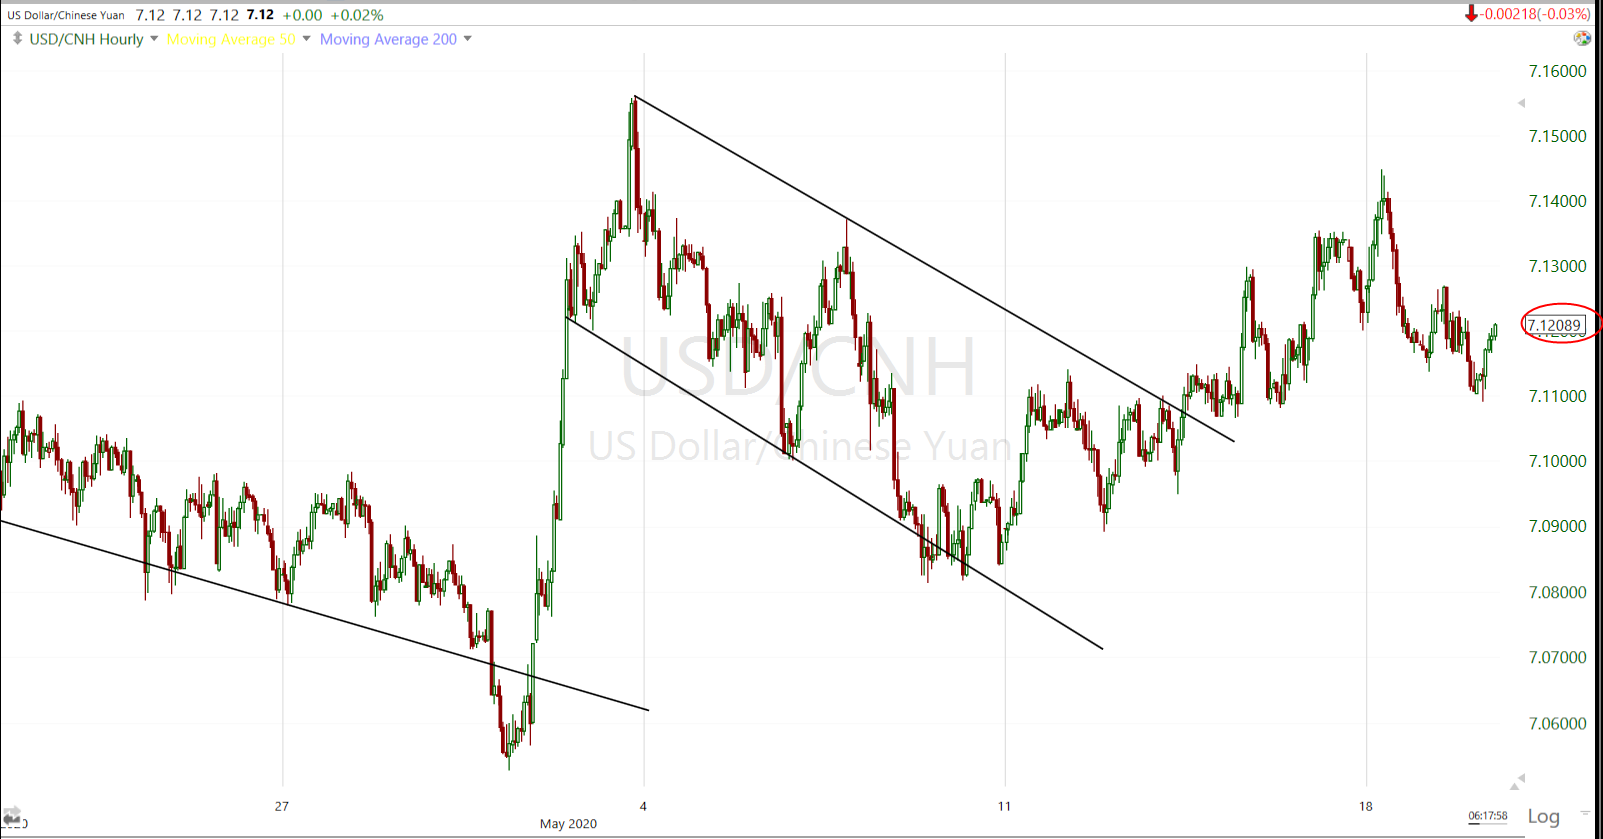
USD/CNH (60m)
In a further sign of tightening scrutiny on capital flows to the Asian nation, Nasdaq is set to unveil new rules for initial public offerings including tougher accounting standards that will make it more difficult for some Chinese companies to list on the exchange.
WTI crude gained +1.5% to $32.30/bbl.
Gold futures recouped some of yesterday’s losses stemming from vaccine hopes, up +0.7% to $1,745.60/oz, aided in part by losses in the greenback. I still like gold a lot.
Summary
Yesterday’s market was impressive, apparently due to hedge fund shorts being squeezed. Other than an attempt in the overnight session on very little volume, there was no follow through today, and that was the case well before the Moderna news late this afternoon. I’m hoping that a few of the trade ideas that I’ve mentioned (banks, some airlines, maybe NASDAQ, gold) provide a high probability opportunity for a good risk/reward entry. If you are considering new trades, or are in trades now, you have to be aware of the lateral price range. When I started my small cap short position this was my concern and one of the reasons I chose not to use options because of the probability of time decay. However, given the length of the range, the deterioration in market breadth and 3C, and the changes in volatility’s character, I am looking at using some options moving forward.
Compared to a week or so ago, the bond market is relatively quiet so that’s one thing I’m watching closely. Don’t let the lateral range lull you into complacency. This market could be thrown a unexpected curve ball that has nothing to do with vaccines or re-opening efforts. That’s the warning USD/CNH is sending and that seems to be what has been moving VVIX.
Overnight
S&P futures are +0.2%.
S&P futures (1m)
The VIX futures contract rolls tomorrow. With some relative strength built up this week it will be interesting to see how it pans out.
WTI Crude is down -0.45%
Treasury futures are up and the 10-year yield down 2 basis points, a little more defensive stance heading into the overnight session.
Housing starts fell 30.2% m/m in April to a seasonally adjusted annual rate of 891,000 (consensus 950,000). Building permits were down 20.8% m/m to a seasonally adjusted annual rate of 1.074 million (consensus 1.000 mln). The key takeaway from the report is that while building permits exceeded expectations, permits for single-family dwellings decreased 24.3% m/m to 669,000, which points to a slowing market.
Looking ahead, investors will receive the weekly MBA Mortgage Applications Index on Wednesday.