Stock Market Daily Wrap
The S&P ended a negative September on a high note, and a positive for the 3rd quarter.
The S&P ended the month of September with its worst performance since 2011. NASDAQ was the worst performing major average for the month as the mega-caps led the month’s downside. The Dollar rallied in September, putting pressure on stocks, ending with its best performance since March. Of course the Dollar has been pulling back this week after reaching notable resistance last week. All major commodities ended September lower due to Dollar strength. Silver was the worst performing with the weakest month since September 2011.
There were a number of cross-currents at work in the market today from the reaction to the Presidential debates; the historical probability of markets closing higher the next day after the first presidential debate; hopeful stimulus headlines from Pelosi and Mnuchin, but cold water poured on the idea by Senate leader McConnell; better than expected economic data and jobs numbers, but also increasing corporate layoffs; Technical influence and month/quarter end rebalancing.
After a negative reaction to the Presidential debate, the market opened modestly higher on a confluence of positive data and news. The ADP Employment Change Report for September, the Chicago PMI for September, and the Pending Home Sales report for August each came in stronger than expected. The third estimate for Q2 GDP produced a slight upward revision to -31.4% q/q annualized, but still marking the biggest downturn in the U.S. economy ever.
Stimulus optimism was stirred by hopeful-sounding commentary from House Speaker Pelosi, White House Chief of Staff Meadows, and Treasury Secretary Mnuchin. In reaction bonds dropped, yields jumped, cyclical sectors and Small Caps led in the morning and early afternoon, but the market later got upset on news that Senate Majority Leader said both sides remain far apart on stimulus.
The S&P had been up +1.7% until McConnell’s comments, then trimmed the gain to just +0.2% over the course of an hour. Cyclical sectors like Energy and Industrials lost all gains and Small Caps lost all of their gains, but a closing ramp got Small Caps green. Ms. Pelosi and Mr. Mnuchin met for 90 minutes but did not agree to a deal.
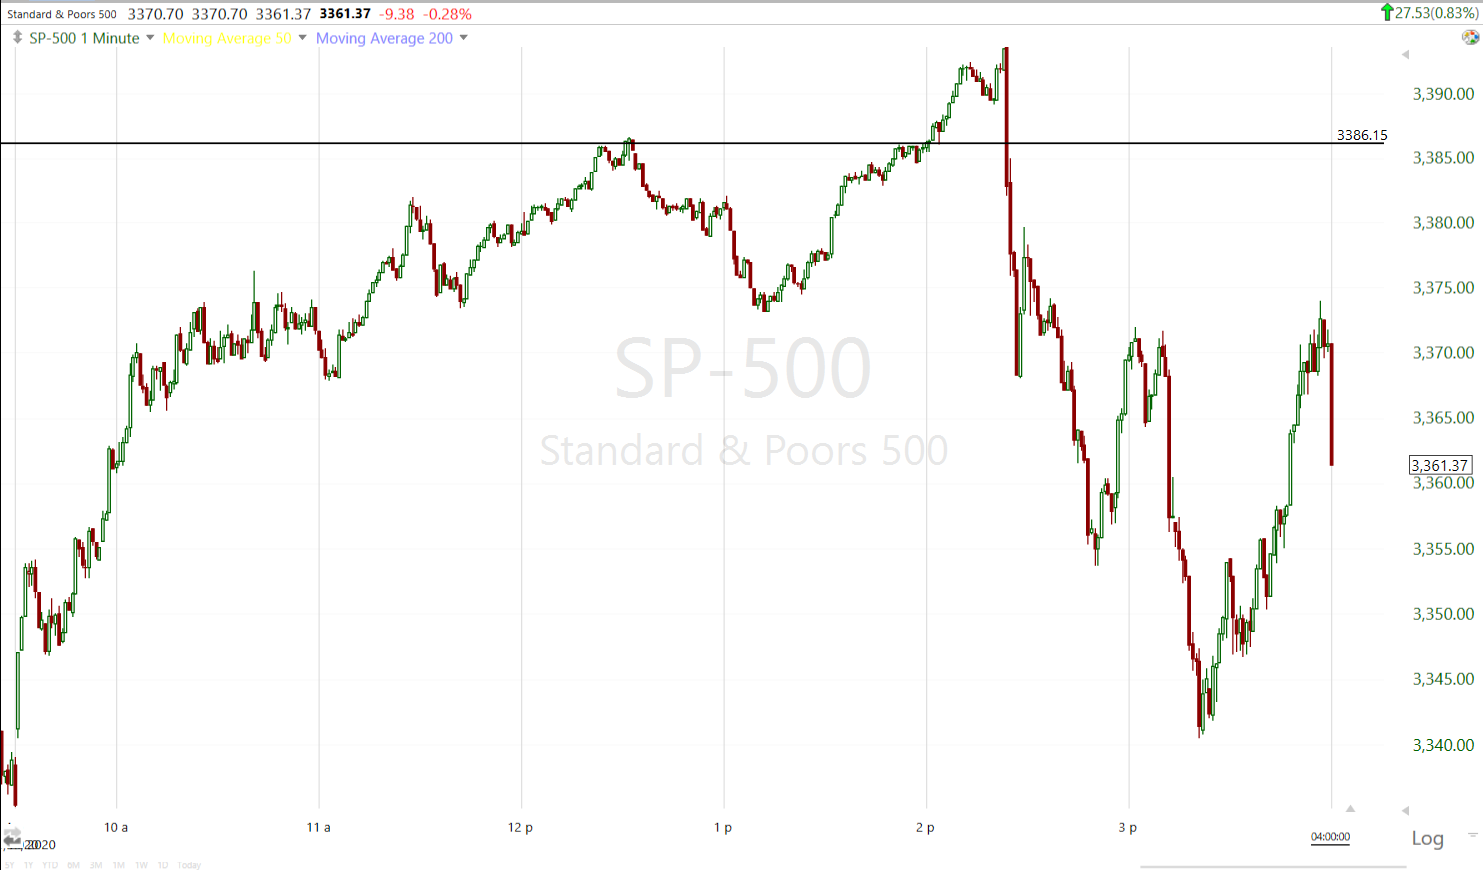
S&P-500 (1m today) filled the Sept. 17th gap and traded up to the Feb. closing high trend line before dropping in the afternoon and bouncing into the close.
In key corporate news, Walt Disney (DIS -1.0%) announced plans to lay off 28,000 employees due to the coronavirus still negatively impacting its business. Micron (MU -7.4%) issued downside EPS guidance for its fiscal first quarter.
Despite the market’s bounce from last week’s low, credit markets have not shown the same enthusiasm.
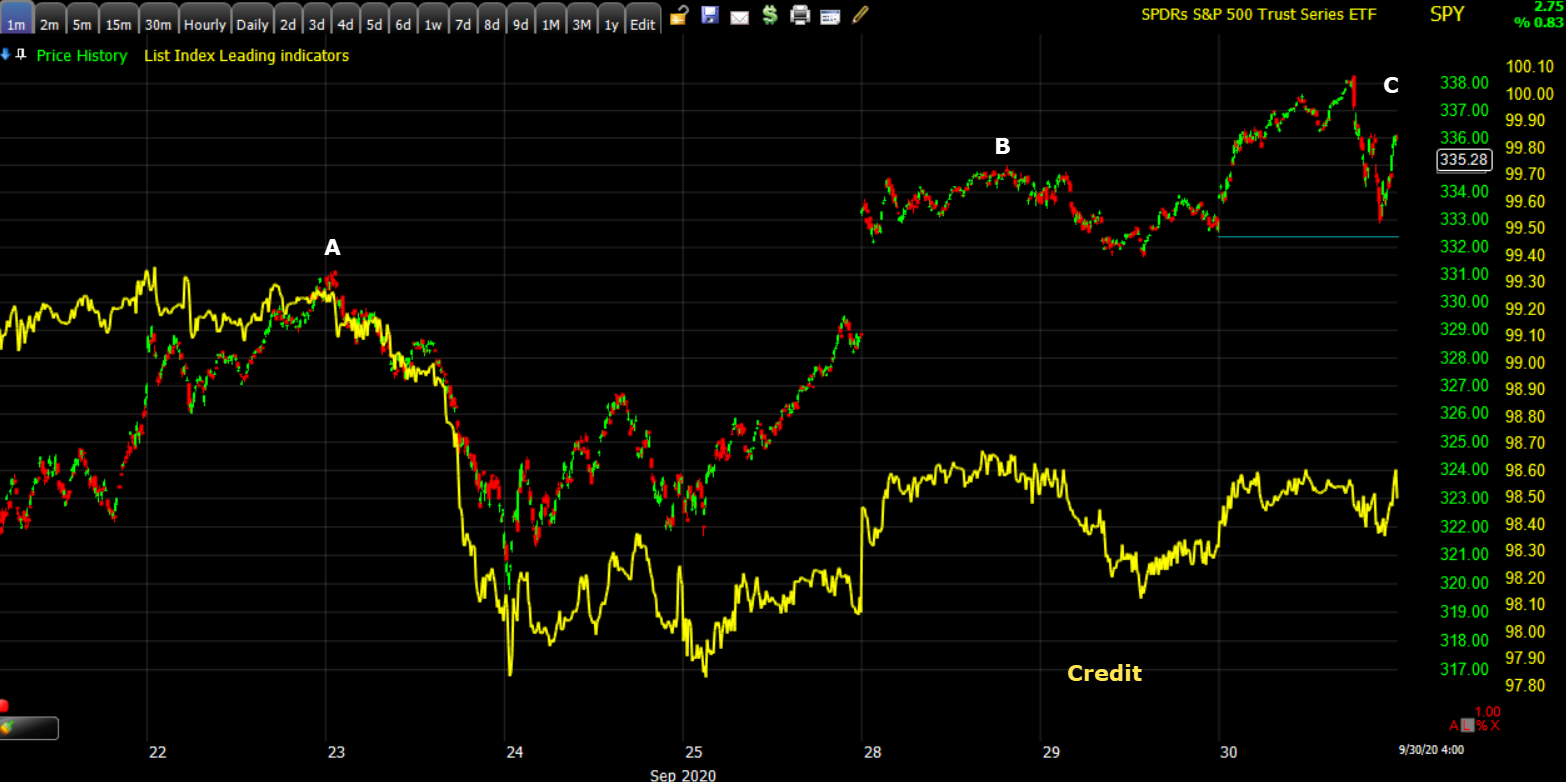 S&P has made two higher highs, credit has made lower highs.
Averages
The S&P managed to close just above its 50-day moving average, but it was not an impressive close. The benchmark index is less than a third of a percent higher than when it ran into the 50-day for the first time Monday. The Dow outperformed the benchmark S&P, while domestically focused Small Cap Russell 2000 lagged.
S&P 500 ⇧ 0.77 %
NASDAQ ⇧ 0.84 %
DOW JONES ⇧ 1.20 %
RUSSELL 2000 ⇧ 0.20 %
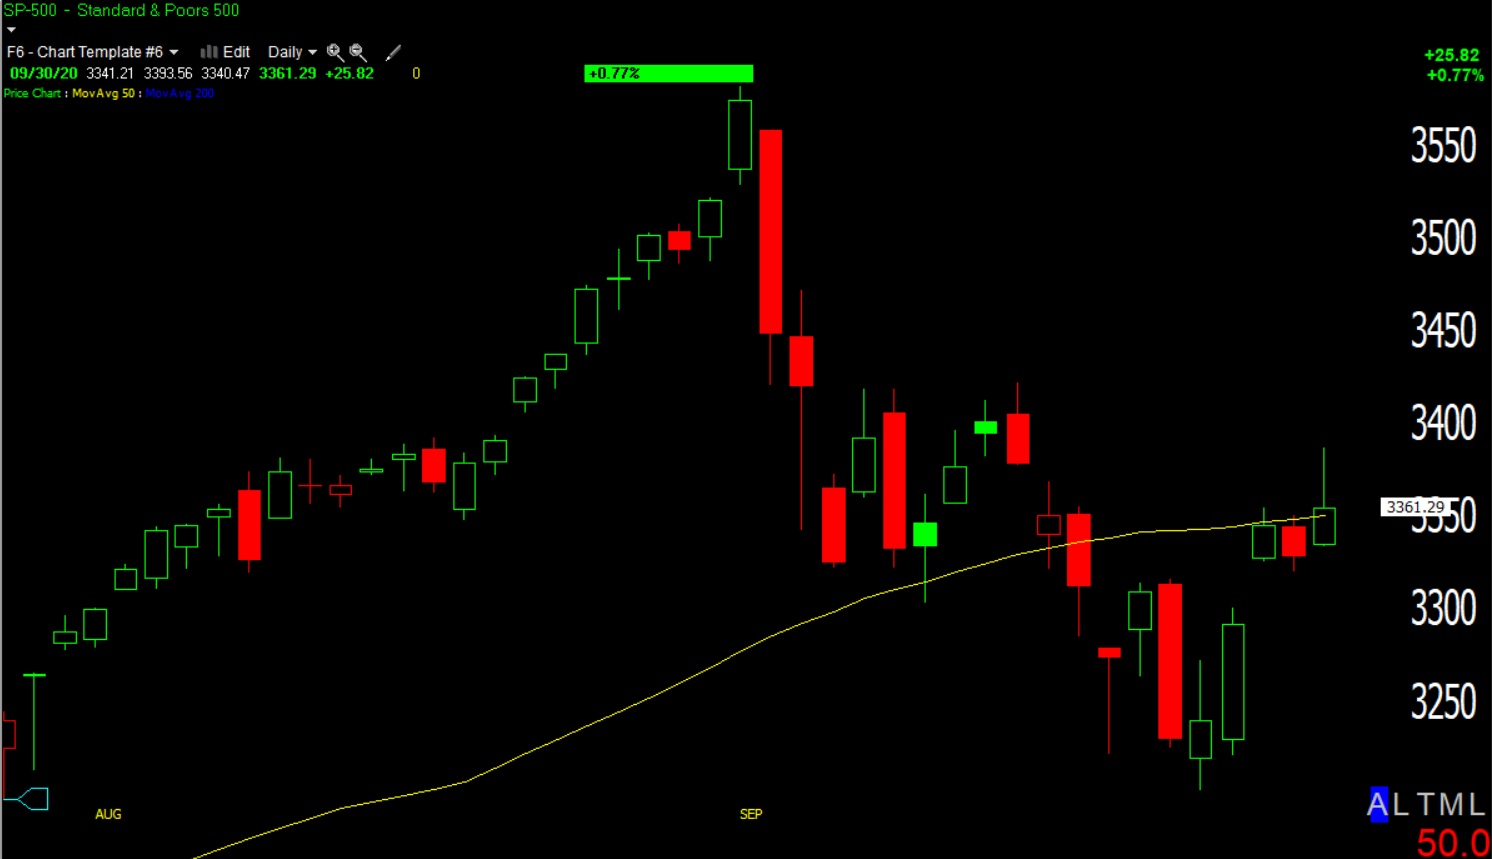 SP-500 (daily) leaving a long upper candle wick due to the failure to hold session highs. Price just barely closed above the 50-day.
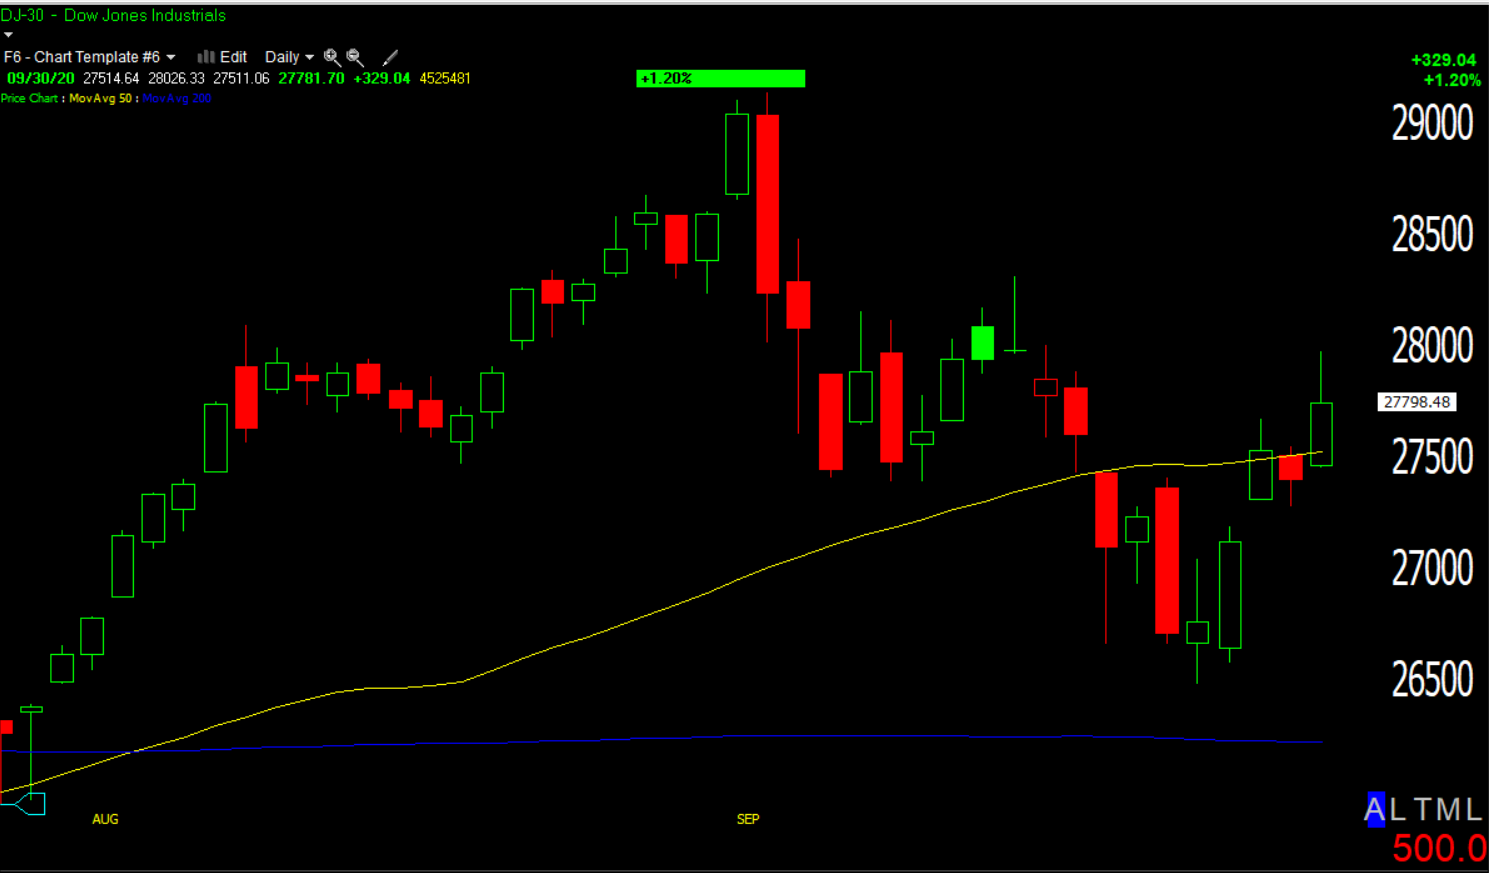 Dow (daily) left a long upper wick, but closed above the 50-day.
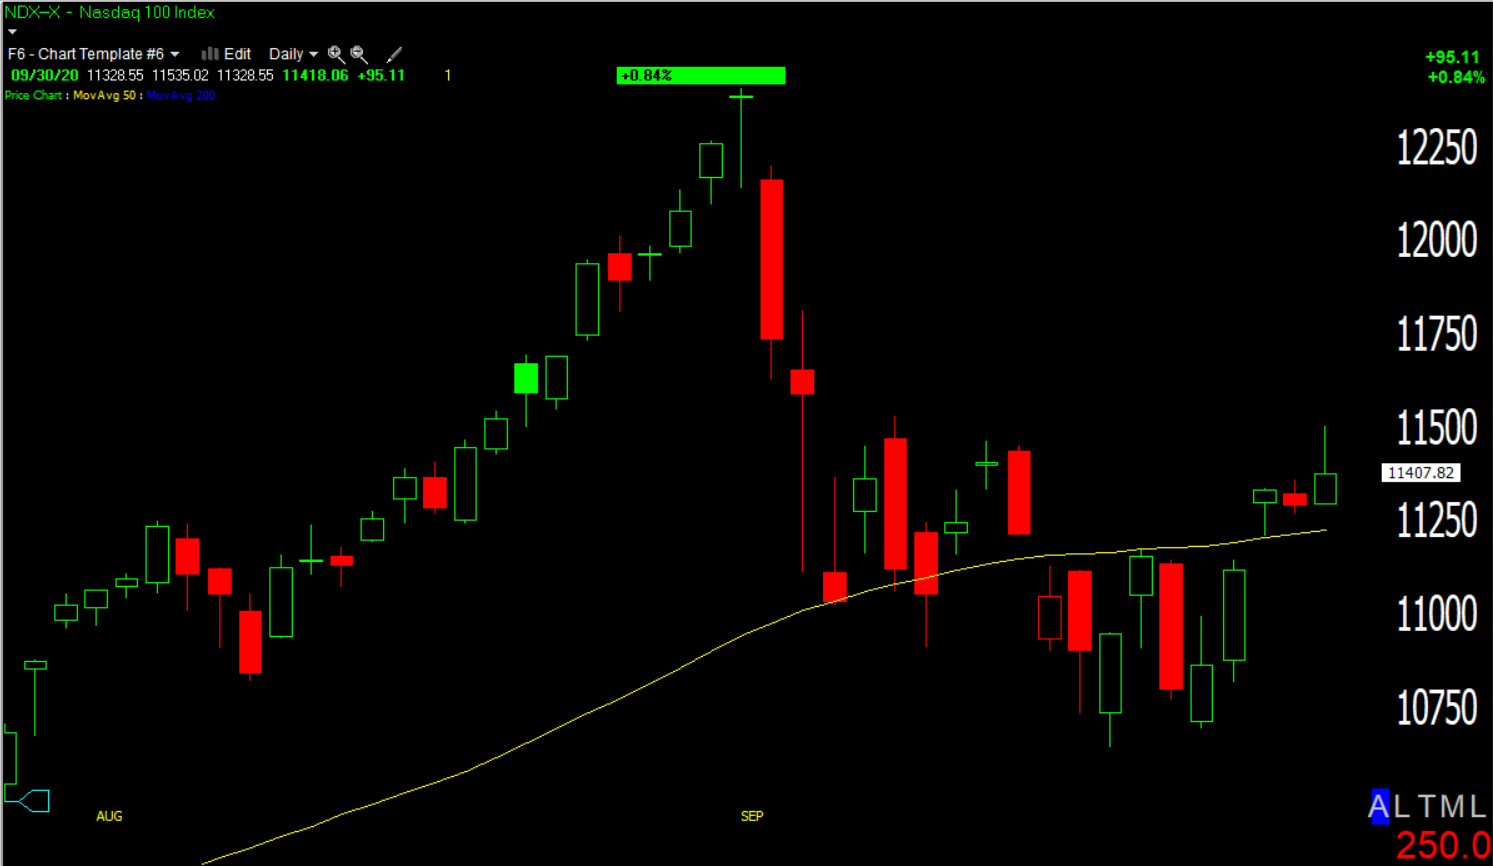 NASDAQ-100 (daily)
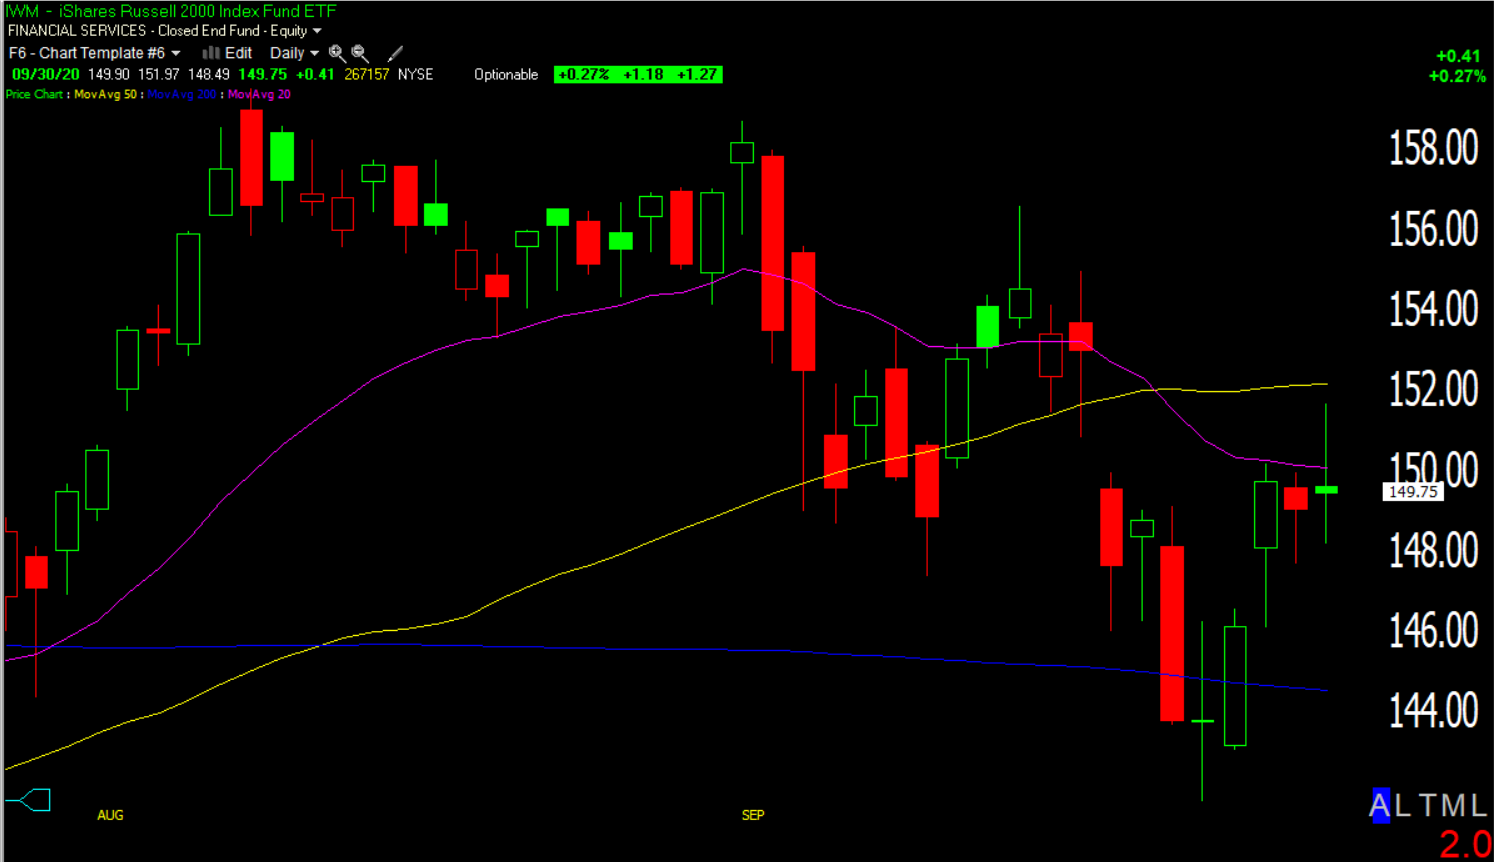 Small Caps/IWM (daily) posting a Start under resistance at the 20-ema for a third day
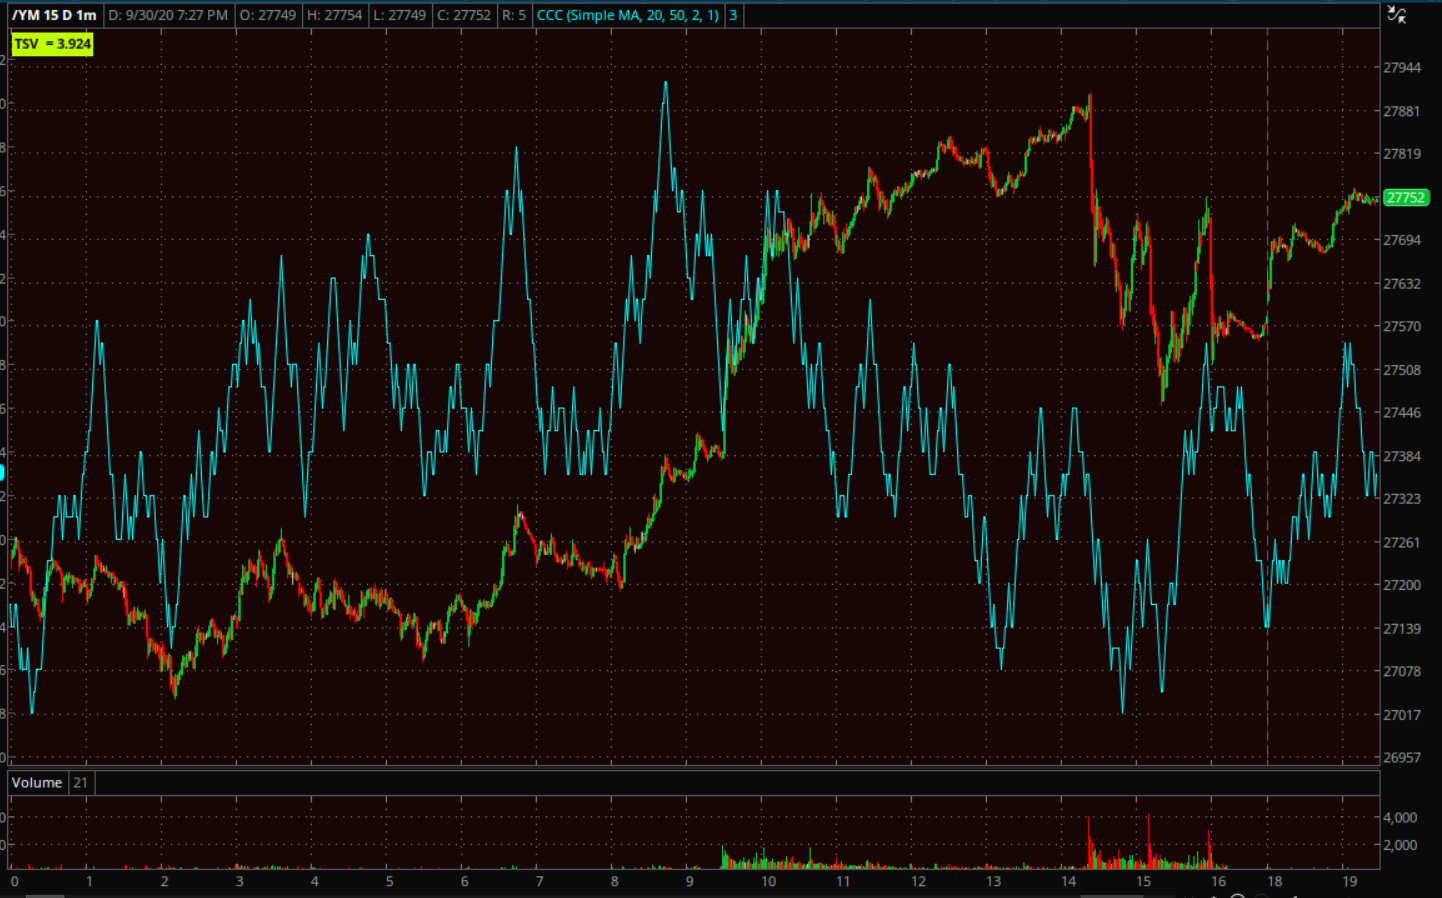
Dow futures’ put in a small negative 3C divergence this afternoon.
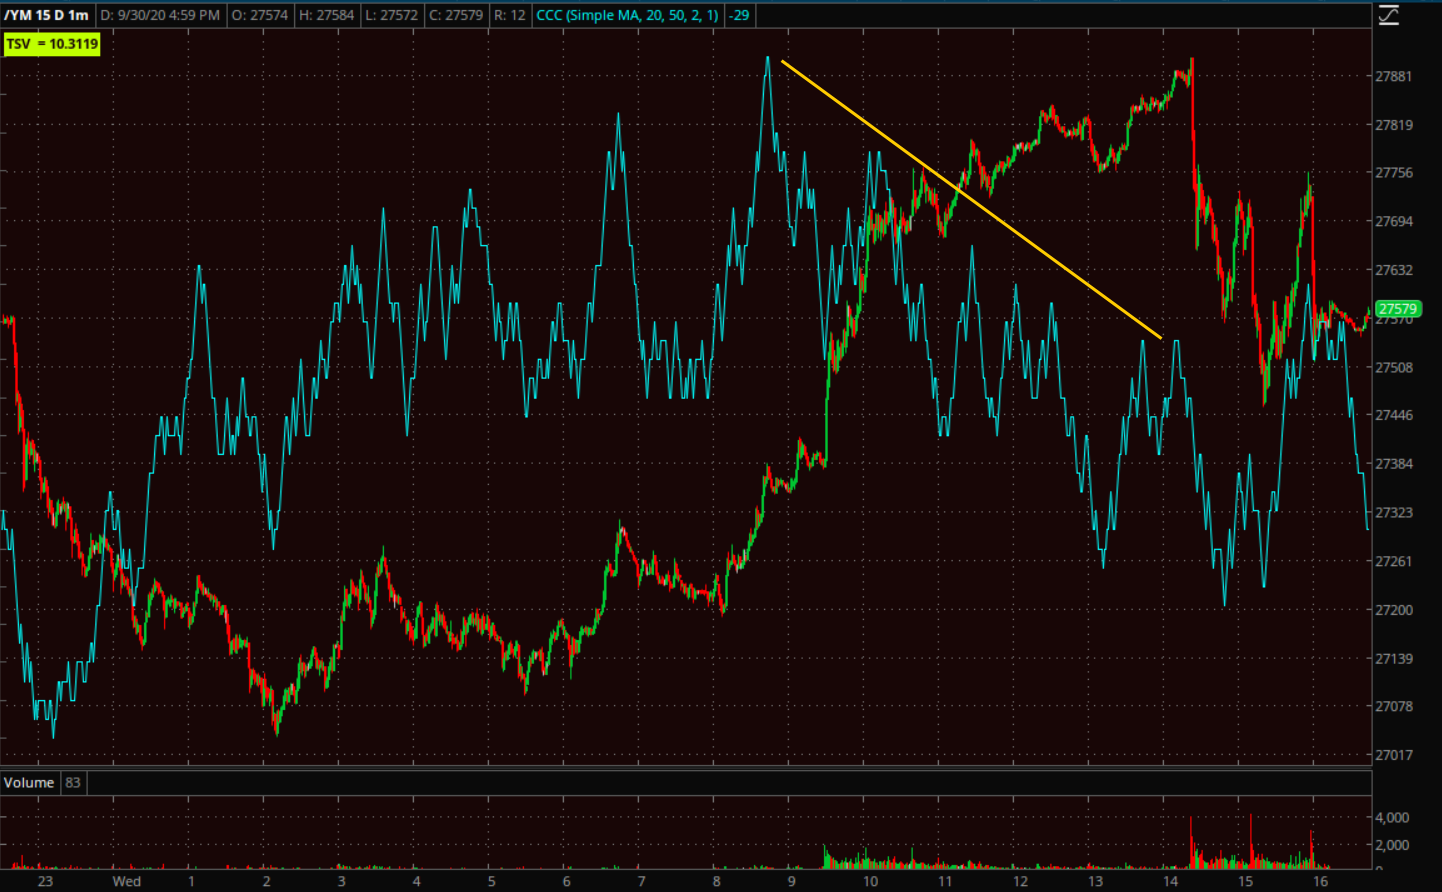 Dow futures (1m) – it’s similar in size and intensity to Monday afternoon’s which led to Tuesday’s pause and consolidation.
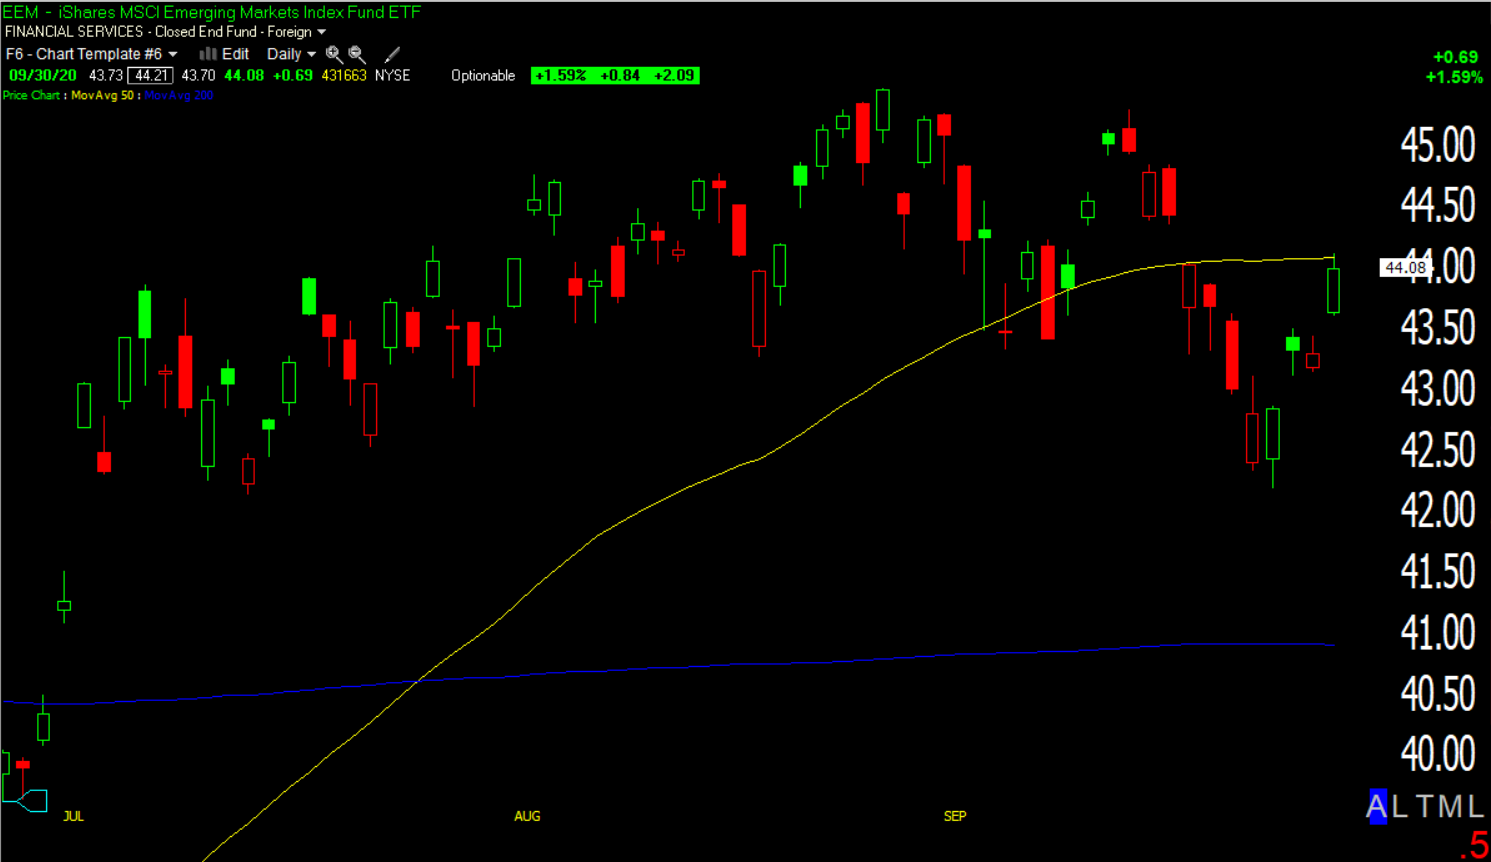 EEM/Emerging Markets (daily) bounced up to test the 50-day from below as anticipated. There are two gaps above around $44.50 and $45 that could still be filled. The EM currencies are a major edge and advantage for trading EEM and they’re very sensitive to the U.S. Dollar. The EM currency basket has a major zone of resistance 0.6% higher, the same amount it gained today.
S&P sectors
The early lead among cyclical sectors fell off in the afternoon with Energy and Industrials closing lower. Health Care was the best performing. The jump in yields and curve steepening supported the Financial sector’s outperformance.
Materials ⇧ 1.02 %
Energy ⇩ -0.30 %
Financials ⇧ 1.35 %
Industrial ⇩ -0.26 %
Technology ⇧ 0.84 %
Consumer Staples ⇧ 1.22 %
Utilities ⇧ 0.90 %
Health Care ⇧ 1.60 %
Consumer Discretionary ⇧ 0.82 %
Real Estate ⇧ 0.51 %
Communications ⇧ 0.07 %
The Energy sector started off strong for the second time this week, but it just can’t get out of its own way and remains at the low end of a bearish flag.
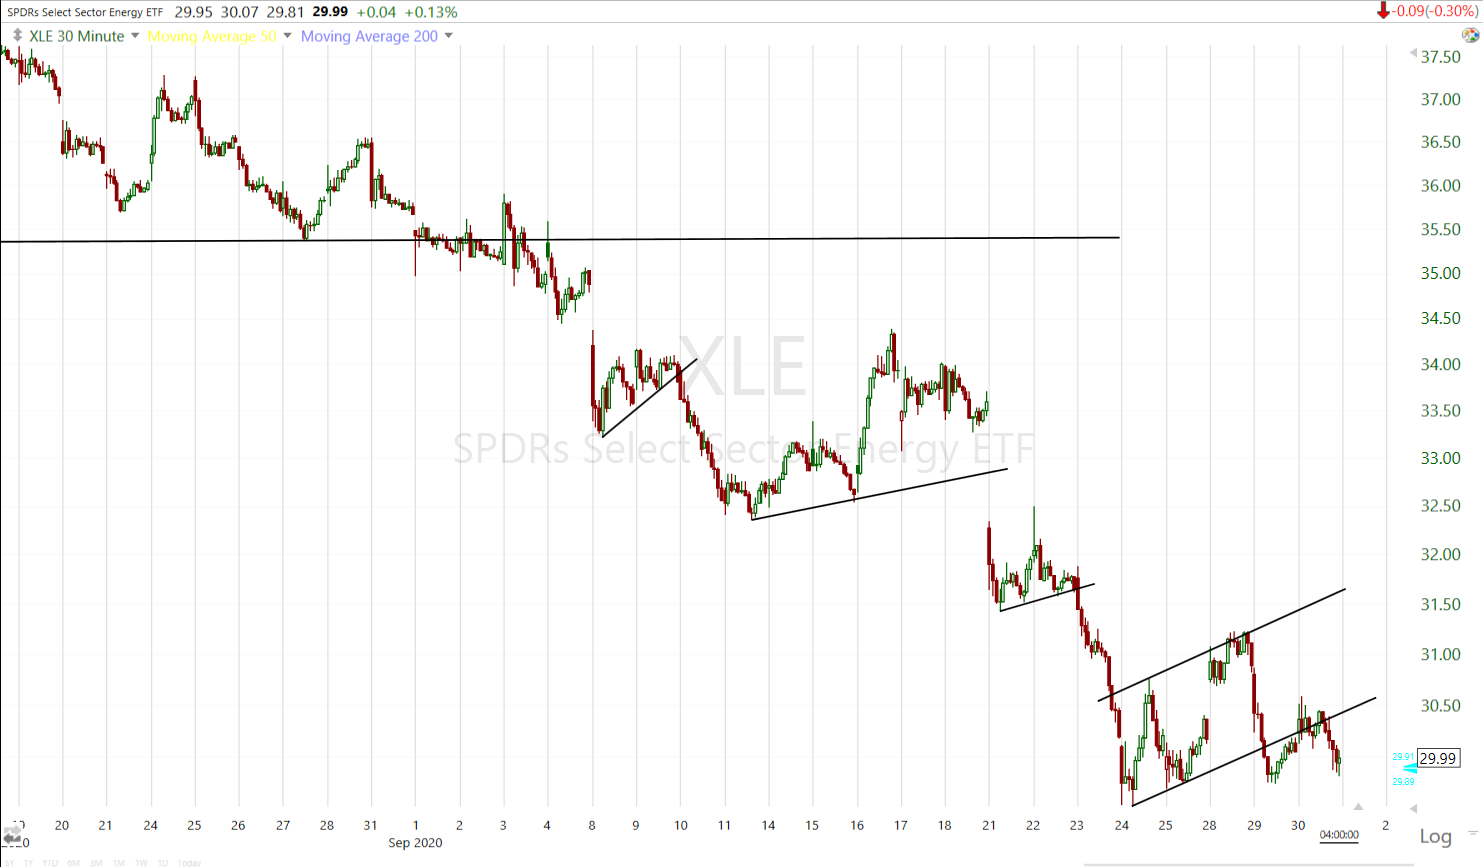 Energy sector (30m)
And despite performing fairly well today, the KBW Bank Index (+1.33%) hasn’t yet been able to test its 50-day from below.
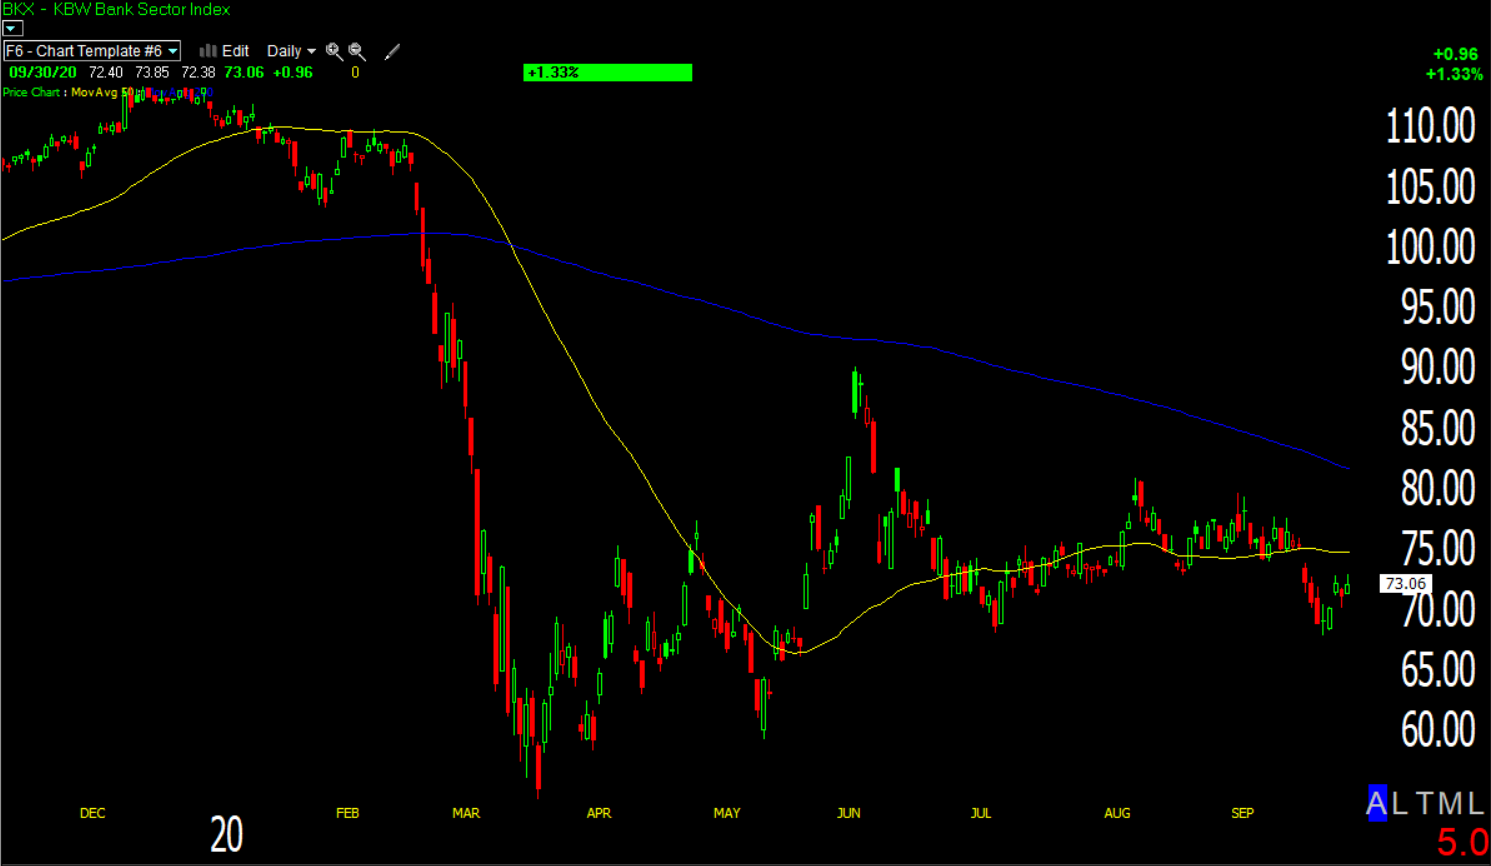 KBW Bank Index (daily) below its 50-day and declining 200-day moving averages.
Internals
NYSE Advancers (1546) just barely edged out Decliners (1422) on heavy month and quarter end volume of 1.3 bln. shares.
The Dominant price/volume relationship is not comparable due to the month end volume skew.
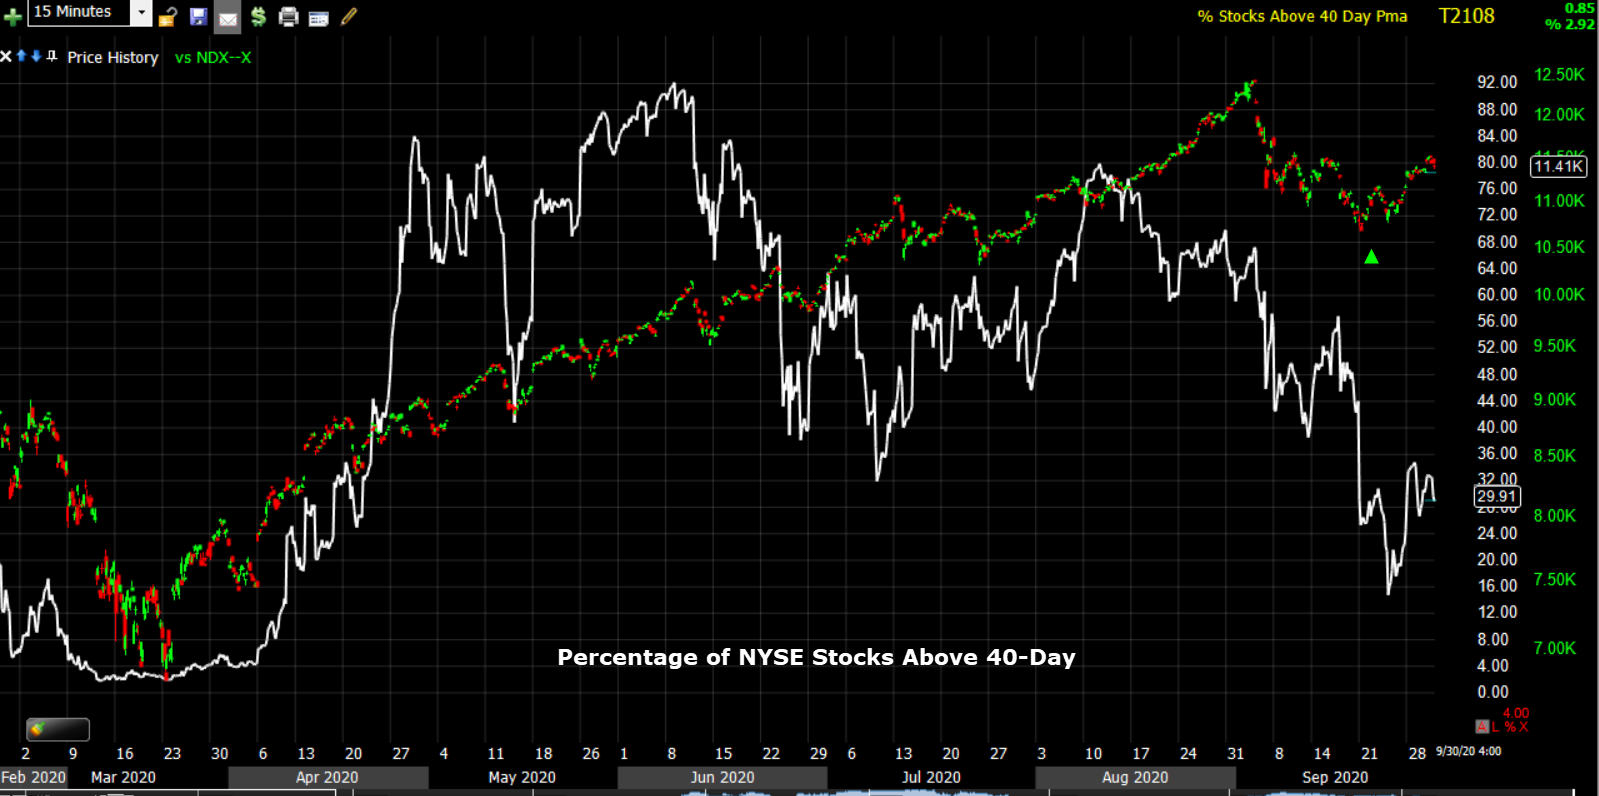
There are no major developments in market breadth today other than last week’s deep oversold condition being alleviated. The bounce off last week’s low hasn’t done much to repair the breadth damage that has escalated since June.
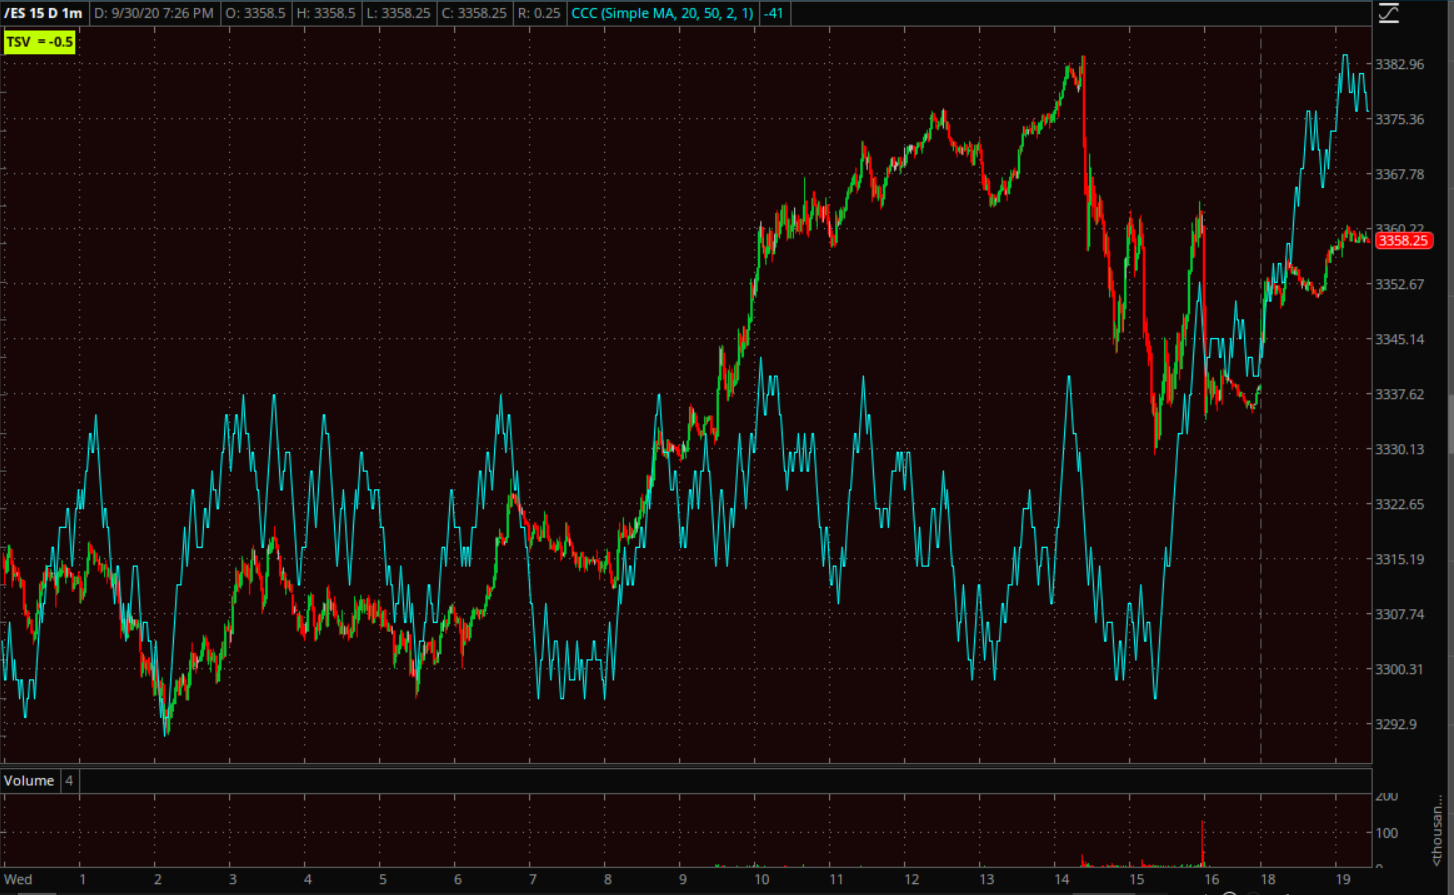
 SP-500 (15m from the March low)
Treasuries
Treasuries have been sleepy the last month. Yields spiked this morning following the generally strong economic data, but reversed perfectly to unchanged for September around 70bps after McConnell poured cold water on stimulus hopes. The 2-year yield increased two basis points to 0.13%, and the 10-year yield increased three basis points to 0.68%.
With stocks up and bonds down today, the opposite of the month of September, there may very well have been some month-end rebalancing at work. If Treasuries fall again tomorrow, that will help the banks and Financial sector (and the broader market). Should treasuries retrace today’s decline and move higher, it will be a headwind for those sectors (and the broader market). I haven’t mentioned Treasuries much recently because they have done next to nothing for the last month, which has been frustrating, but they often provide excellent market signals.
Currencies and Commodities
The U.S. Dollar Index declined -0.1% to 93.84. Lets not forget that it was the dollar running into key resistance and pulling back that allowed the major averages to bounce. The pull back in the Dollar Index is constructive which means probabilities are that it will make another run higher at that resistance sooner than later.
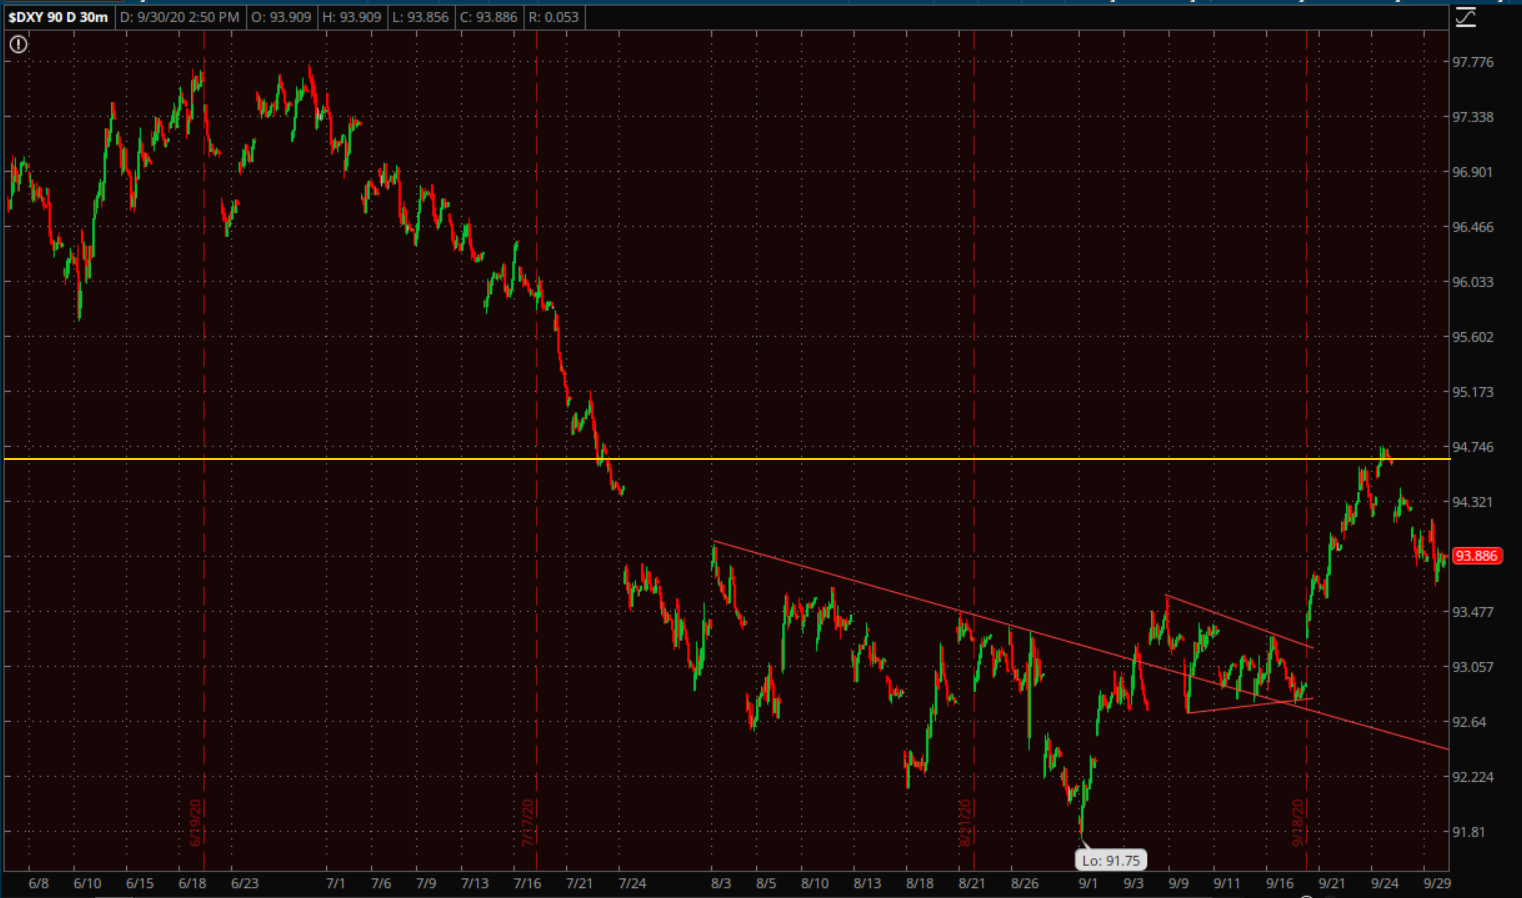 U.S. Dollar Index (30m) with a bullish consolidation/pull back this week. It’s actually a shallow pull back. The Dollar Index could come down more and still be bullish and constructive.
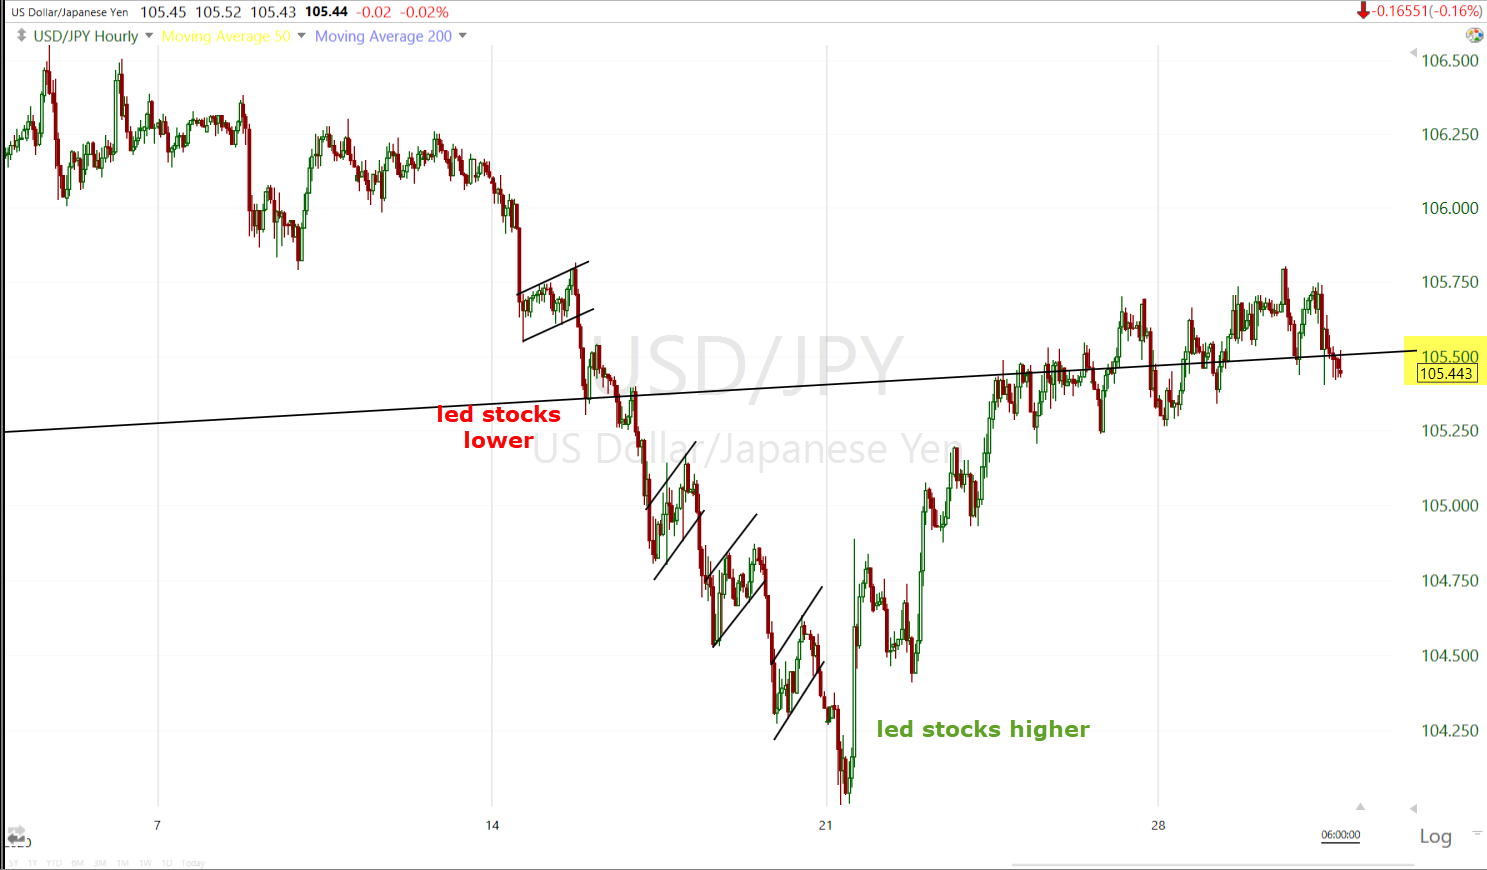
USD/JPY (60m) has been an outstanding market signal as it led stocks lower early in September, and led stocks higher from early last week. The $105.50 level has been an important demarcation between risk-on and risk-off recently and it’s sitting right there all week while the S&P has done next to nothing since Monday.
WTI crude futures rose +2.6% to $40.21/bbl. The price action in oil still has a near term bearish bias.
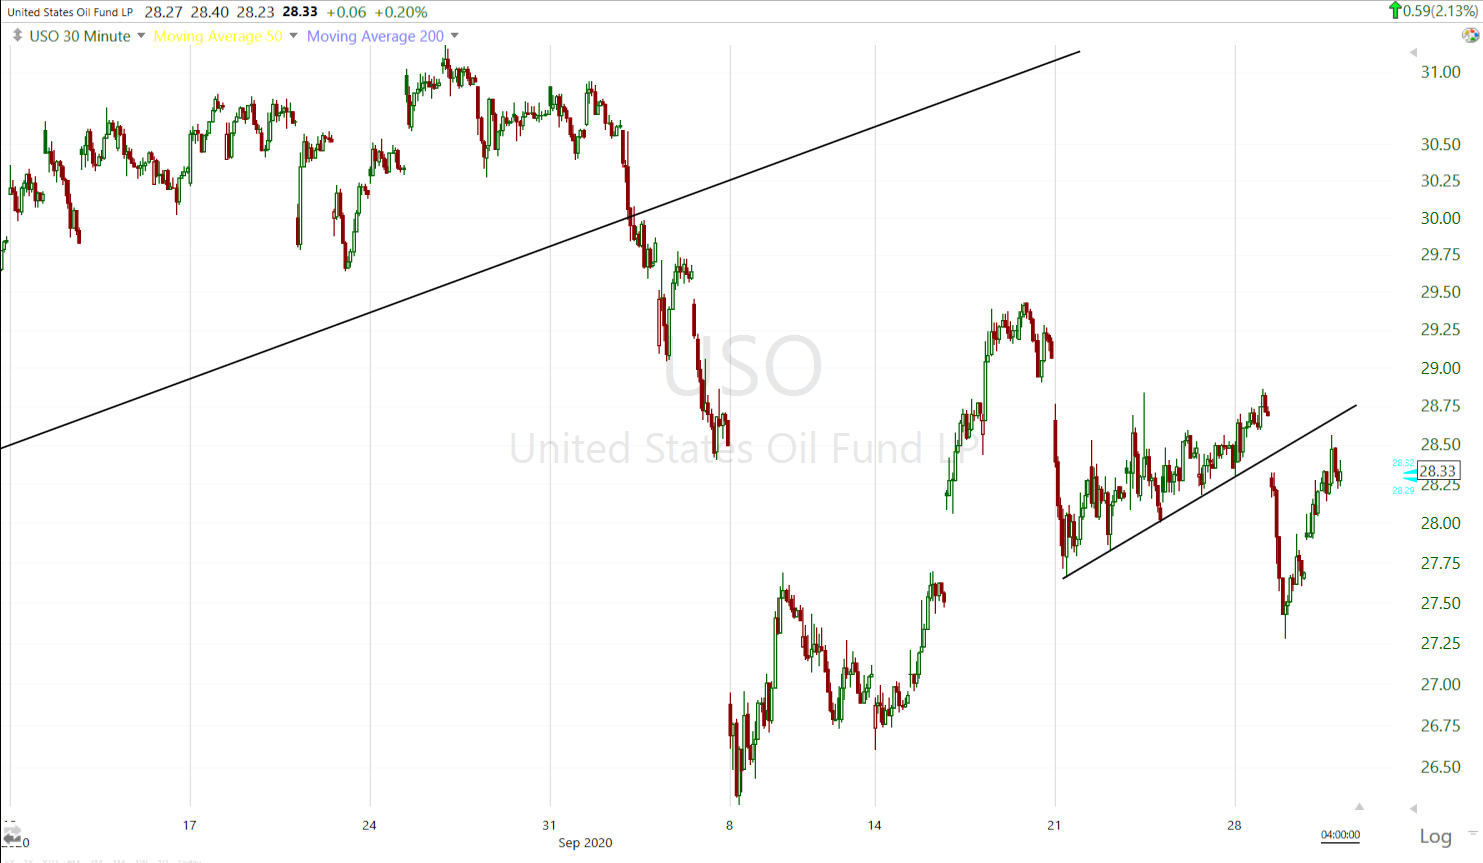 USO (30m) below the bearish consolidation that started the week.
Gold futures fell -0.4% to $1,895.50/oz. Gold settled -4.2% lower on the month, trimming its quarterly gains to +5.3%.
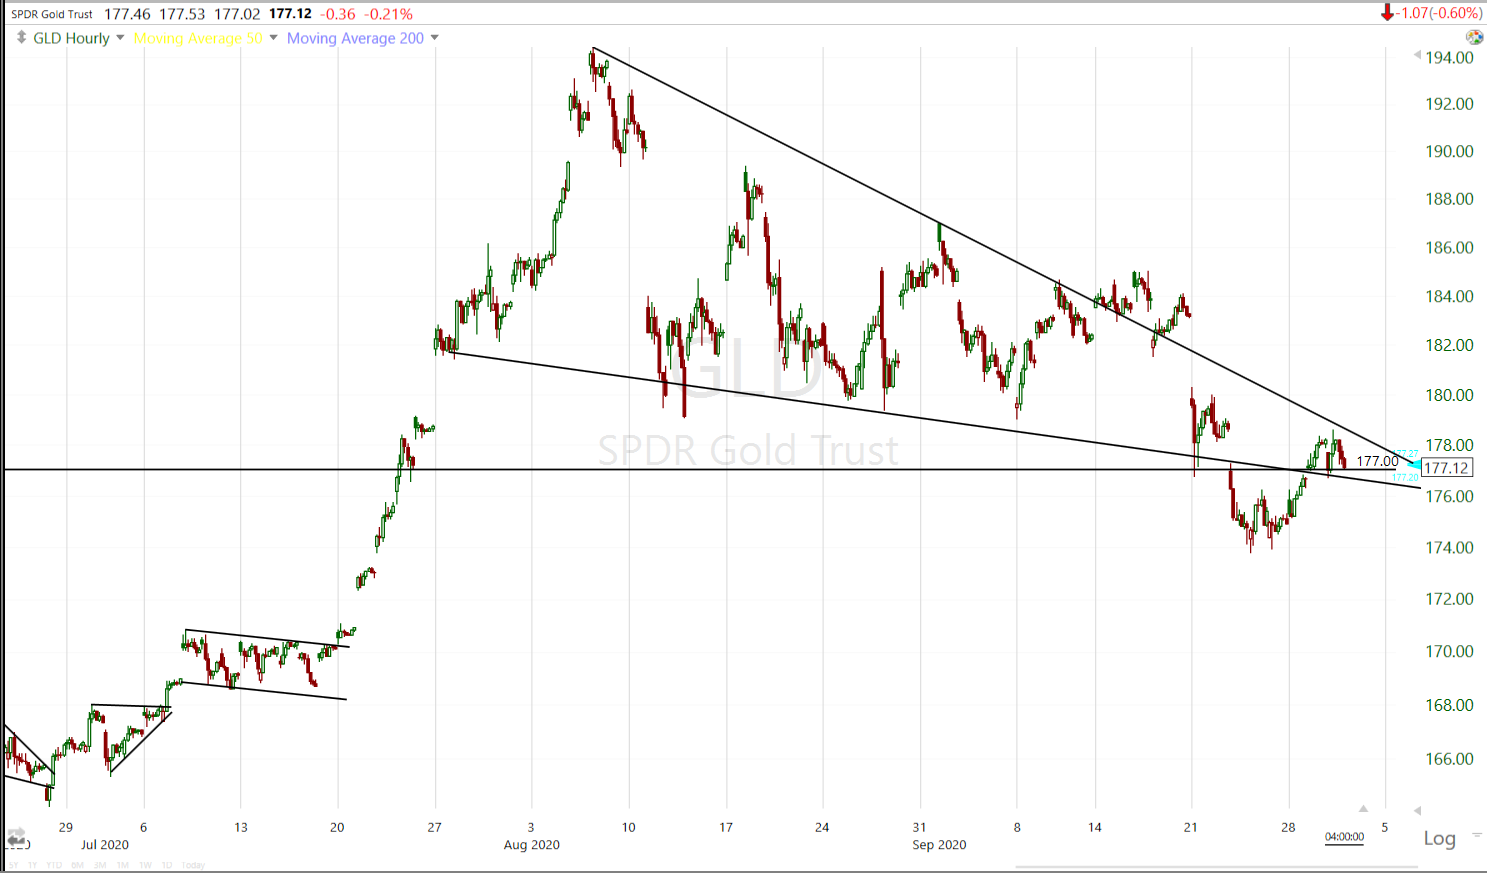 GLD (60m) the price volatility from the break below the bullish consolidation is starting to calm down. In my view GLD needs to spend some more time between last week’s low (stay above) and below the trend line at $178.50- in other words, near $177. I think Gold is looking better. It would have been best had GLD not broke below the consolidation, but it wasn’t a horrible break. It was a horrible break for gold miners and silver. I think they both still have some work to do, which reflects on gold.
The Dollar advancing again is still a major risk for gold, gold miners and silver. A long position could be taken here around $177 and down to $174, but I’d have a tight stop under $174. I think we’ll see more definitive price action in the next few days.
Summary
I see no edge in being long or short the market at the moment, see USD/JPY above, at $105.50 it represents the probability of little movement either way. The S&P has gained less than a third of a percent since Monday’s close. For me, a position right now is just open risk for low probabilities. It’s time for patience to wait for a high probability, low risk set-up with strong market signals. The Dollar Index is the most important as it currently has the highest correlation and the most influence. The Japanese Yen futures started looking a little stronger this afternoon so perhaps we see some movement in USD/JPY. VXX’s 3C chart improved more this afternoon, ironically just hours before the averages plunged from session highs.
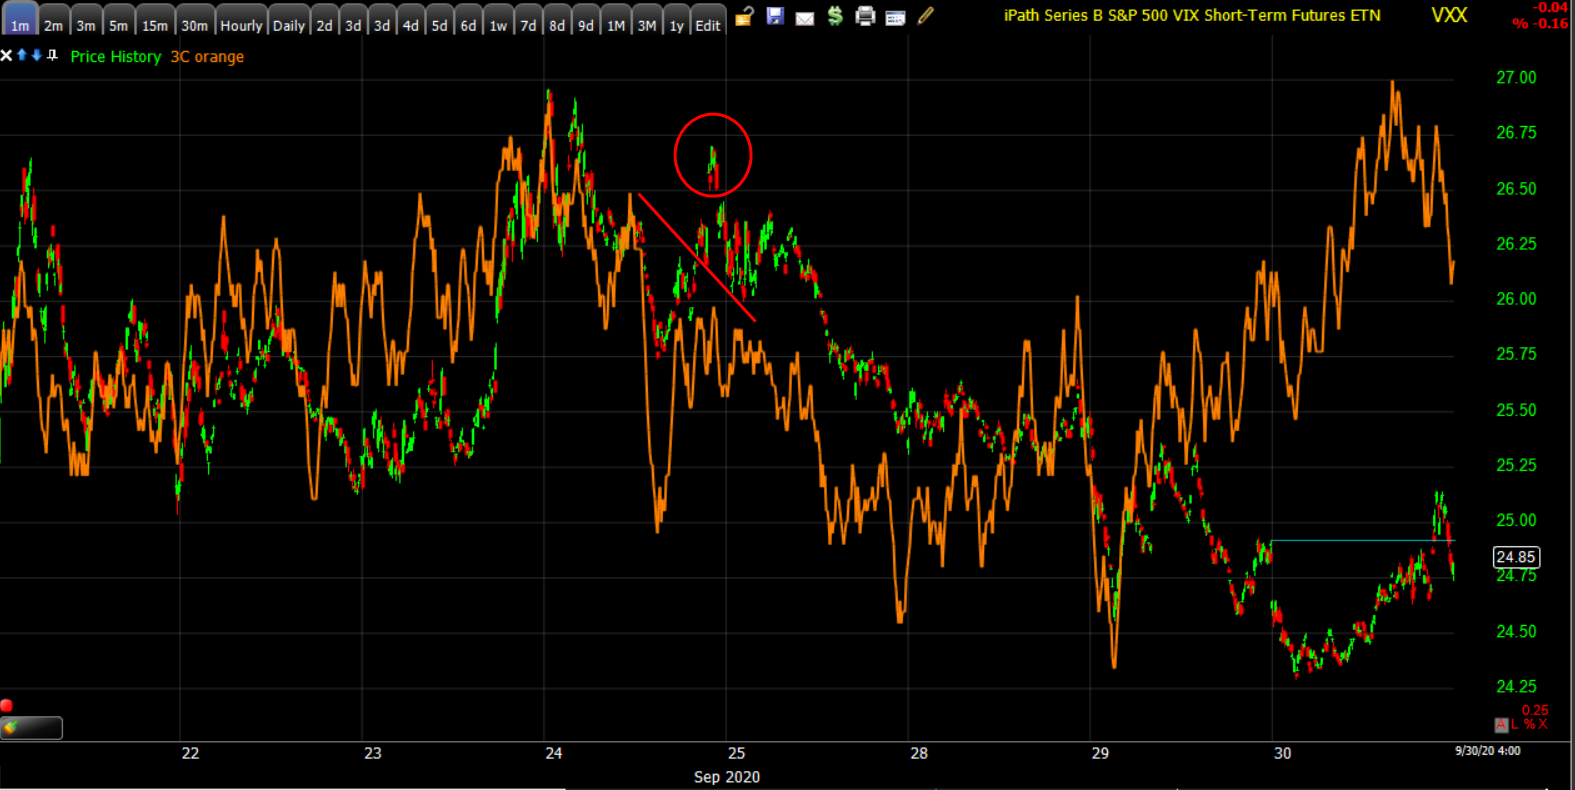
VXX (1m) signalling the probability of a pull back at the end of last week, and now posting a new positive digerence that started yesterday before the Presidential debates. It likely is partly due to the averages trading near or testing at technical resistance.
Credit is another area to watch. It has done just enough as to not be a red flag for the week’s bounce in stocks, but hasn’t shown any enthusiasm to the upside at all. Yields could also be an important and useful signal, they’ve just been asleep at the wheel for the last month.
That’s not to say the market didn’t do some useful things so far this week, it worked off a really deep oversold condition. The S&P filled a major open gap. EEM/Emerging markets bounced up to the 50-day. I wouldn’t have even considered new short trades if those things didn’t happen first.
I suspect that if there’s going to be notable movement, it will be at or around the key data point this week, the Jobs report on Friday. Keep in mind that there’s a large NASDAQ futures speculative short position. It doesn’t have to be squeezed, but any decent move higher in NASDAQ could trigger a squeeze in those shorts. As far as new shorts, NASDAQ seems like an attractive trade because of how weak it has recently been, but that’s recency bias. I more interested in EEM and I’m leaning more toward IWM among the U.S. averages presently. If Energy/XLE would get a decent bounce and trade above $31 to $32, it would be higher on my list.
October is shaping up to be a volatile month. It’s a month that usually sees a lot of movement anyway due to the October 31st mutual fund deadline to make distributions by year end, for tax purposes and investors getting set for year end. Throw on top of that the U.S. elections in early November. According to Bloomberg, on average the S&P 500 has lost 2.5% in October over the past seven election years (since 1992), the worst performance of any month during those years. Then there’s the crash stigma of October with some of the most historic crashes in history – 1929, 1978, 1987 and 2018.
Overnight
S&P futures are up +0.2% tonight, 3C looks better since the cash close, at least for ES (not so much Dow futures).
S&P futures (1m) 3C was a little soft at sesion highs, not as much as Dow futures. Since the close there’s a leading positive divergence heading into the overnight session.
Dow futures (1m) not much change since the close for 3C.
Markets in China, Hong Kong, Taiwan and South Korea are shut for holidays so volume is likely to be light.
WTI crude is down -0.5% as prices start consolidating following the day’s gain.
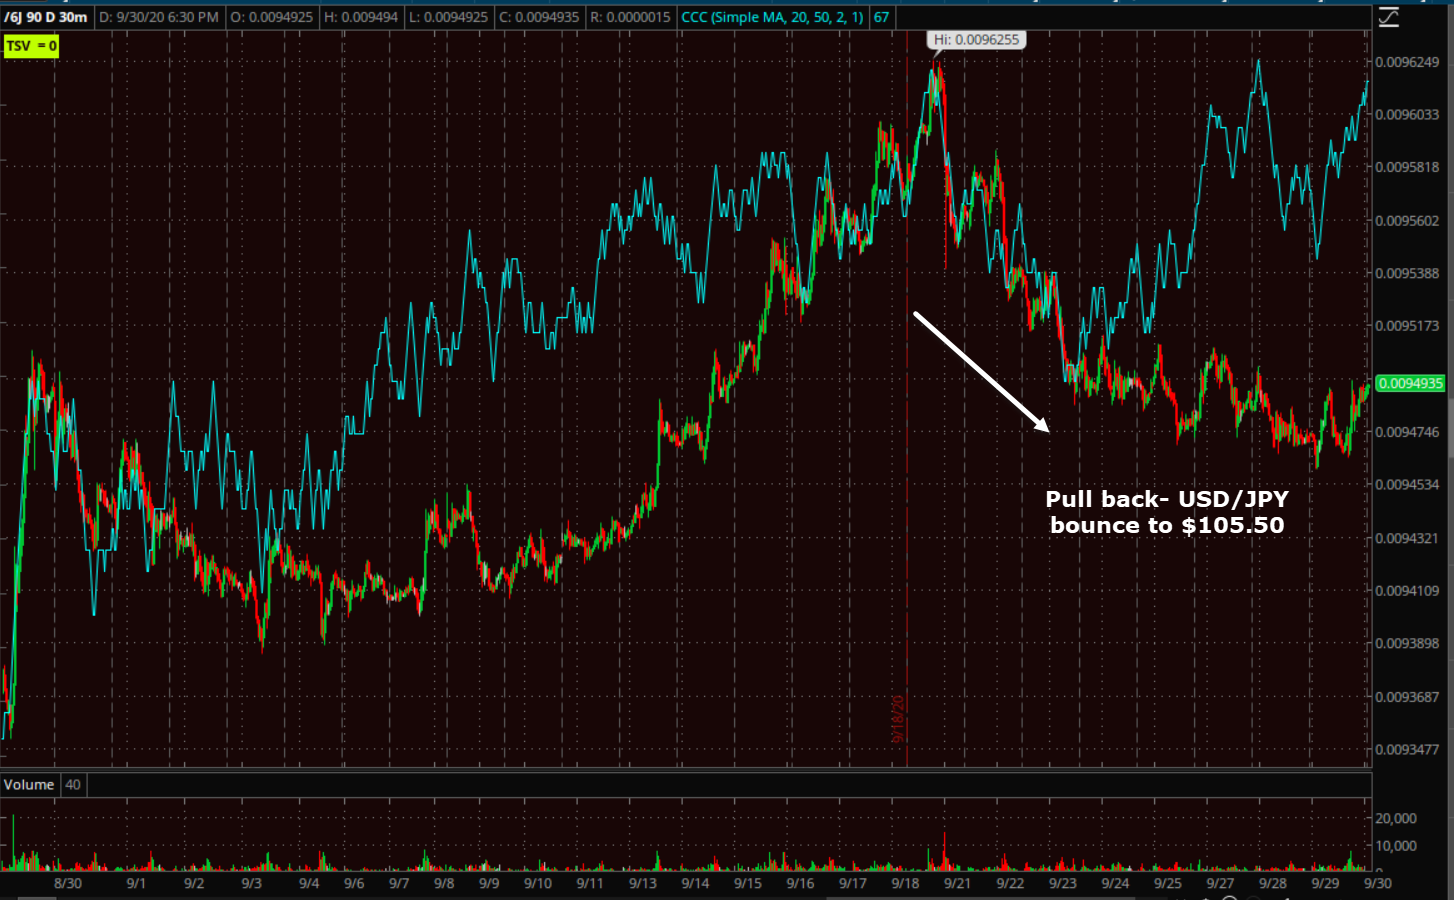
Japanese Yen futures (30m). The advance to the left side of the chart is safe-haven flows in September leading the stock market lower. The yen pulled back at the start of last week and led stocks higher into this week. As it has pulled back, 3C looks constructive in the safe-haven currency so I suspect there’s a pretty good chance we’ll see a safe-haven move and USD/JPY drop before too long. The intraday 3C charts of the Yen futures were more active today than they have been in a week.
Tomorrow investors will receive the ISM Manufacturing Index for September, the Personal Income and Spending report for August, the weekly Initial and Continuing Claims report, and Construction Spending for August on Thursday. Friday is the key data point, Payrolls.