Stock Market Daily Wrap
Averages bounced back today primarily driven by renewed stimulus hopes and secondarily by coronavirus-related optimism.
After yesterday’s Trump tweet effectively ended stimulus negotiations until after the election and the market decline associated with it, the S&P and NASDAQ held close enough to their 50-day moving averages. By the overnight section of the Daily Wrap there were positive divergences on index futures’ charts and a negative divergence on VIX futures’, further suggesting the averages hold up ahead of the FOMC today.
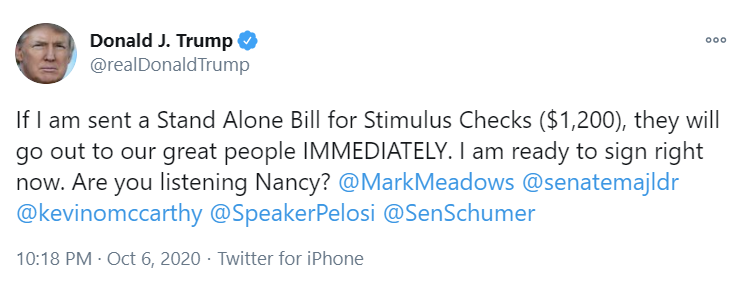
The President sent out a massive tweetstorm last night, among other things indicating he would sign standalone, piecemeal stimulus bills.
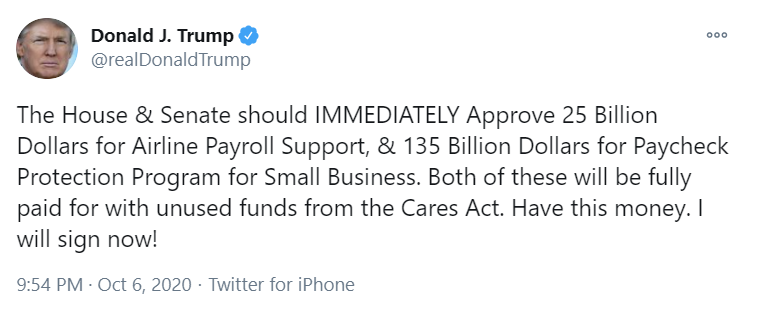
Nancy Pelosi signaled openness to an airline-relief bill in talks with Steven Mnuchin after President Trump scuttled broader negotiations.
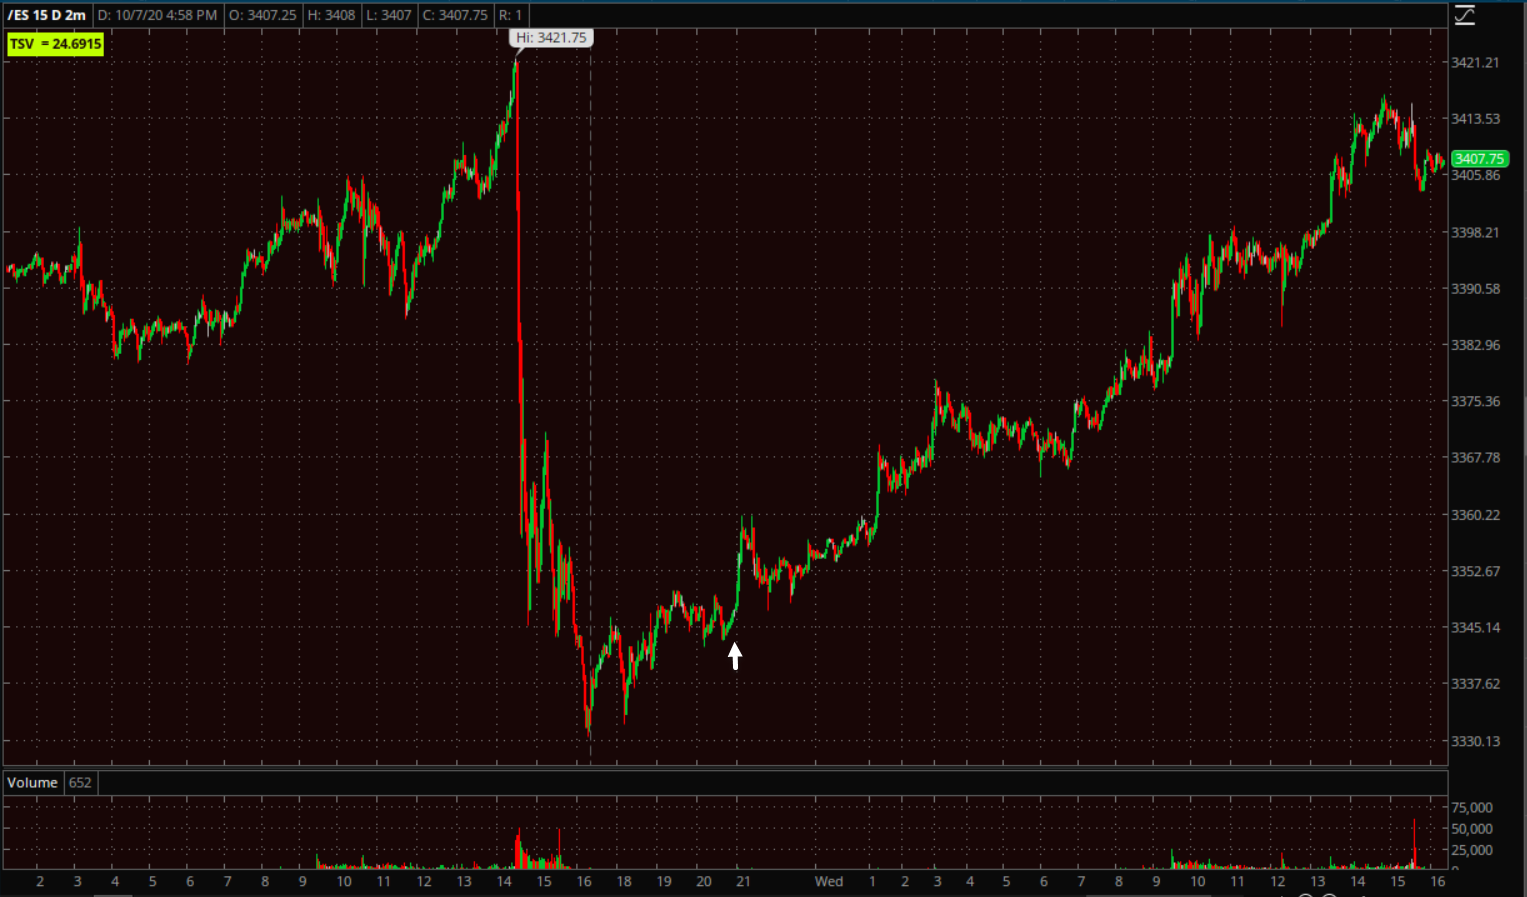 S&P futures (2m) shows yesterday’s collapse and when the tweets were issued (white arrow) overnight. The averages went on to retrace most of yesterday’s plunge, only the Dow retraced all.
A lot of the momentum for the gain was fresh shorts chasing yesterday’s decline, getting squeezed today.
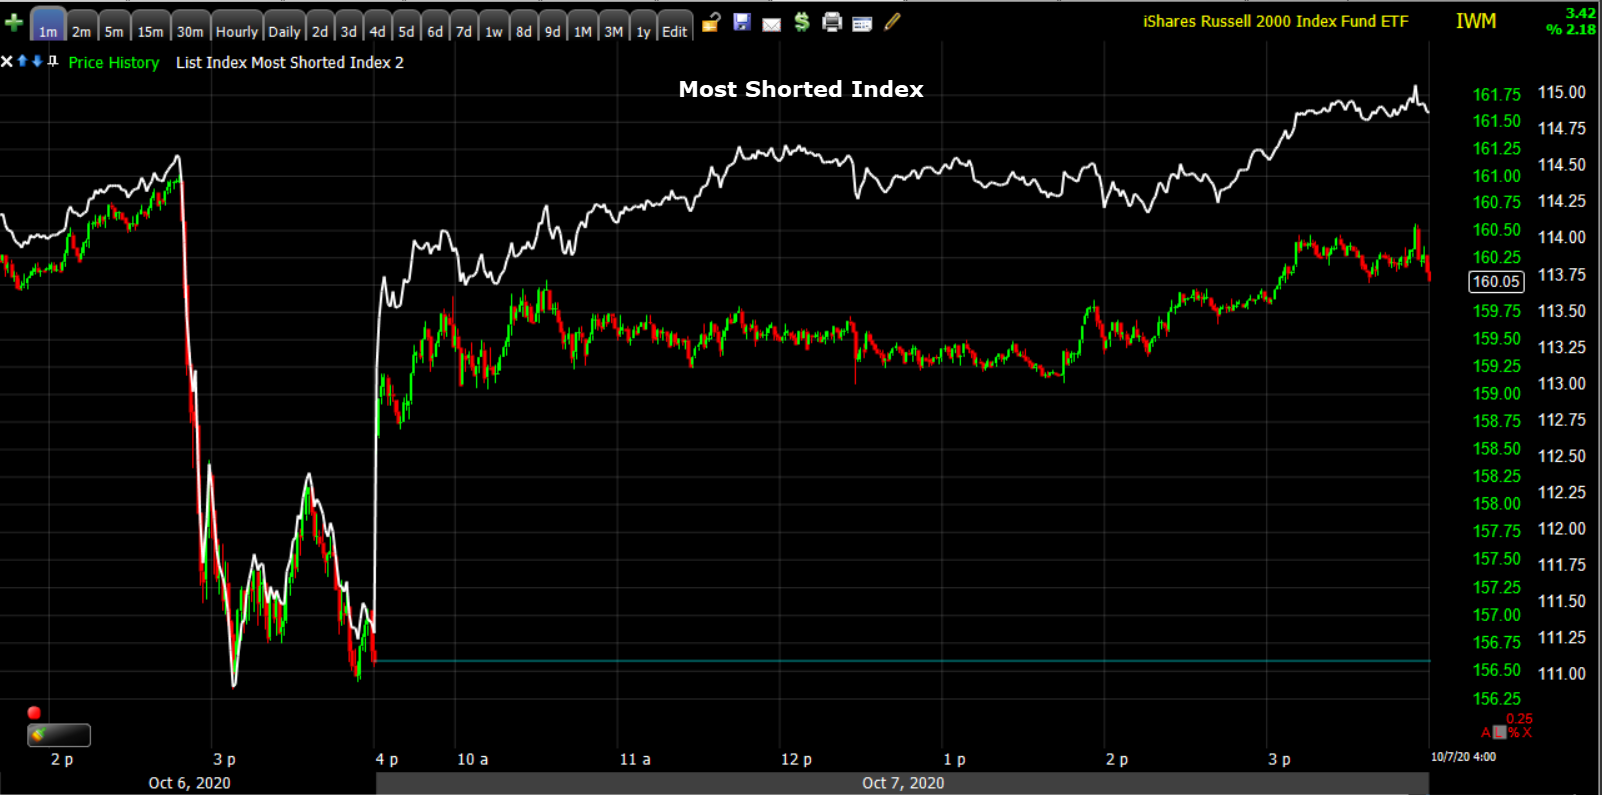
Small Caps (1m) and Most Shorted Index (white). Short squeezes have occurred 8 of the last 9 days, marking the largest squeeze since the early June rotation attempt to cyclicals/value.
On a side note, this is a really easy trap to fall into. Traders see prices plunge and chase the decline, then get squeezed like today. Not every time, but a majority of the time other asset classes will confirm a really serious break. In the current market that may be the U.S. Dollar Index above $94, or USD/JPY plunging well below the trend line near $105.50. Many times those market signals will come while stocks don’t seem to be in immediate trouble, and those are my favorite set-ups that usually offer the best risk/reward and timing.
Additionally contributing to bullish sentiment was news that Eli Lilly (LLY +3.4%) requested emergency use authorization for its COVID-19 antibody treatment.
The FOMC Minutes for the Sept. 15-16 meeting provided no surprises and there was little perceptible reaction from the market. Fed officials expressed concerns regarding a recovery if there is no more fiscal stimulus and remained in agreement that the current environment is disinflationary.
In economic data, Consumer Credit for August contracted marking the sixth straight monthly contraction in revolving credit, which is something that hasn’t happened since late 2010 – early 2011, underscoring the more restrictive credit stance adopted by lenders in the wake of the COVID shutdown and rise in unemployment. The weekly MBA Mortgage Applications Index increased 4.6% following a 4.8% decline in the prior week.
Signs are mounting the coronavirus is returning to the New York area, with infections reaching a three-month high. France reported a record number of new cases and Italy’s infections spiked to the highest since April.
Averages
Small Caps outperformed again. Short squeezes typically benefit small caps more than the other averages and we’ve had 8 squeezes in the last 9 days. However, as the day went on, the other averages closed the relative performance gap.
S&P 500 ⇧ 1.72 %
NASDAQ ⇧ 1.88 %
DOW JONES ⇧ 1.91 %
RUSSELL 2000 ⇧ 2.14 %
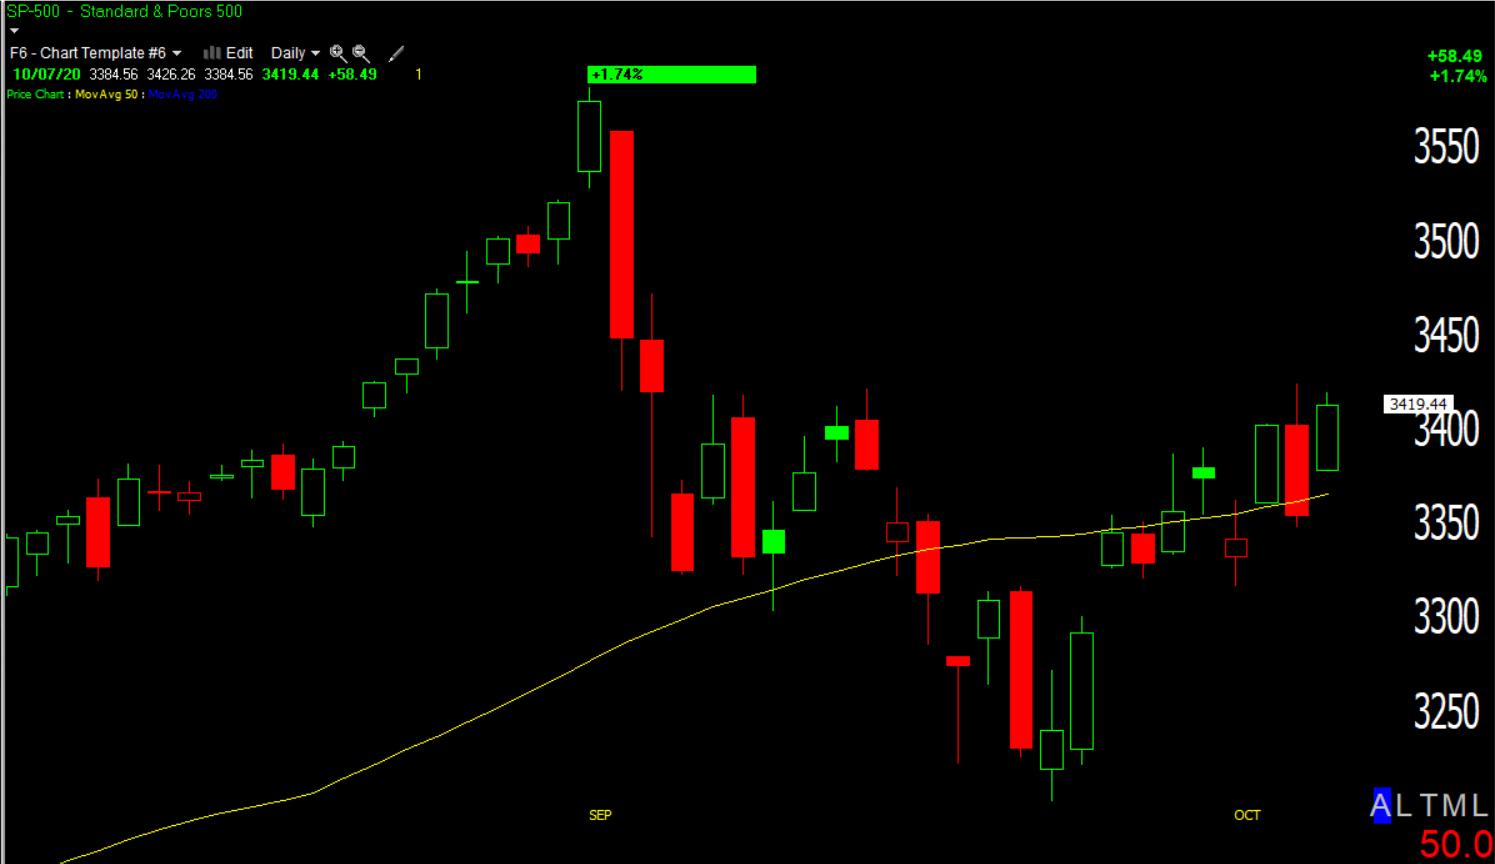 SP-500 (daily) this is the 8th consecutive day the S&P has been about 1% from its 50-day moving average, which is good reason for me to wait for a strong edge/market signals. I’m not interested in small choppy moves, up one day and down the next.
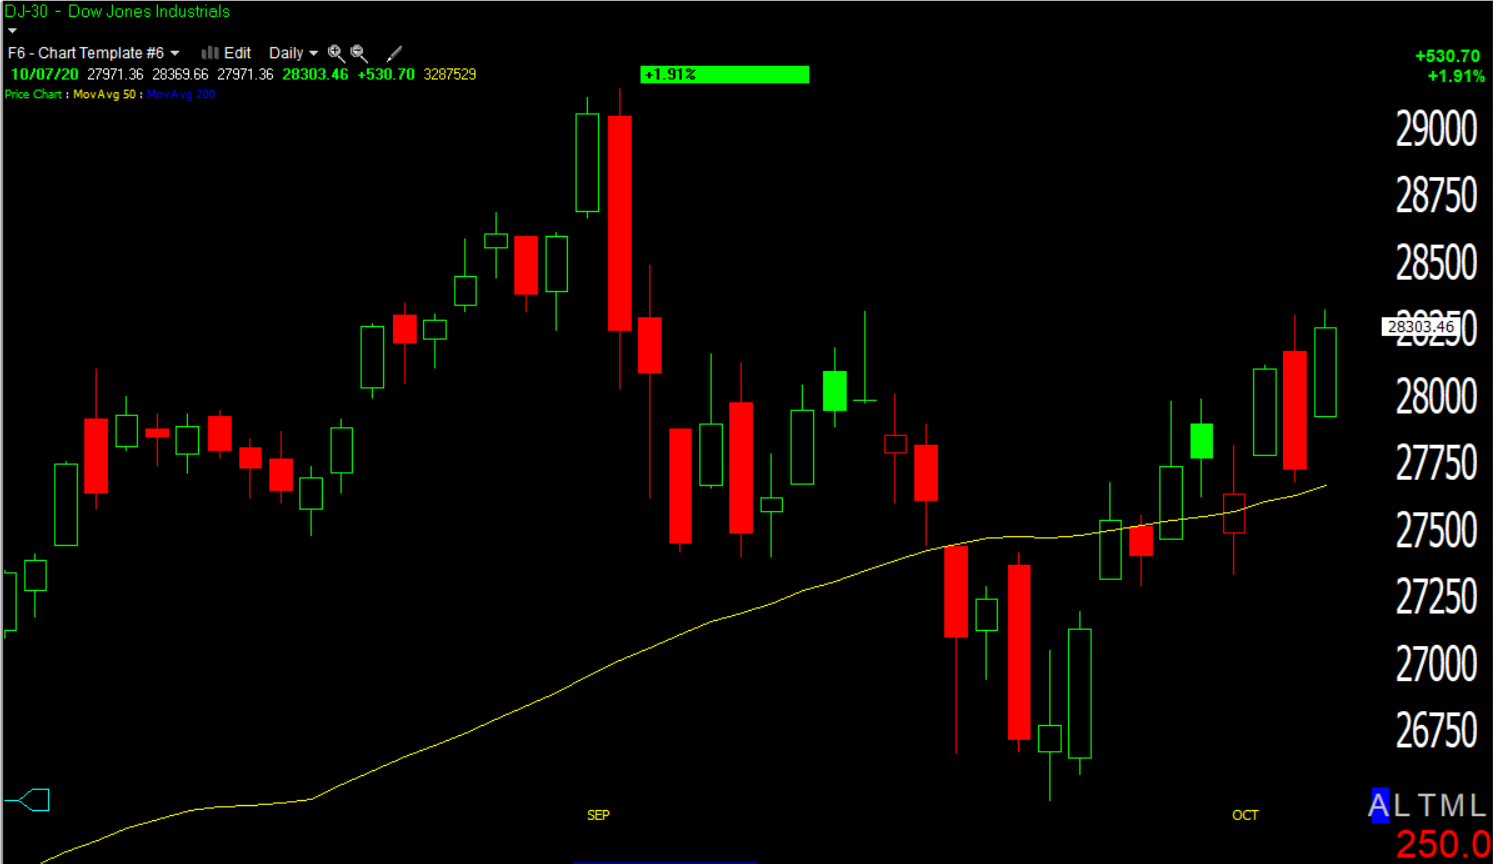 Dow (daily) – the Dow is the only major to retrace all of yesterday afternoon’s plunge as Industrials outperformed with airlines outperforming on stimulus hopes.
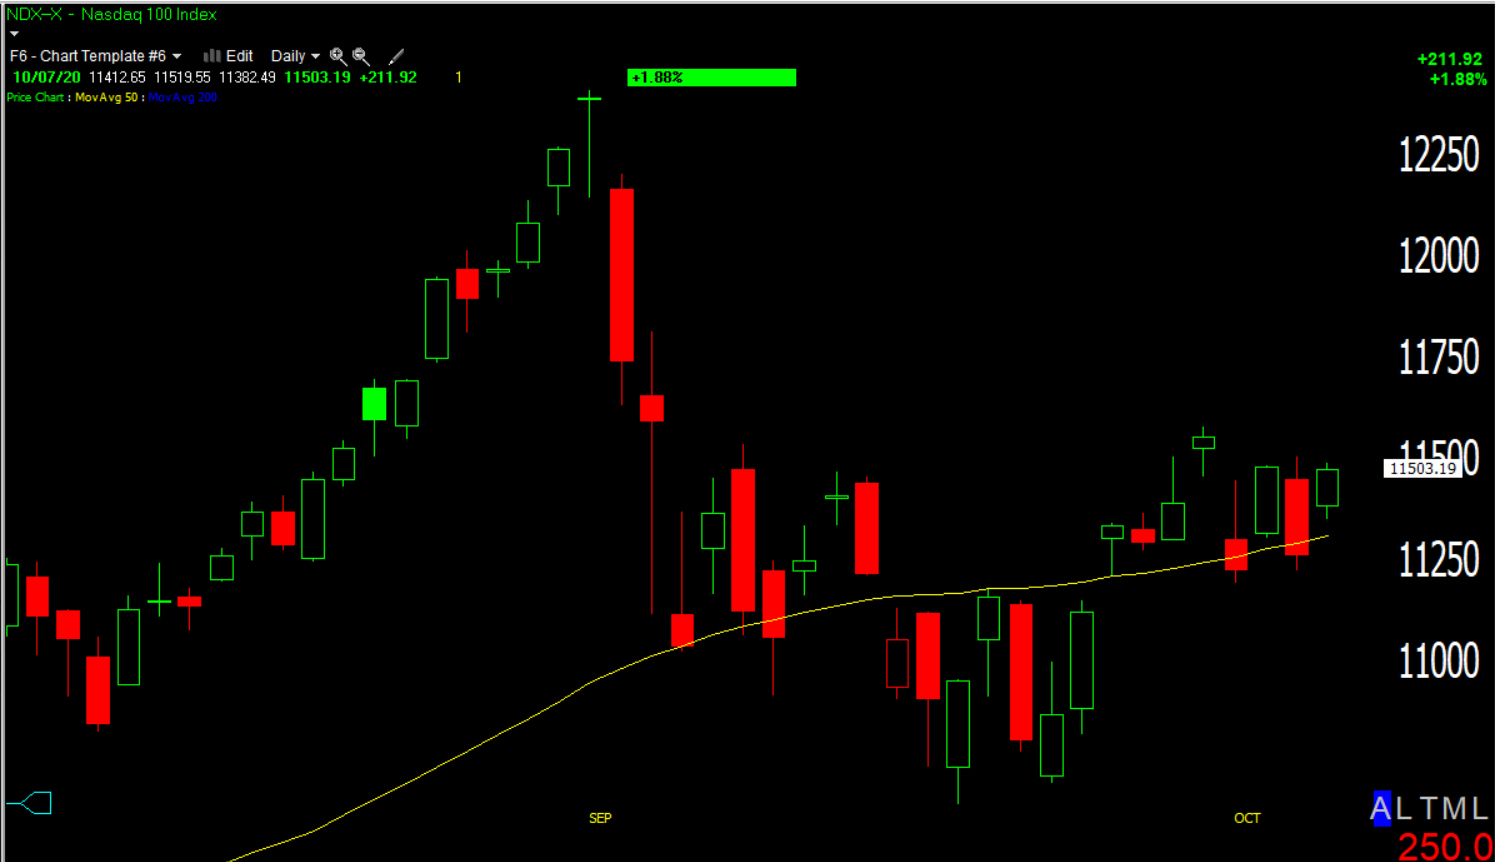 NASDAQ-100 (daily) also chopping around its 50-day
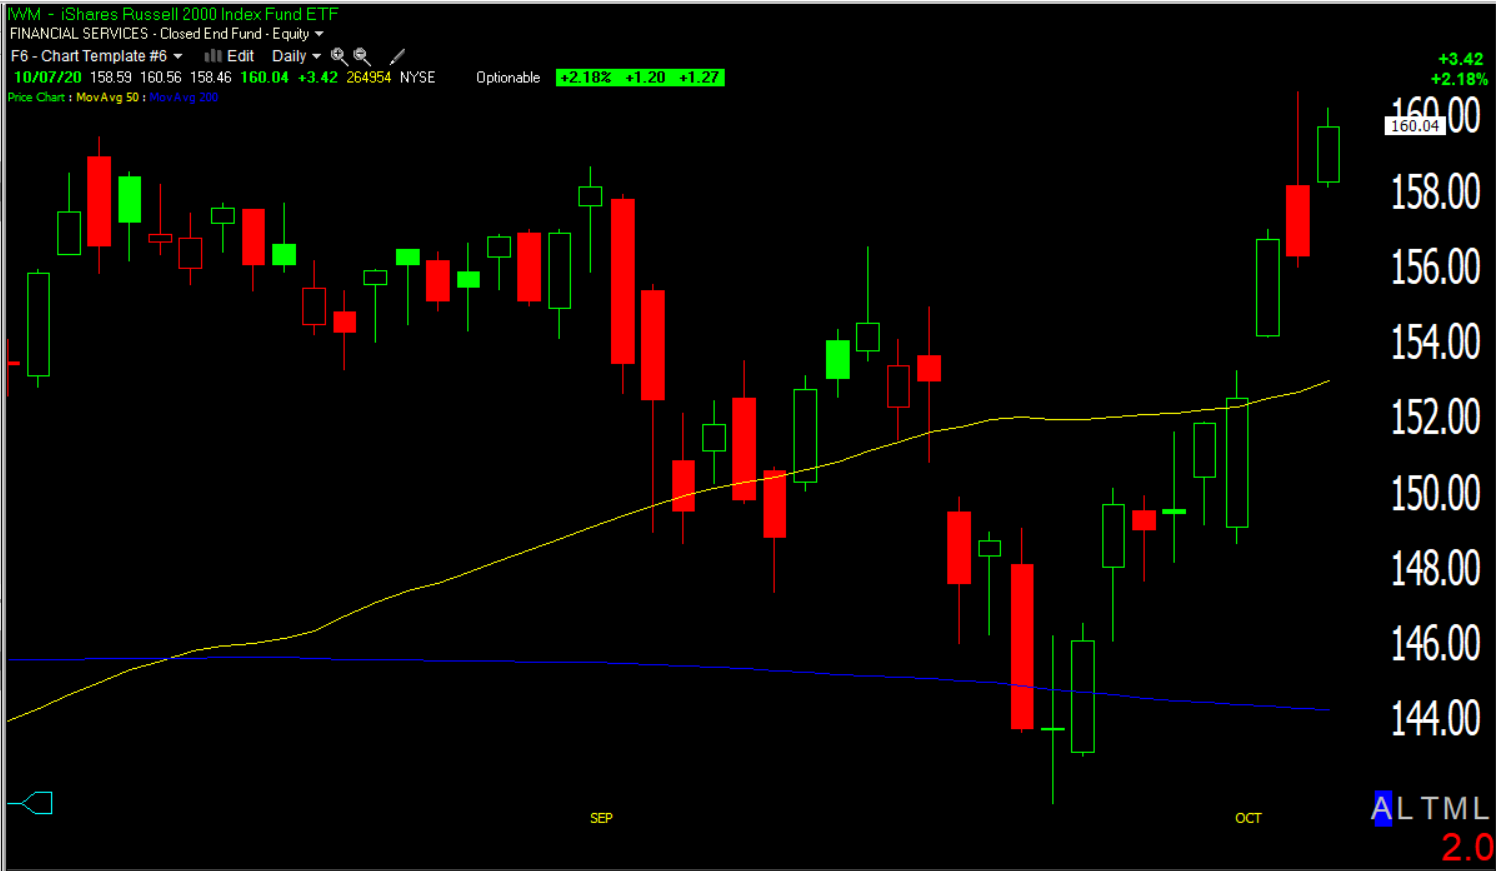 Small Caps/IWM (daily) clearly benefiting from the short squeeze 8 of the last 9 days.
S&P sectors
Due to the President’s tweets suggesting standalone stimulus checks for citizens and a bailout for airlines, airline (+2.7%) and retail (+2.75%) stocks were some of today’s biggest gainers lifting the Industrial and Consumer Discretionary sectors. The defensive and rate sensitive Real Estate sector underperformed.
Facebook (FB -0.2%) and Alphabet (GOOG +0.5%) weighed on the Communications sector amid antitrust concerns stemming from a report from the House antitrust committee.
Materials ⇧ 2.57 %
Energy ⇧ 1.41 %
Financials ⇧ 1.68 %
Industrial ⇧ 2.21 %
Technology ⇧ 1.83 %
Consumer Staples ⇧ 1.08 %
Utilities ⇧ 0.61 %
Health Care ⇧ 1.89 %
Consumer Discretionary ⇧ 2.29 %
Real Estate ⇧ 0.28 %
Communications ⇧ 0.73 %
Internals
NYSE Advancers (2171) easily outpaced Decliners (819) on lighter Volume of 879 mln. shares.
The price/volume relationship is extremely dominant at Close Up/Volume Down, the most bearish of the possibilities. Recall yesterday’s volume was noticeably heavier on the decline.
Internals reflect a 1-day overbought condition.
Treasuries
Like stocks, Yields retraced yesterday afternoon’s sharp drop. U.S. Treasuries finished lower on the longer-end of the curve, sending those yields back to their highest levels of the week. The 2-year yield finished unchanged at 0.15%, while the 10-year yield increased four basis points to 0.79% in curve steepening trade.
However, what may be more notable is the bond market’s volatility which has soared after Trump’s stimulus tweet. The ICE BofA MOVE Index jumped 18 points on Tuesday, the biggest increase since the height of the market turmoil in March.
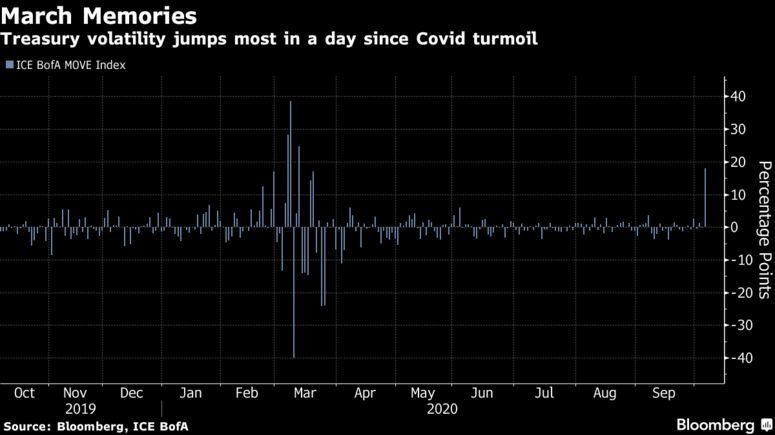 source: Bloomberg
If there’s one form of volatility that the Fed truly fears, it’s Bond market volatility. For more than a month bonds have been asleep, they’re clearly waking up now, therefore should be monitored. They haven’t offered any useful signals in more than a month, but they may now and increasing volatility in bonds can have a negative impact on stocks. For example, risk-parity funds and most funds have to deleverage exposure amid rising volatility.
Volatility
Speaking of volatility, something interesting is taking shape. VIX (-4.8%) was weaker today, which we got a hint of early last night in VIX futures. It as not unexpected as it’s typical ahead of Fed events. VIX is bouncing around between its 50 and 200-day moving averages.
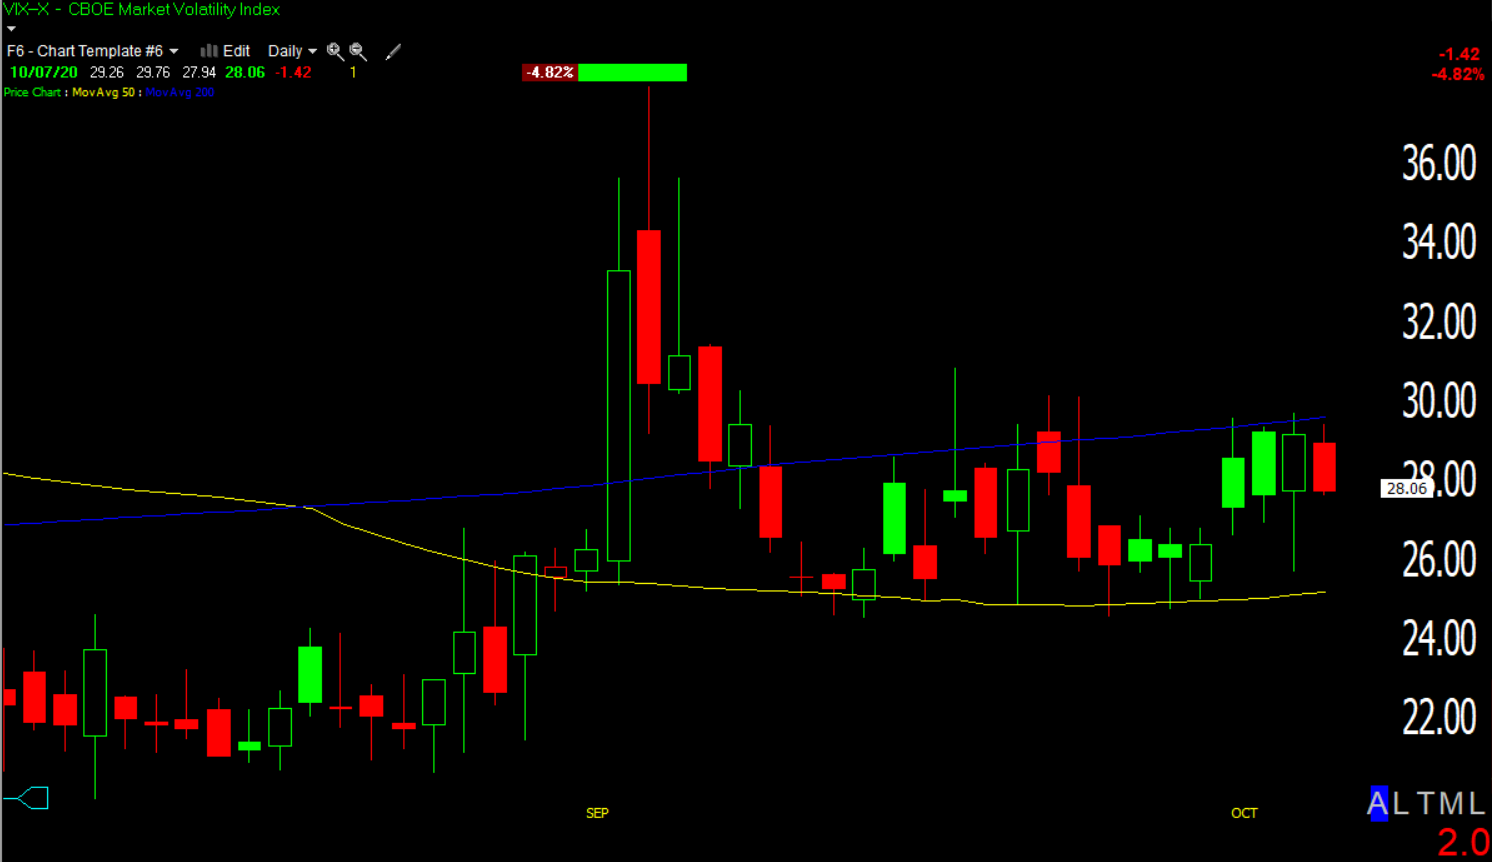 VIX (daily)
Everyday this week Volatility term structure has flattened unusually even as the averages started the day higher.
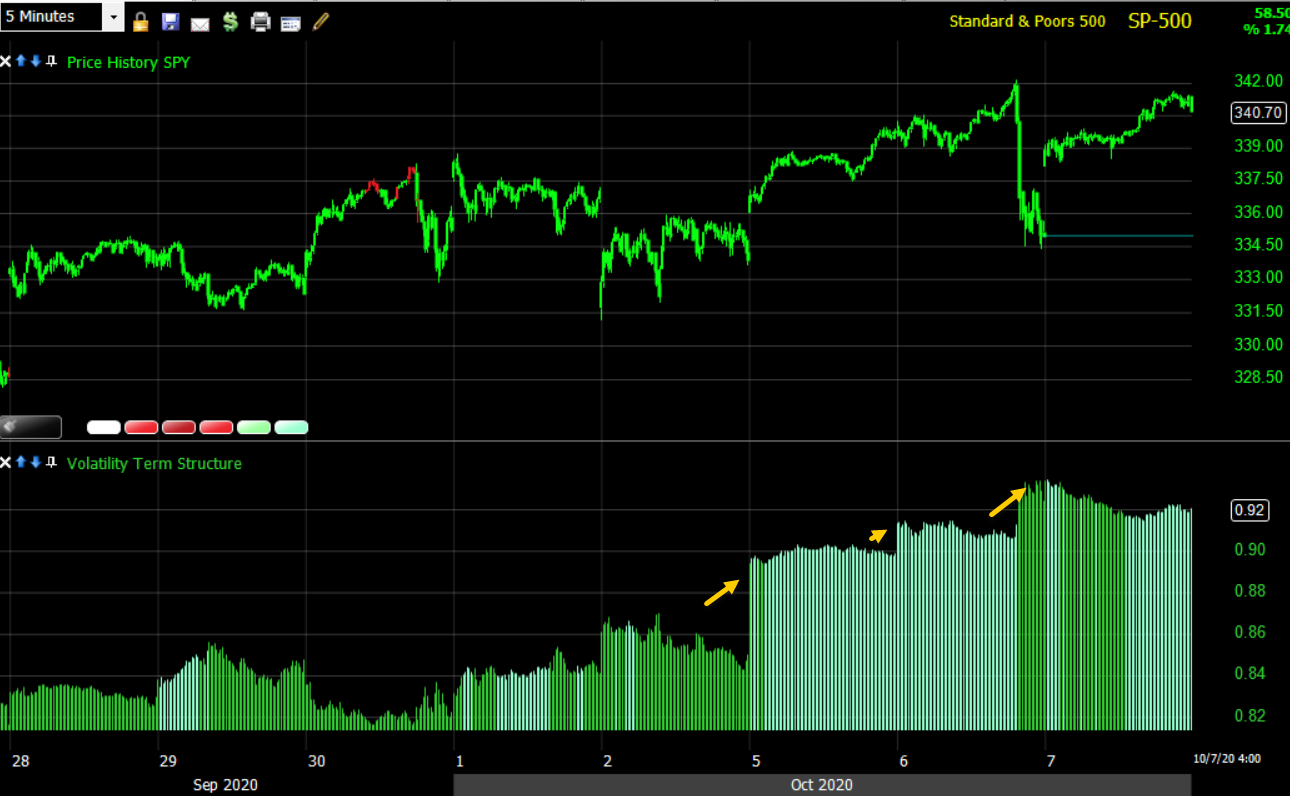 SP-500 (5m) and Vol’s term structure
I’ve mentioned volatility’s positive 3C divergences and vol’s relative strength creeping in on a day-to-day basis, but now the trend is clear.
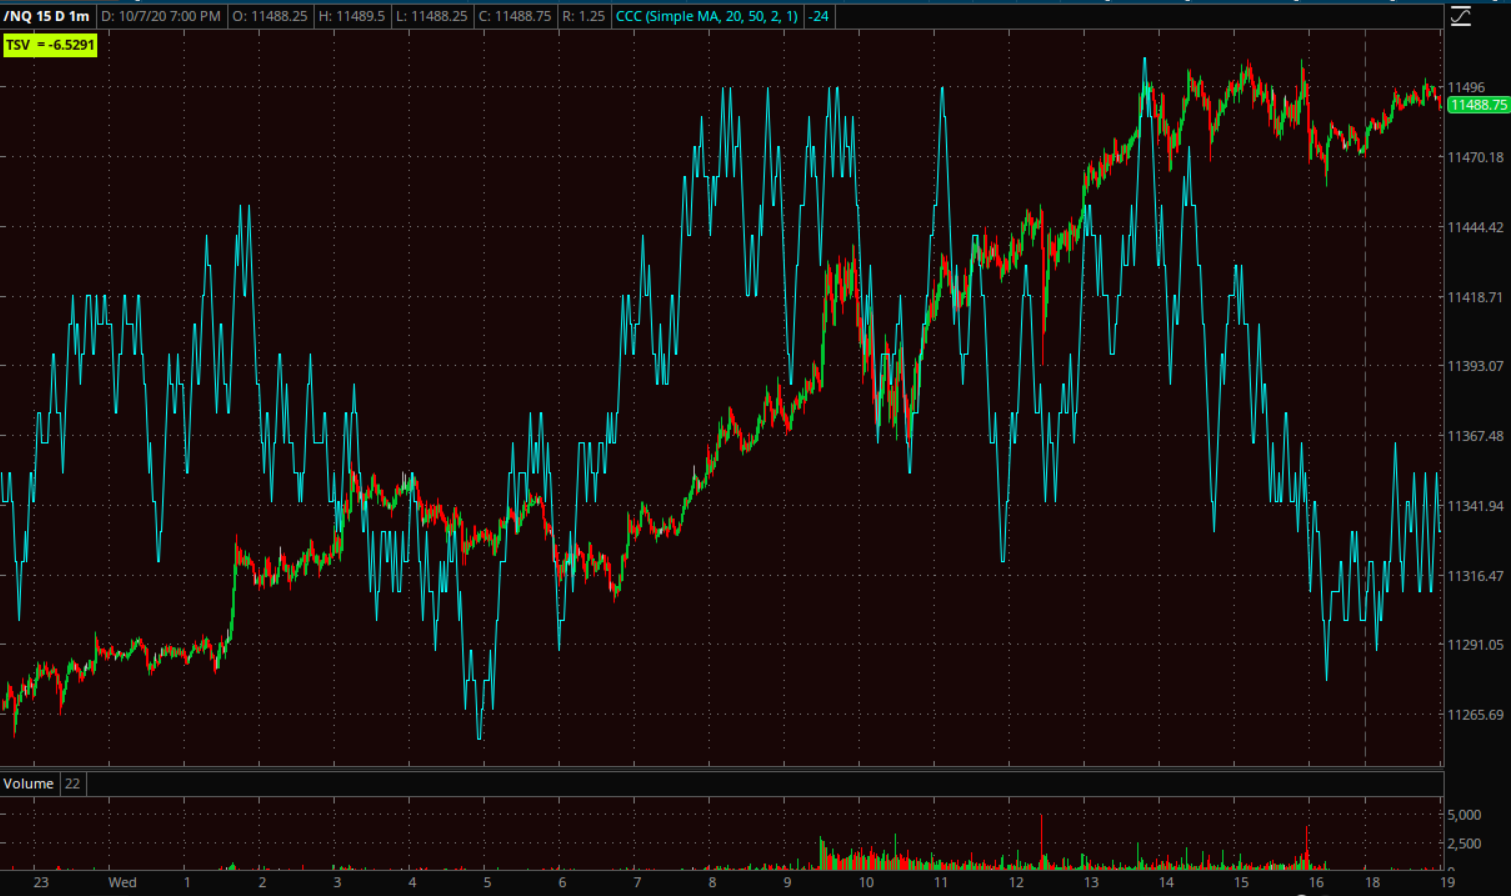
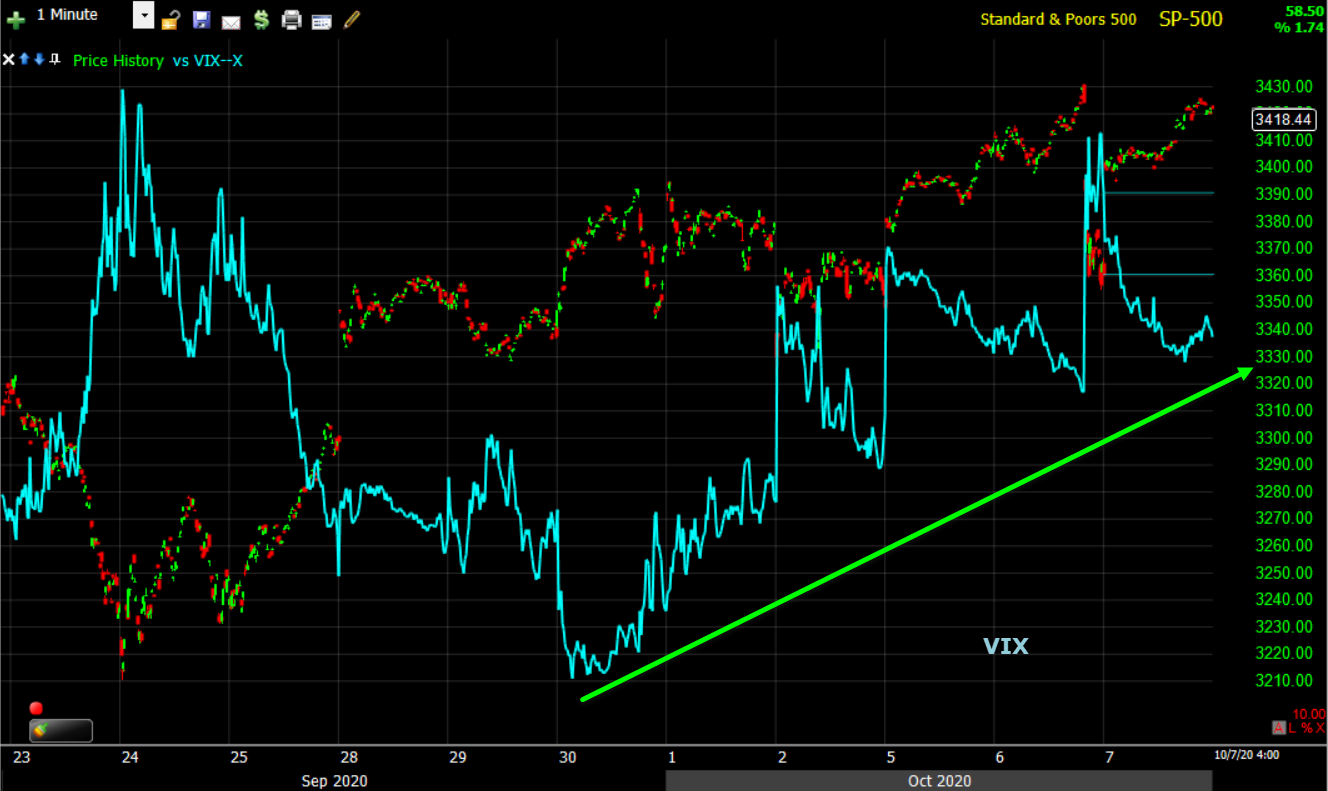 SP-500 (1m) and VIX (blue) trending upward together. You might recall the last time this happened was the weeks just before the August high, followed by an -8% to -13% drop in the major averages.
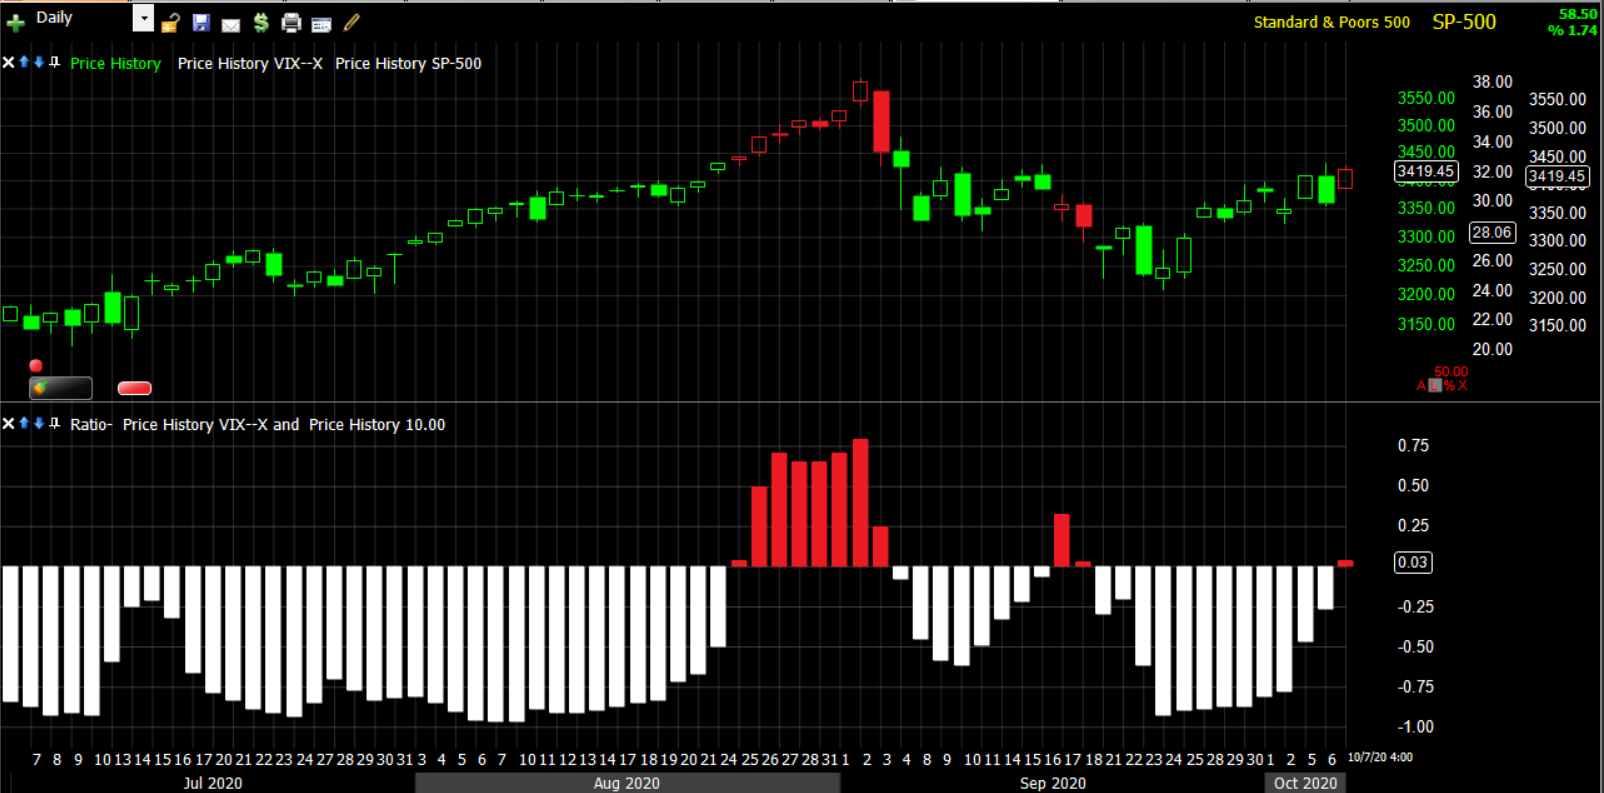
The 10-day positive correlation trend between SPX and VIX is showing up just as it did heading into the market’s August high.
Currencies and Commodities
The U.S. Dollar Index finished flat at 93.64.
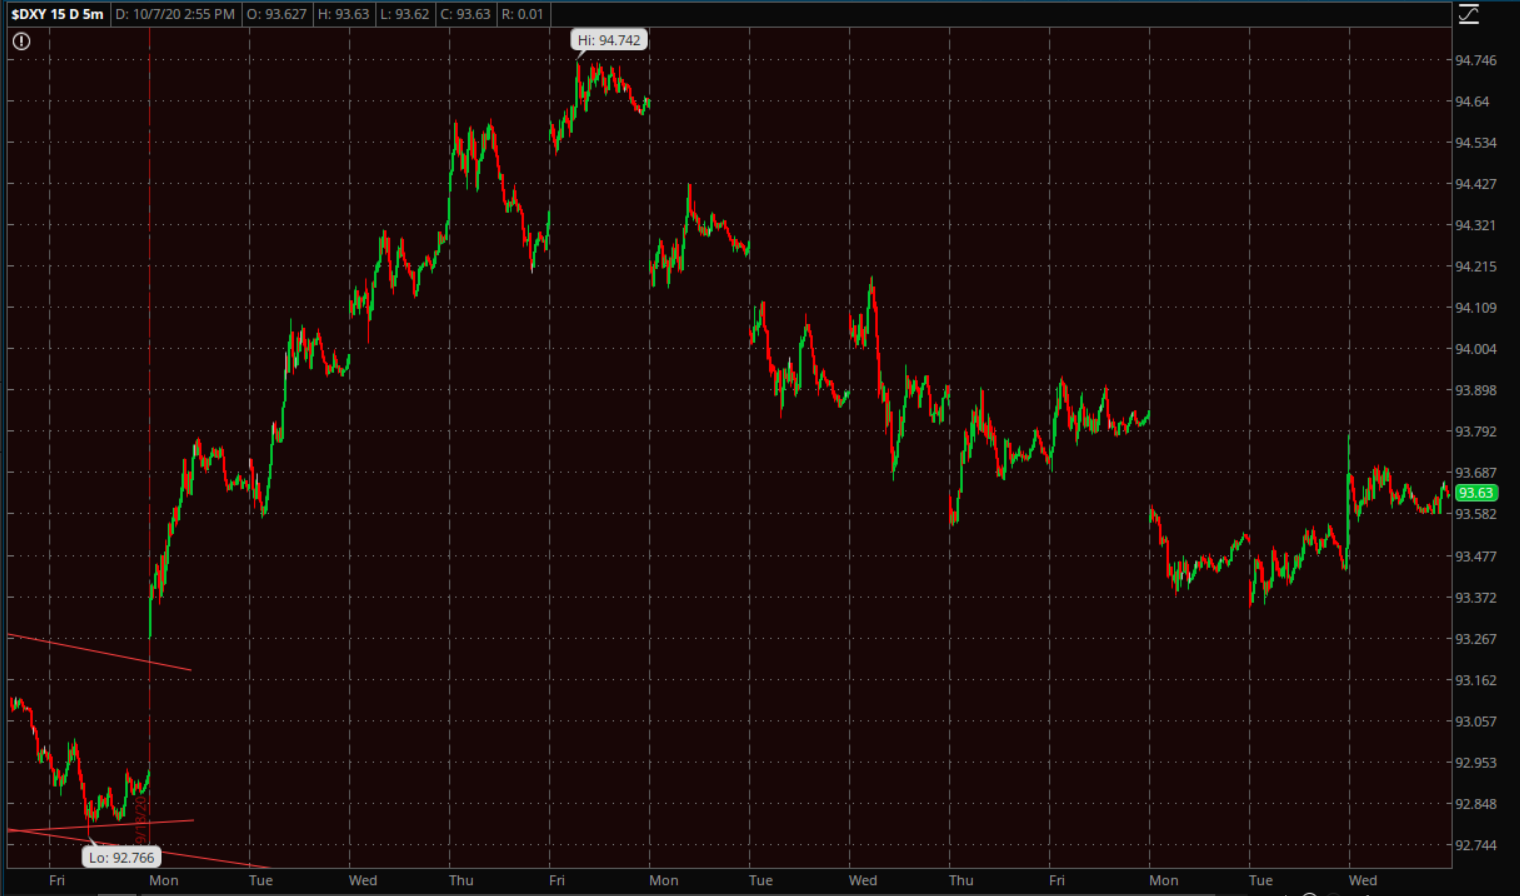 U.S. Dollar Index (15m). If we take a closer look, the price action continues to be bullish suggesting a move higher sooner than later, which is trouble for stocks.
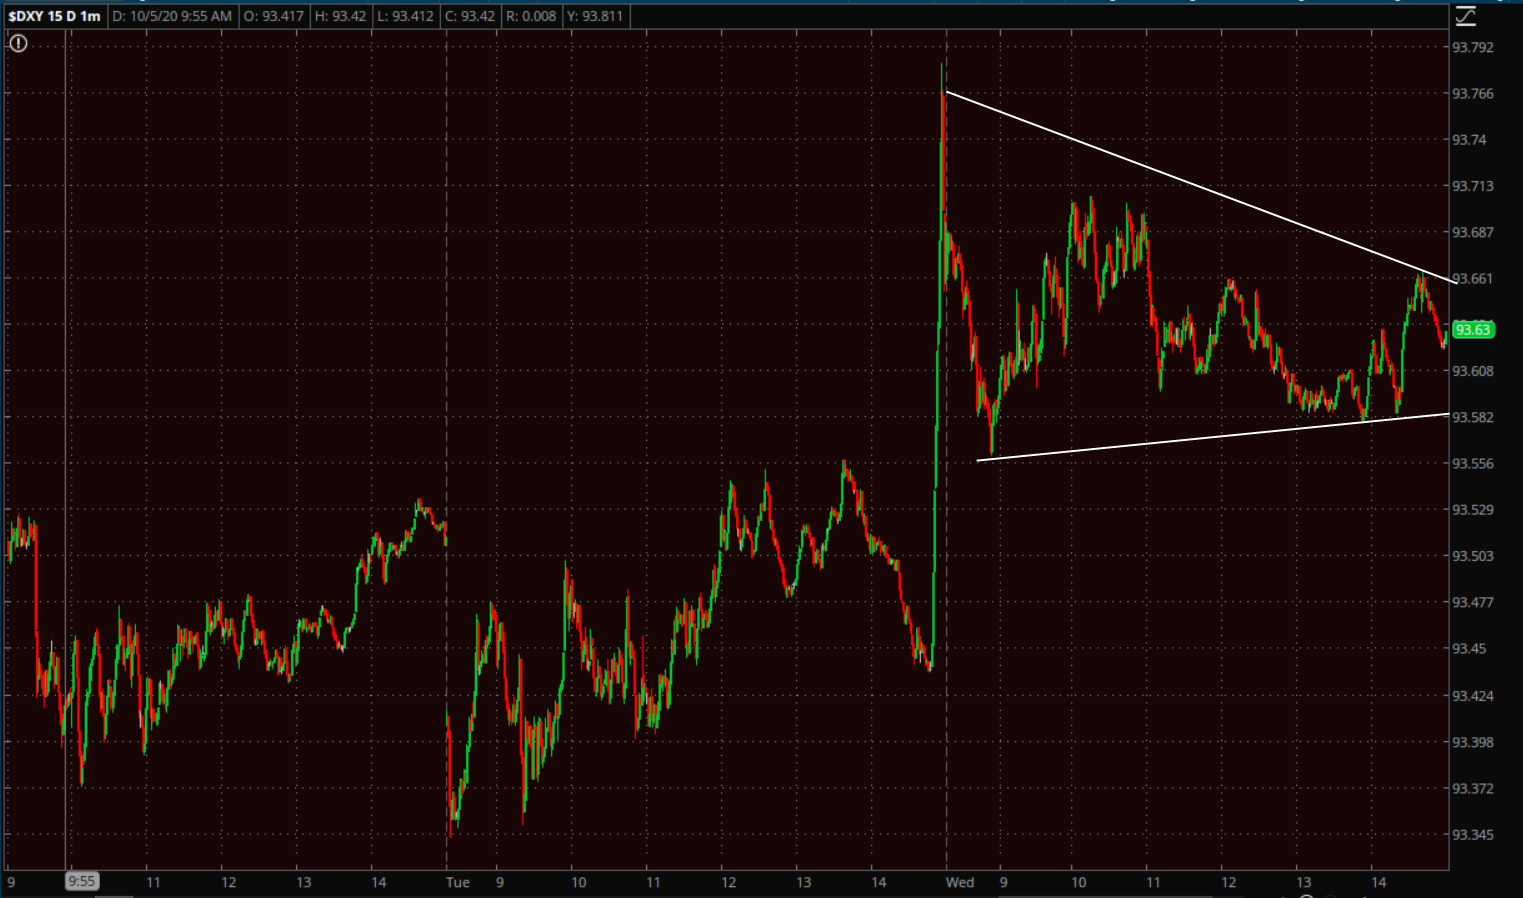
U.S. Dollar Index (1m) today’s price action following yesterday’s stimulus spike is a bullish triangle.
WTI crude declined -1.8% to $39.96/bbl. Crude has been whipped around this week by stimulus hopes and crude production in the gulf being shuttered due to a Cat 4 hurricane. Today inventories revealed the first stockpile gain in 4 weeks. The price action is getting sloppy and chaotic.
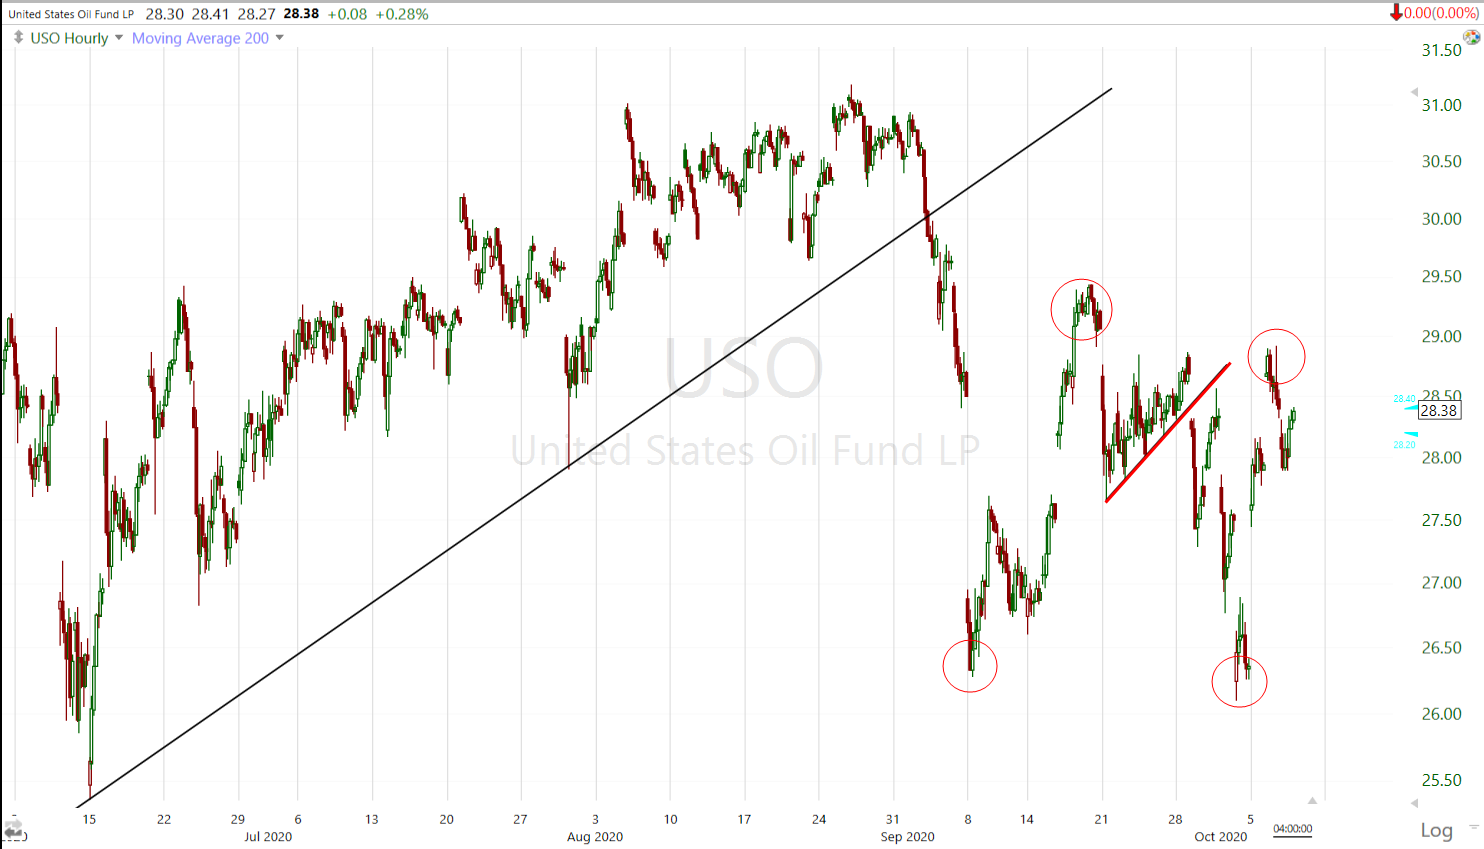 USO (60m) the bearsh price consolidation last week at the red trend line was very clear and worked well, hitting the downside target nearly to the penny, but since then it has been very choppy. Stepping back you can see that 1) the major trend is broken and 2) there is a trend of lower highs/lower lows (red circles), which gives crude a bearish intermediate term bias. I don’t like the trade set-up as much as last week, but if a cleaner set-up develops, chances are it will be to the downside. That will be even more likely should the Dollar breakout higher.
Gold futures lost -0.9% to $1,890.80/oz.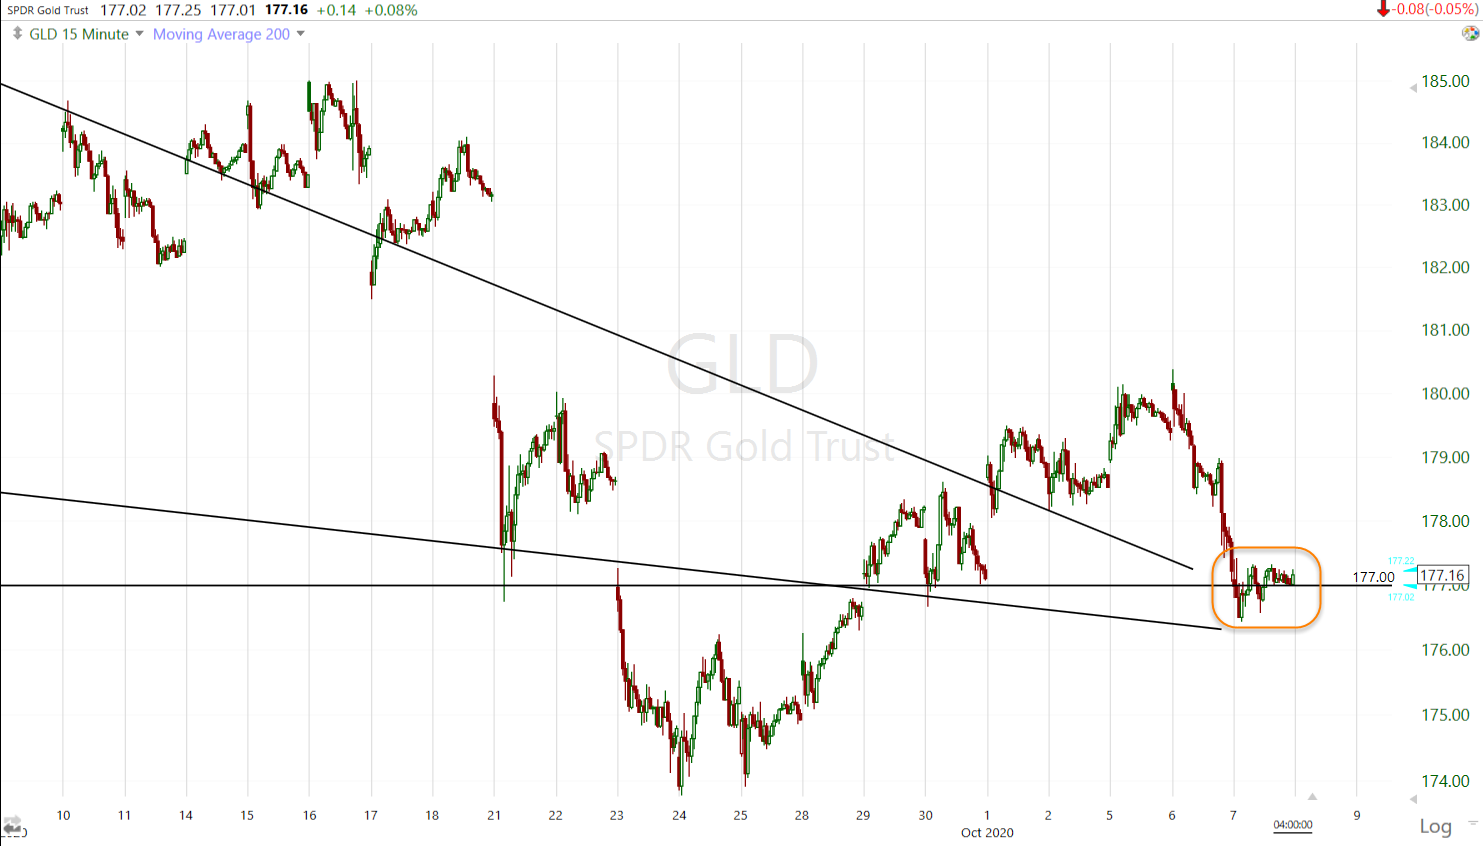
GLD (15m) is consolidating around the $177 pivot, but the near term price action is still bearish.
Bitcoin is trading between $11,100 local resistance and $10,000 local support.
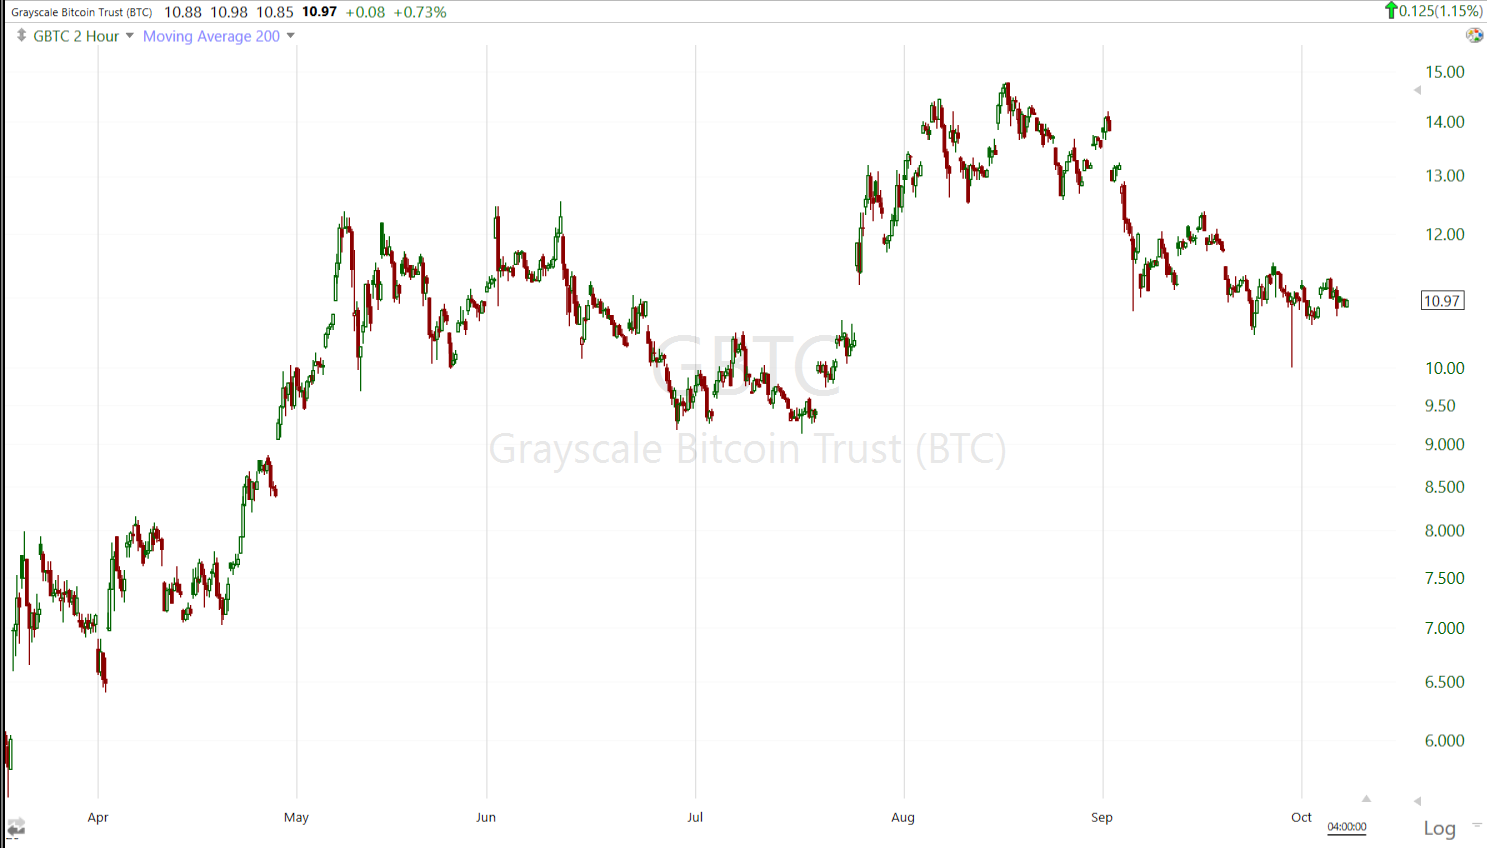 GBTC (2 hour) I took off the shorter term trend lines. I wanted to point out that the current consolidation of 2+ months is remarkably similar to the May-July consolidation that led to the breakout of the multi-year triangle consolidation. I’m not too concerned about my long position here so long as price stays above the July low. I’m willing to add to the position, but am waiting on price action that suggests a higher probability the consolidation is ending and price is getting ready to move again. This is position trade for me that I expect to be holding for a year or more.
Summary
Essentially, today was a reset to yesterday’s highs before President Trump upset the market with tweets. I don’t think there was anything too surprising, in fact the last week or so trade hasn’t been too surprising, it hasn’t been too inspiring either with the S&P clinging to its 50-day as expected.
I continue to expect the Dollar is the key market signal and I continue to expect it will be making another move higher to test last month’s high, which should be trouble for stocks. I may take a position in the U.S. averages but Emerging markets (EEM) are looking more interesting to me at this point and they’re very sensitive to the Dollar too.
Volatility is starting to get interesting, in stocks and now in bonds. On one hand I suspect these developments suggest we get some decent movement away from the S&P’s 50-day moving average, but on the other hand earnings season kicks off next week and last earnings season the market was very dull and flat. I’m not guessing and I’m not speculating. I have no interest in being in the market as the S&P is chopping 1% around its 50-day, one day up one day down. I’m waiting for those high probability market signals. With the way the Dollar looks, with credit not shaping up and now with volatility acting up, I think we’ll see them sooner than later.
Overnight
S&P futures are +0.1%. Index futures look like they are tiring on 3C charts across the board.
 NASDAQ-100 futures (1m) after positively diverging last night, 3C was in line overnight and in the cash session until the afternoon.
VIX futures are also pretty much the opposite of last night when they were weakening, suggesting index futures found support.
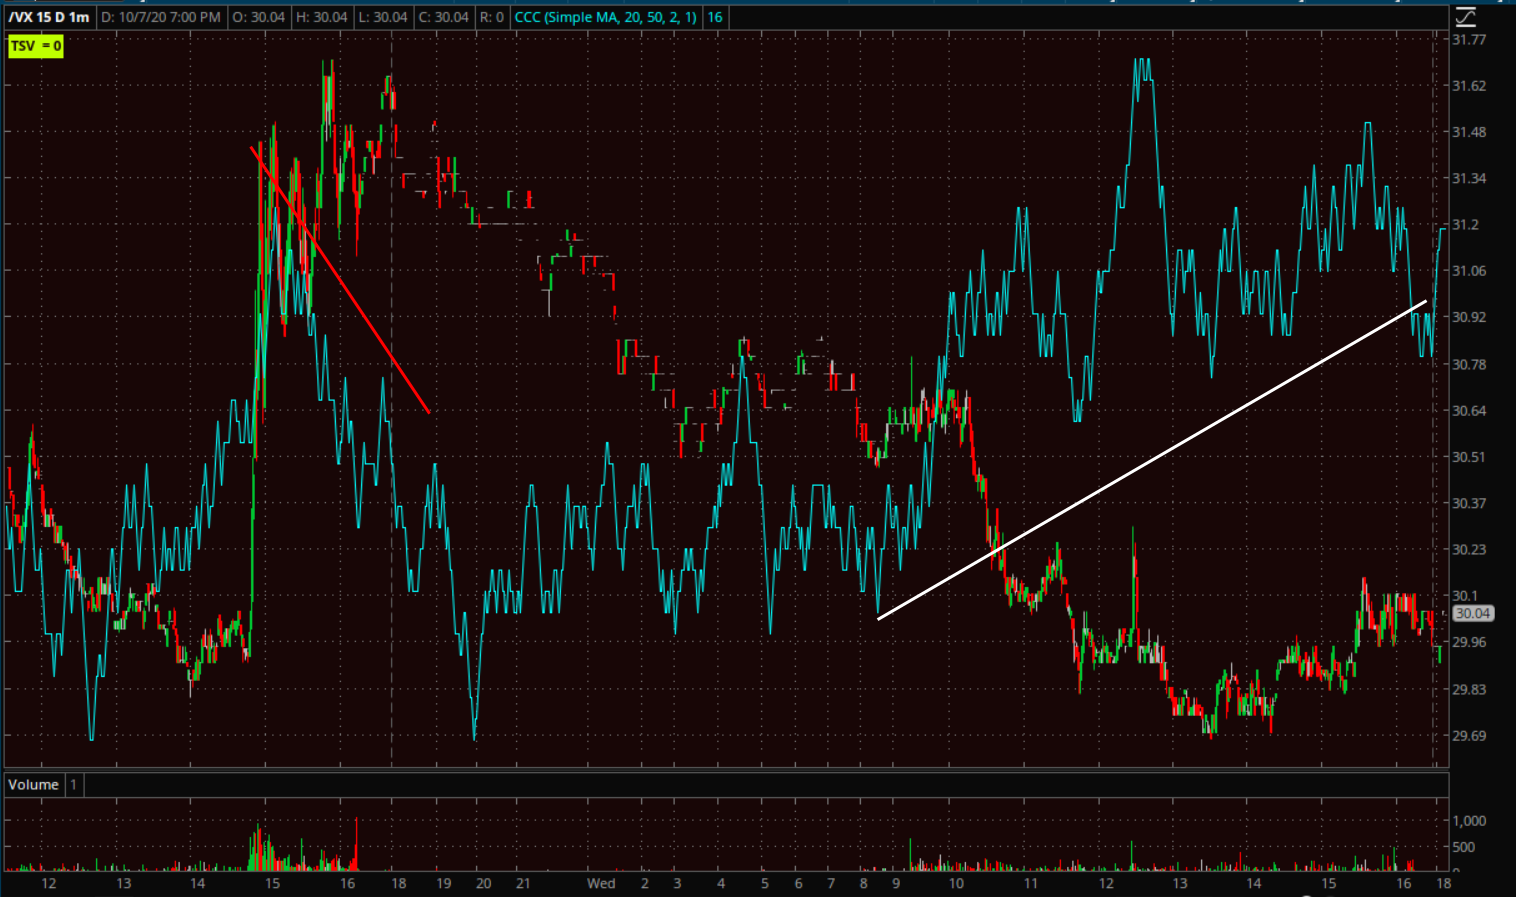 VIX futures (1m) negative divergence at highs last night (red), positive divergence today at lows (white).
The Vice Presidential debate is tonight in Salt Lake City and after the market’s reaction to the Presidential debate, it appears – and reasonably so – that there’s less confidence and a little more caution tonight.