Stock Market Daily Wrap
Index futures trended higher overnight and in pre-market after a round of fairly strong Manufacturing data from Asia and Europe, but similar to yesterday before the Manufacturing PMI (and this morning before ISM Manufacturing), S&P futures’ 3C chart was not confirming pre-market highs.
S&P futures (1m)
Additionally, but unlike yesterday, VIX futures were giving a confirming signal with the first 3C positive divergence of the year.
The ISM Manufacturing Index decelerated more than expected to 58.7% (consensus 60.3%) from 61.1% in November, it still denoted an expanding manufacturing sector (above 50), but like Manufacturing PMI data yesterday, the level marks a 12 month low. This is notable because these are the conditions that the Fed is tightening into. The ISM report showed a noticeable ease in inflation pressures, although the Omicron variant discovered just over a month ago (not fully reflected in the report) could pose risks this month. Contrasting the slow-down in ISM price pressures, figures showing a record U.S. job quit rate adds to concerns over wage inflation.
A Bloomberg article I read today said that Treasury traders, “are betting the rapid spread of the omicron variant will increase inflationary pressures in the U.S. economy, rather than weaken them”, which is exactly the case I was making in Thursday’s Afternoon Update…
“[COVID] restrictions/lockdowns aren’t likely not be so severe as to pose economic risks so severe that the Fed slows their tightening plans, but enough that supply chain-related inflationary pressures could actually cause the Fed to speed up the pace of tightening.”
Speaking from seasonal probabilities, today is considered the last day of the Santa Rally. NASDAQ-100 and the large-cap tech stocks were the obvious weak link today as bond yields continued their advance. Interestingly, bond yields had far bigger moves up yesterday than today and large-cap Tech still did well yesterday and actually led the market. The S&P closed up +0.64% yesterday and the NASDAQ-100 up +1.1%, but if you were to look at the equal weighted indices for each you can see just how much a handful of the mega-caps influenced those gains. The S&P equal weighted index only gained +0.07% and in the NASDAQ-100’s case it actually closed down -0.06%.
While the advance in yields slowed today, it was still their biggest 2-day surge since March of 2020. Why were the mega-caps not weak yesterday amid a stronger advance in yields than today? The answer may come from Goldman Sachs who noted that some $125 billion in new capital inflows was allocated yesterday and it seems they went to the market’s favorite names. For some perspective, the five most popular tech names – AAPL, MSFT, NVDA, TSLA, GOOGL – have contributed 51% of S&P 500 returns since April.
With those new inflows slowing today, the normal reaction function to higher yields took hold and large-cap tech stocks faltered.
Averages
The day was a mixed session, but made more sense than yesterday’s unusual trade in large-cap Tech. The Dow was the best performer on the day as value stocks propelled the index to a new record high. Dow Transports (+1.7%) acted better with the clear cyclical bias today and after holding the 50-day yesterday. NASDAQ-100 was the worst performer, erasing all of yesterday’s gains. The mirror opposite of yesterday, the mega-caps’ weakness weighed on the S&P as it closed lower. To illustrate, when the mega-caps weighting is neutralized, the equal weighted S&P actually closed up +0.8% on the day.
S&P 500 ⇩ -0.06 %
NASDAQ ⇩ -1.35 %
DOW JONES ⇧ 0.59 %
RUSSELL 2000 ⇩ -0.15 %
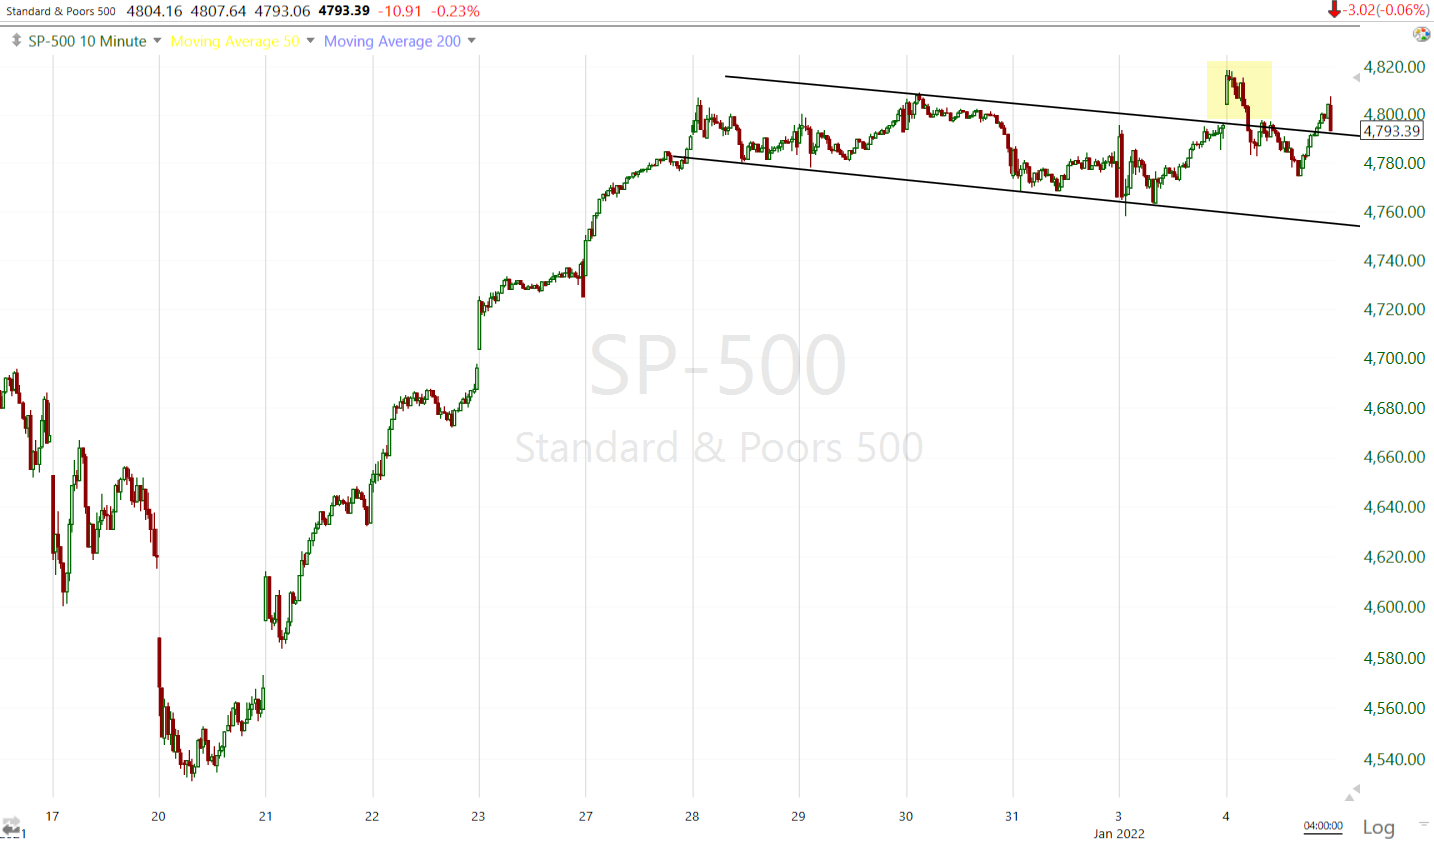 SP-500 (10m)- as suspected as a reasonable probability yesterday, the S&P may be posting a false breakout more fully covered in this earlier post.
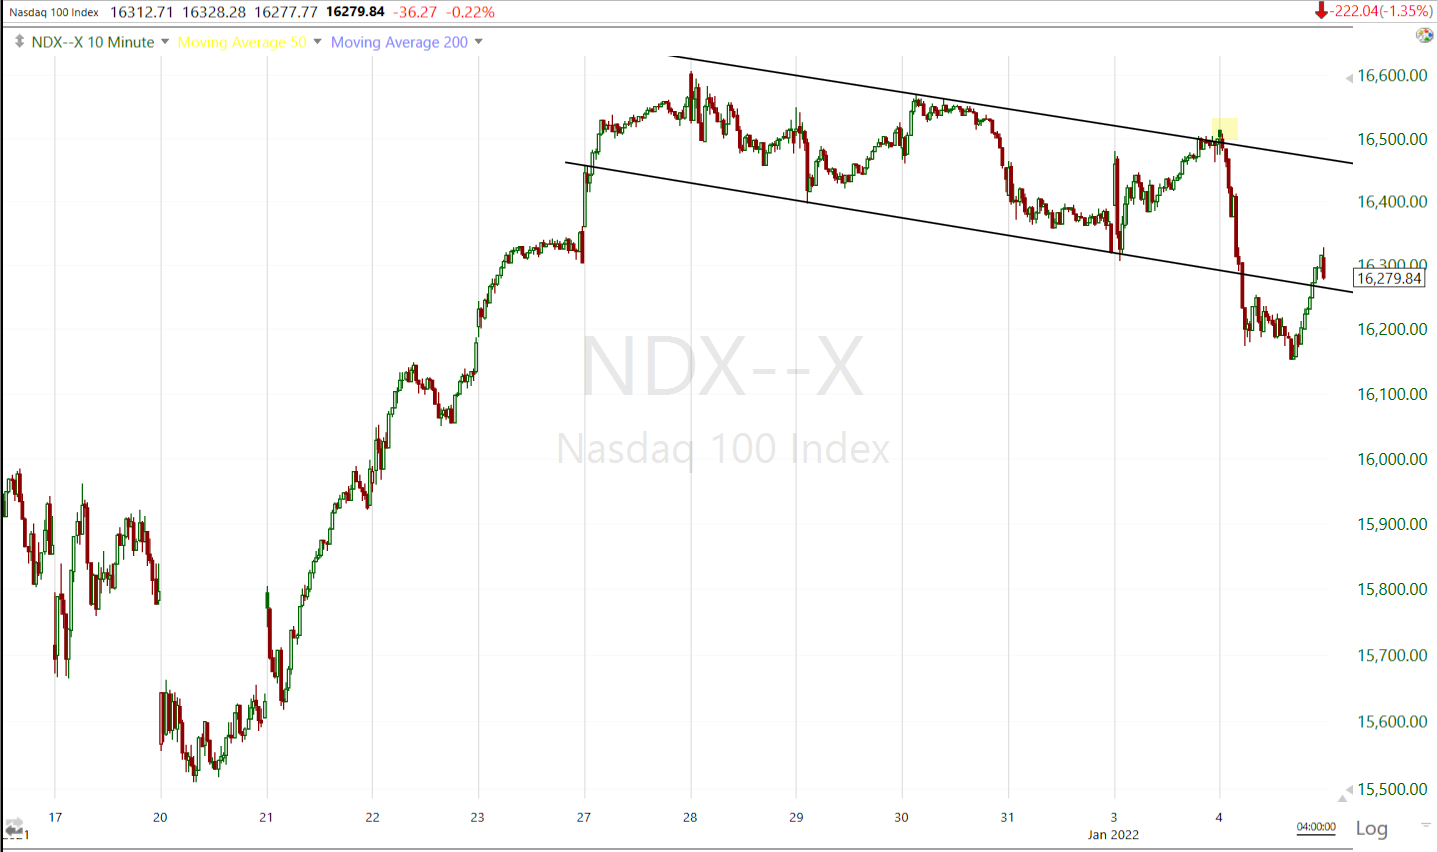 NASDAQ-100 (10m) just barely traded above the bull flag at the open, then fell below and ended up just inside. I posted a scenario that I think is fairly reasonable over the next few days in today’s Afternoon Update that’s largely centered on the NASDAQ-100.
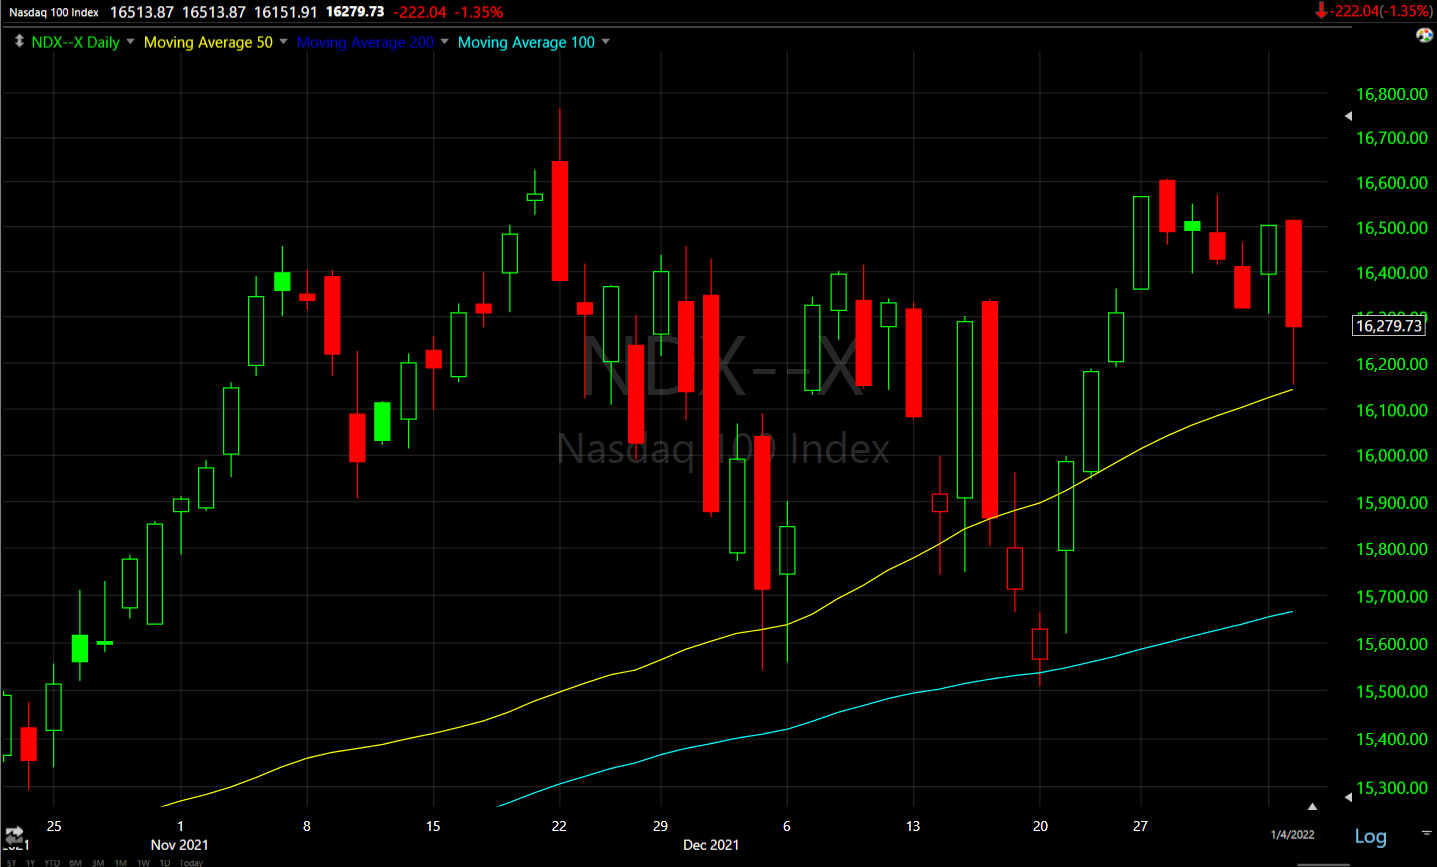 NASDAQ-100 (daily) erased all of yesterday’s gains after opening slightly higher (+0.1%) this morning and put in a bearish engulfing candle, but it also held support at its 50-day sma and moved off the worst levels of the day. The broader NASDAQ Composite (-1.3%) also held its 50-day on the close after testing below it.
 Dow (daily) set a new record closing high, but left an upper wick on the candle indicating higher prices were faded.
While the Dow was the best performing, it was the only 3C chart of the major averages that caught my attention today.
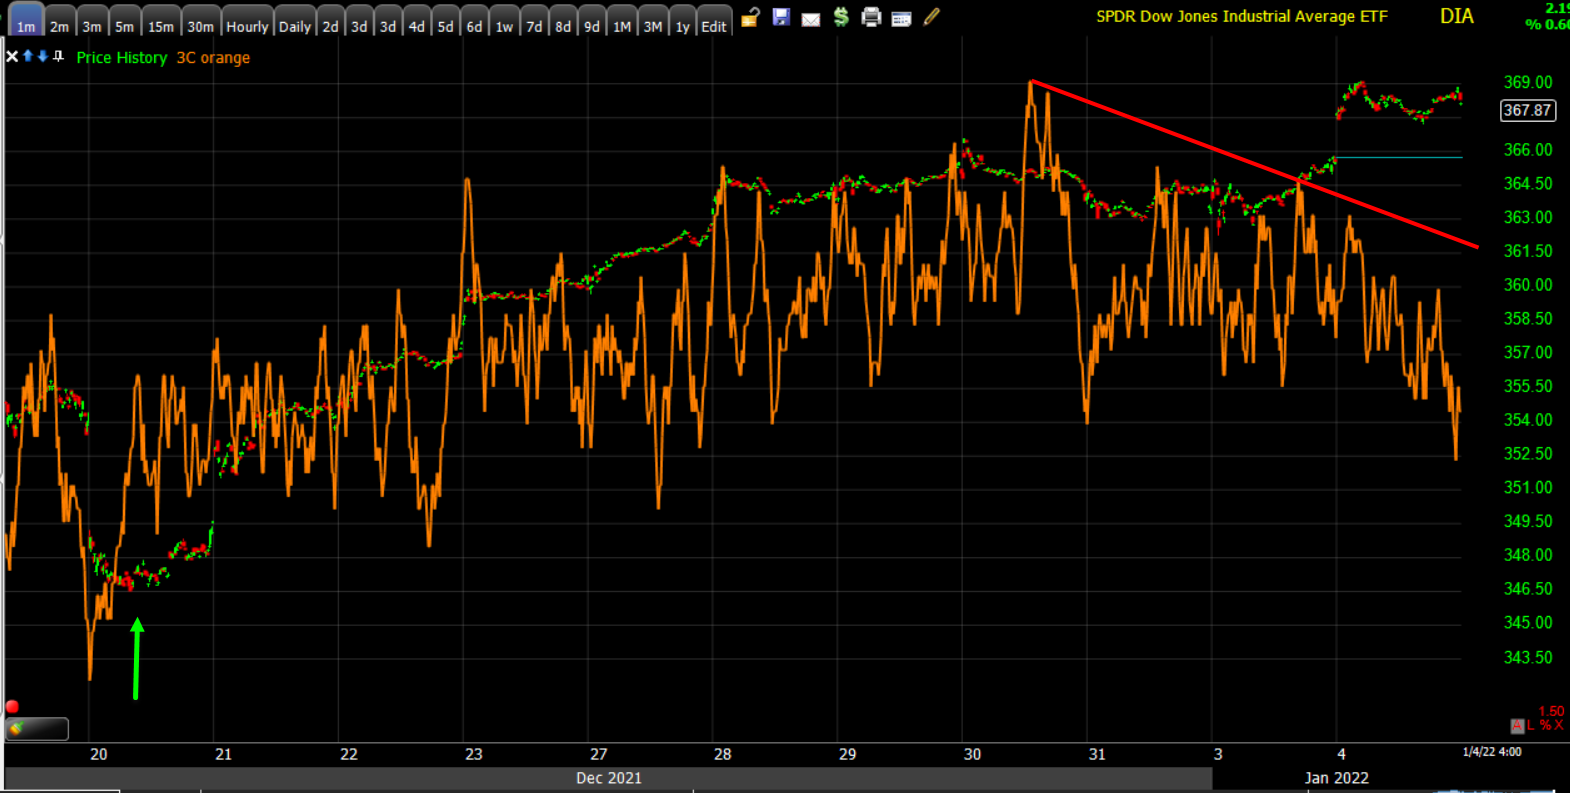 DIA (1m) has had some of the best 3C confirmation of the rally from Dec. 20th’s oversold lows, but notably did not confirm today’s new high, or even a higher high, and is darn close to a leading negative divergence suggesting there was some selling into today’s price gains.
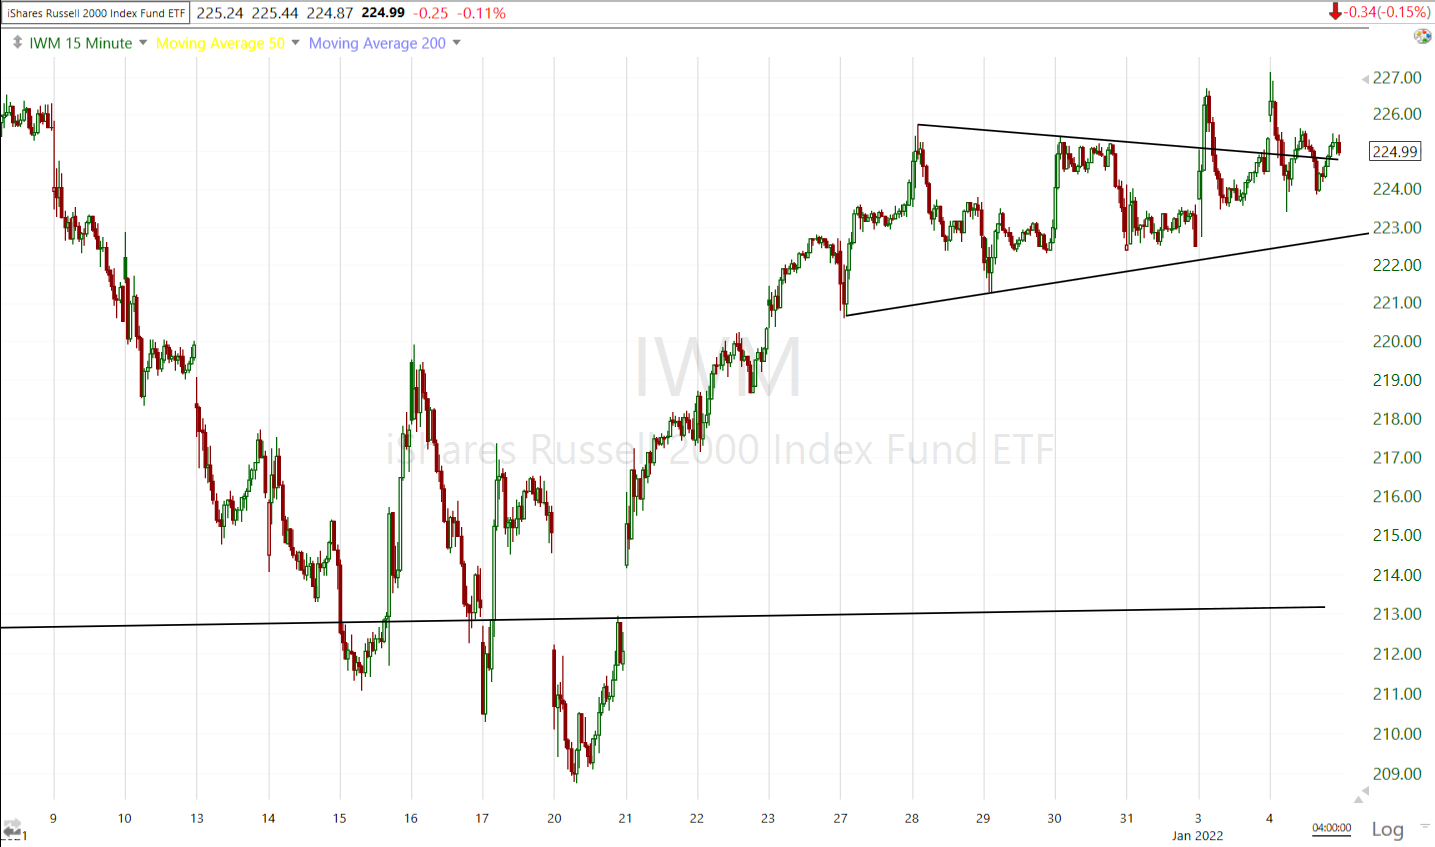 IWM (10m) is struggling to breakout due to technical resistance at its 50-day sma.
 IWM (daily) and 50-day sma (yellow) acting as resistance for the second day in a row.
The most shorted index of stocks that was strongly squeezed yesterday (according to Nomura because hedge funds were cleaning up remaining short positions from last year), dropped today to retrace the entirety of yesterday’s short squeeze, which is a little surprising because a hefty portion of the MS index are cyclical stocks that outperformed today.
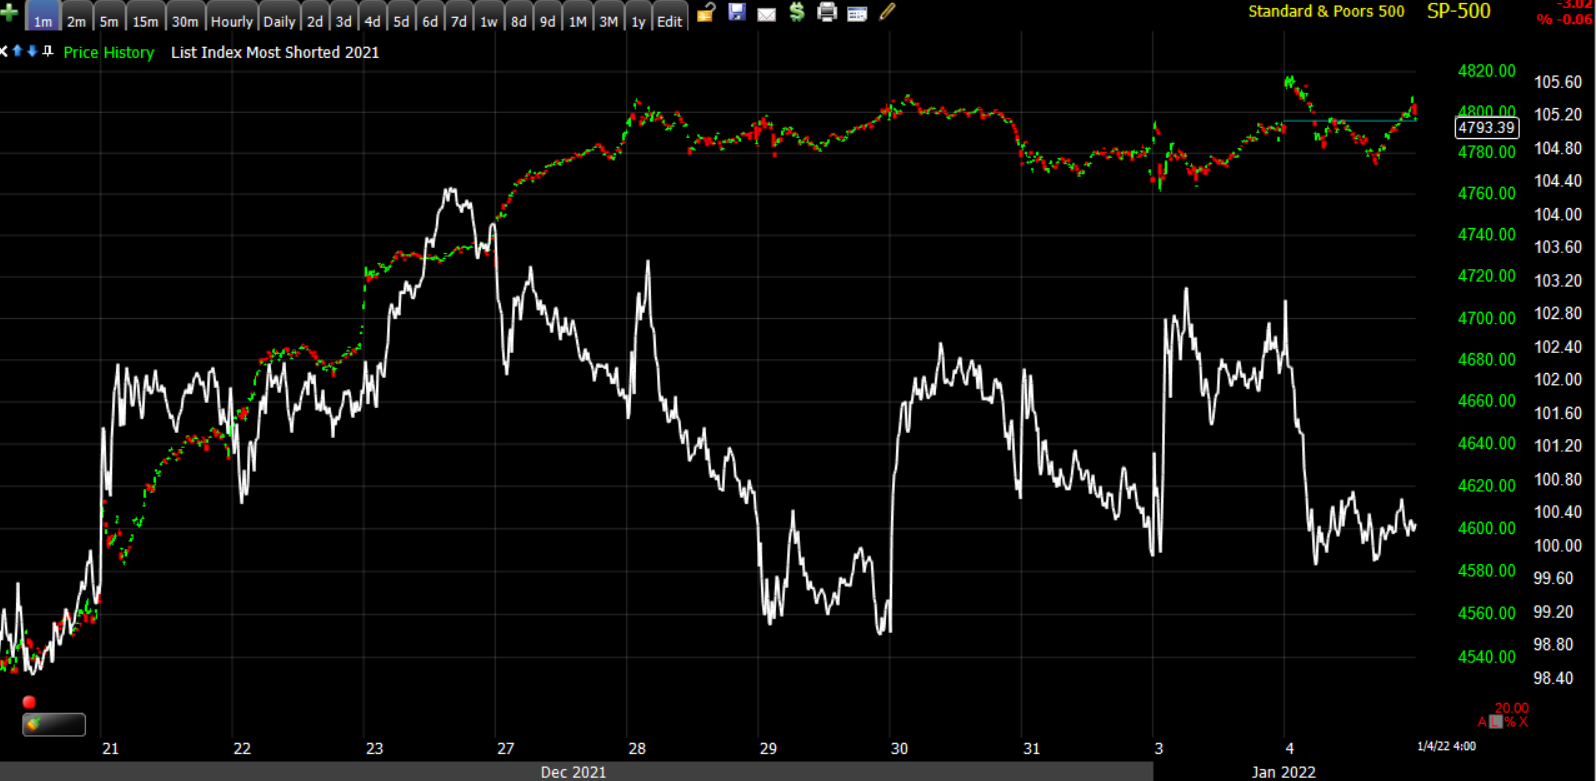 SP-500 (1m) and Most Shorted Index (white)
Once again VIX saw early relative strength, trending up from the open to a gain of +7%, then turning down around the European close to end the day up +1.87%. However, today was the first day that VIX futures had a positive 3C divergence this week and VIX did close higher. Term structure wasn’t unusual today like yesterday, and the ABI at 35 is not an influencing factor at this time.
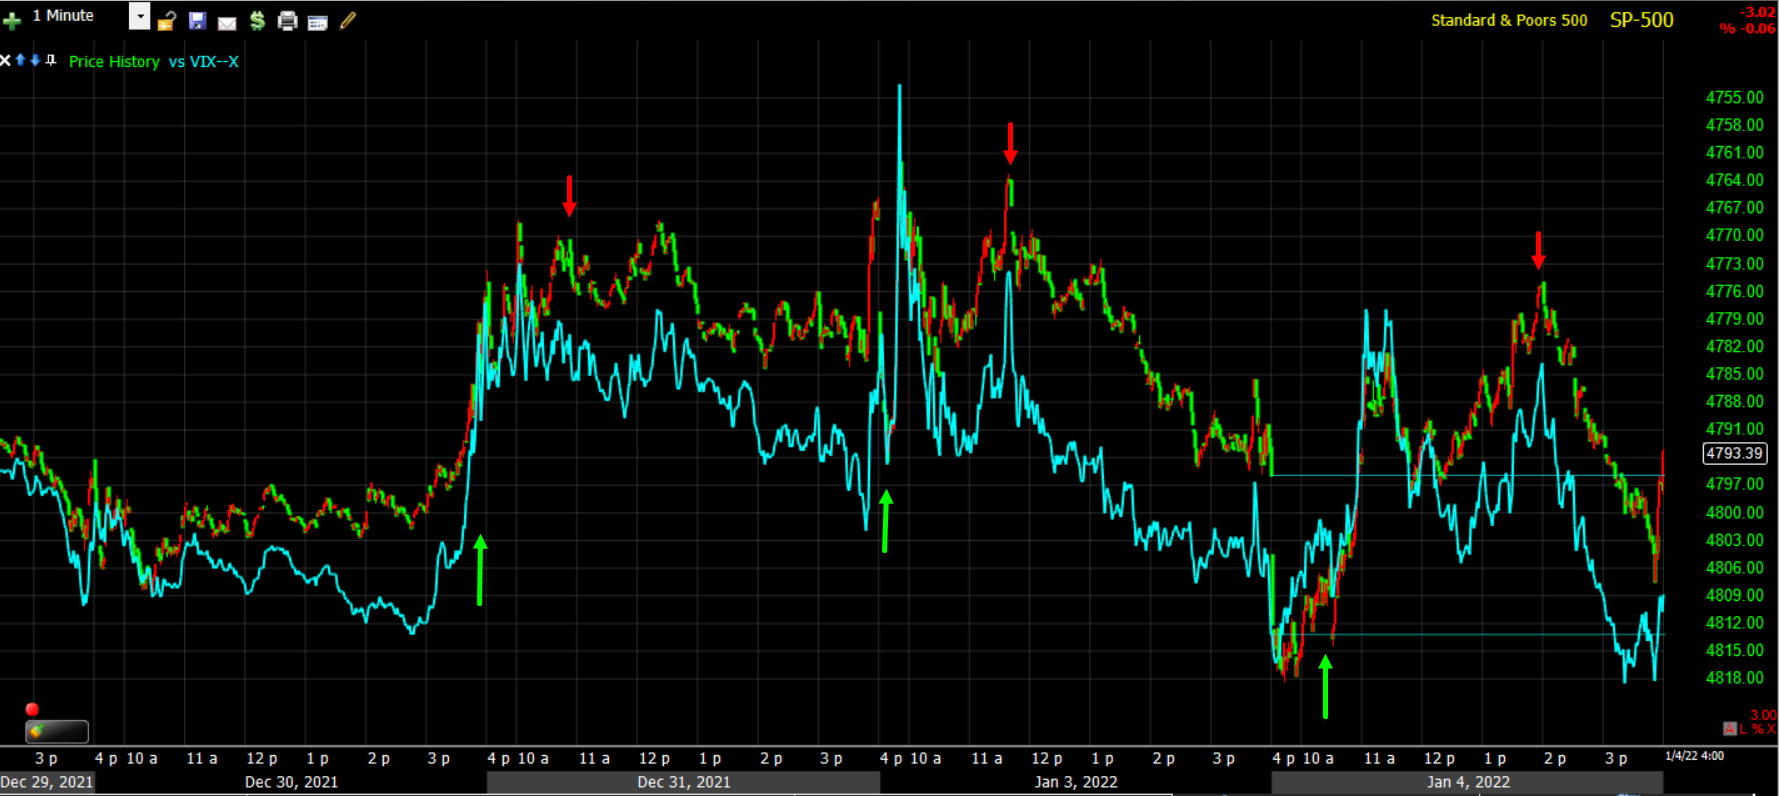 SP-500 (1m) inverted for context and VIX showing a trend of early morning relative strength in volatility (green), and afternoon weakness (red). This has been going on for 4 or 5 days now.
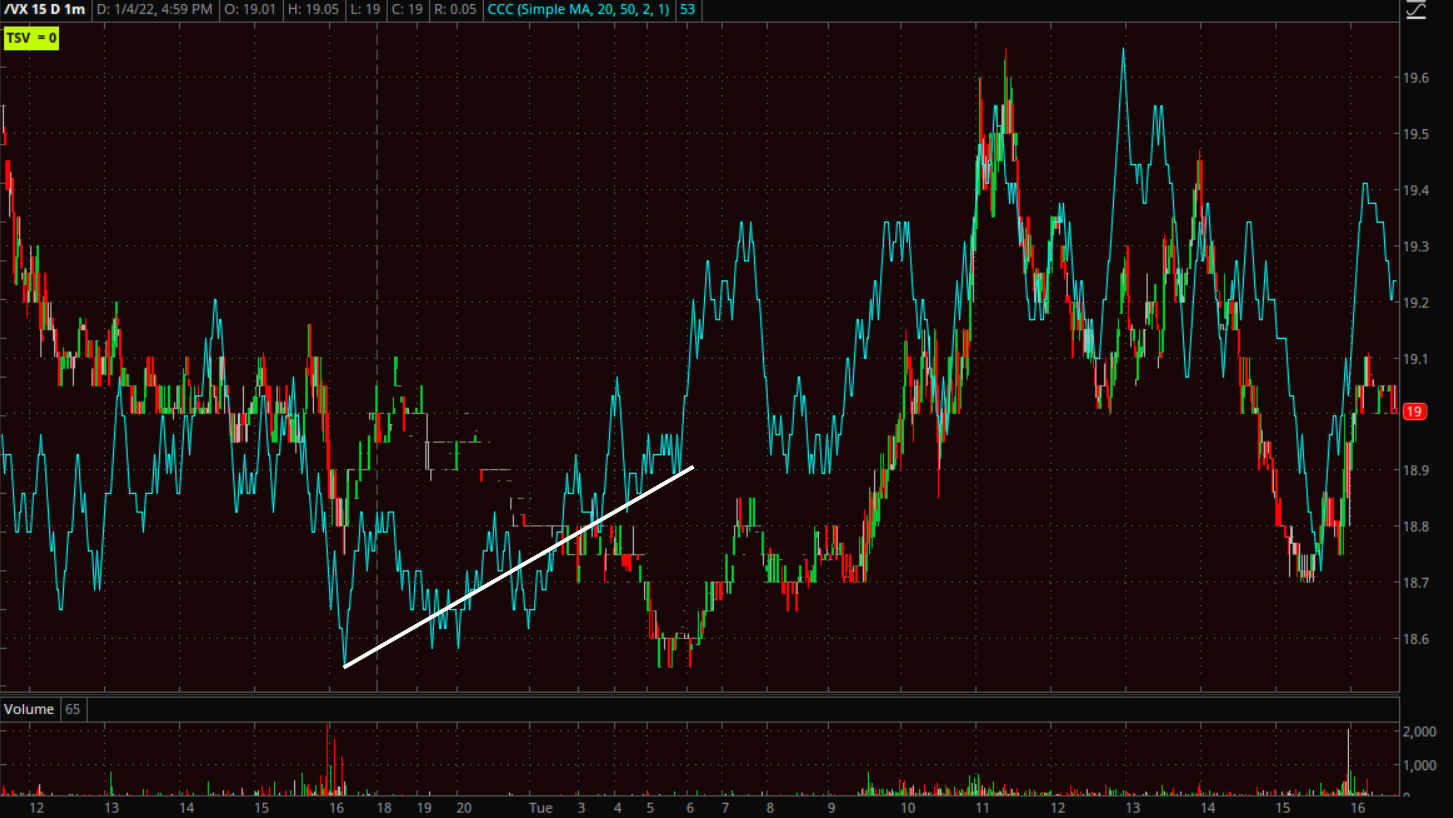 VIX futures (1m) positive divergence before the cash open and the first of the new year.
S&P sectors
Cyclical/Value stocks notably outperformed at the expense of growth stocks as can be seen by Energy, Financials, Industrials and the Materials sectors’ gains. Meanwhile, the mega-cap heavy Consumer Discretionary, Communications and most of all, Technology, underperformed. Health Care, a heavily weighted sector, was the worst performing.
Like yesterday recovery stocks like travel-related outperformed early on, but stay-at-home stocks displayed better relative performance as the day went on. On a related note, daily COVID-19 cases in the U.S. topped one million yesterday.
Materials ⇧ 1.23 %
Energy ⇧ 3.46 %
Financials ⇧ 2.63 %
Industrial ⇧ 2.01 %
Technology ⇩ -1.06 %
Consumer Staples ⇧ 0.67 %
Utilities ⇩ -0.31 %
Health Care ⇩ -1.32 %
Consumer Discretionary ⇩ -0.61 %
Real Estate ⇩ -0.39 %
Communications ⇩ -0.22 %
Banks (KBW Bank index +3.4%) outperformed amid the rise in yields and the curve steeping.
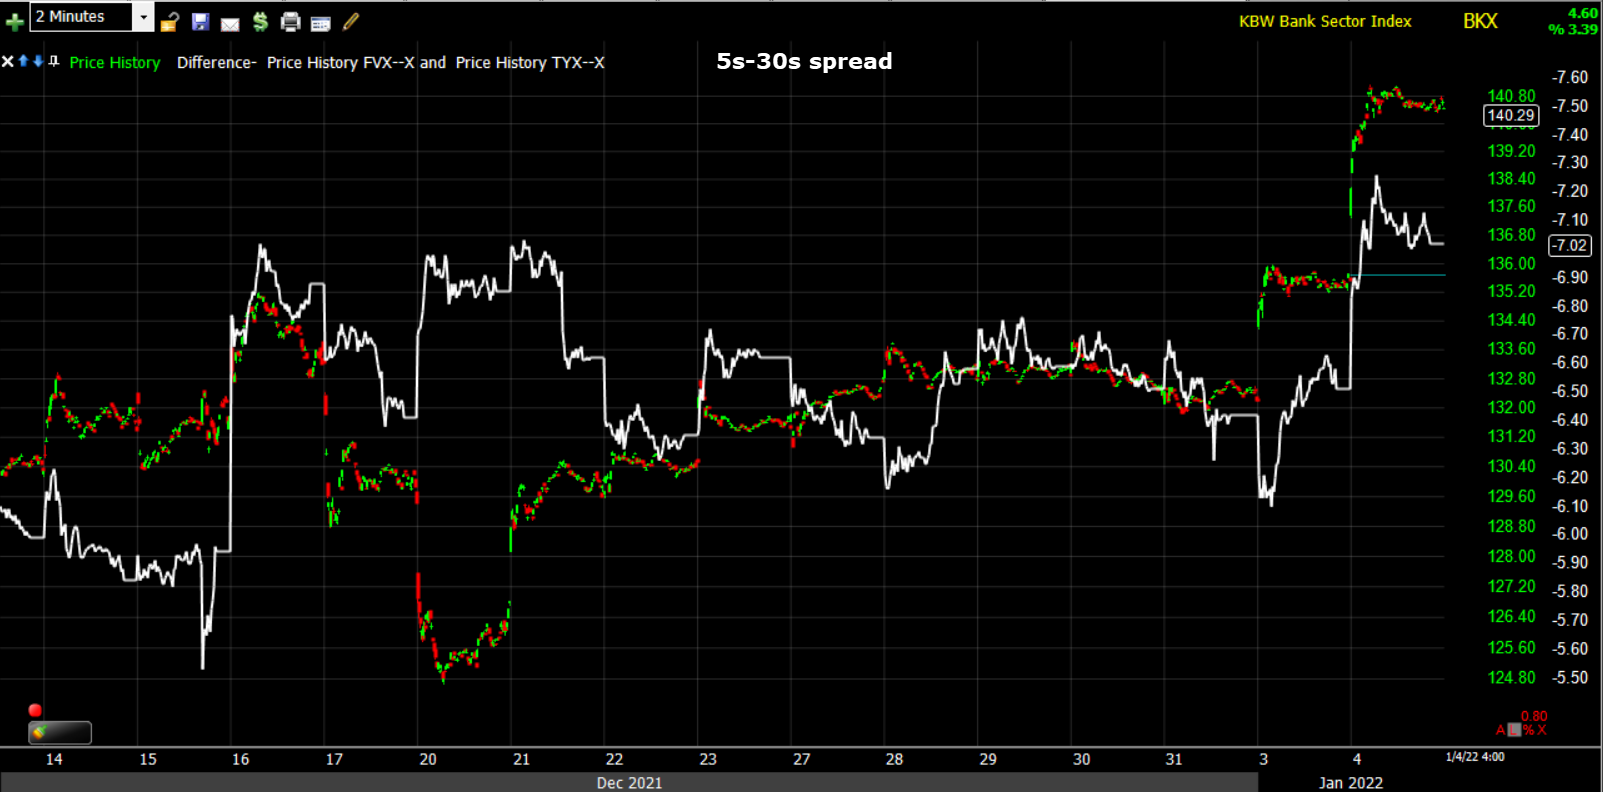 KBW Bank Index (2m) and the 5-30 yield curve which actually led the banks higher off the December 20th market lows.
However, looking at the bigger picture, banks could have some serious downside risk as the Fed tightens monetary policy.
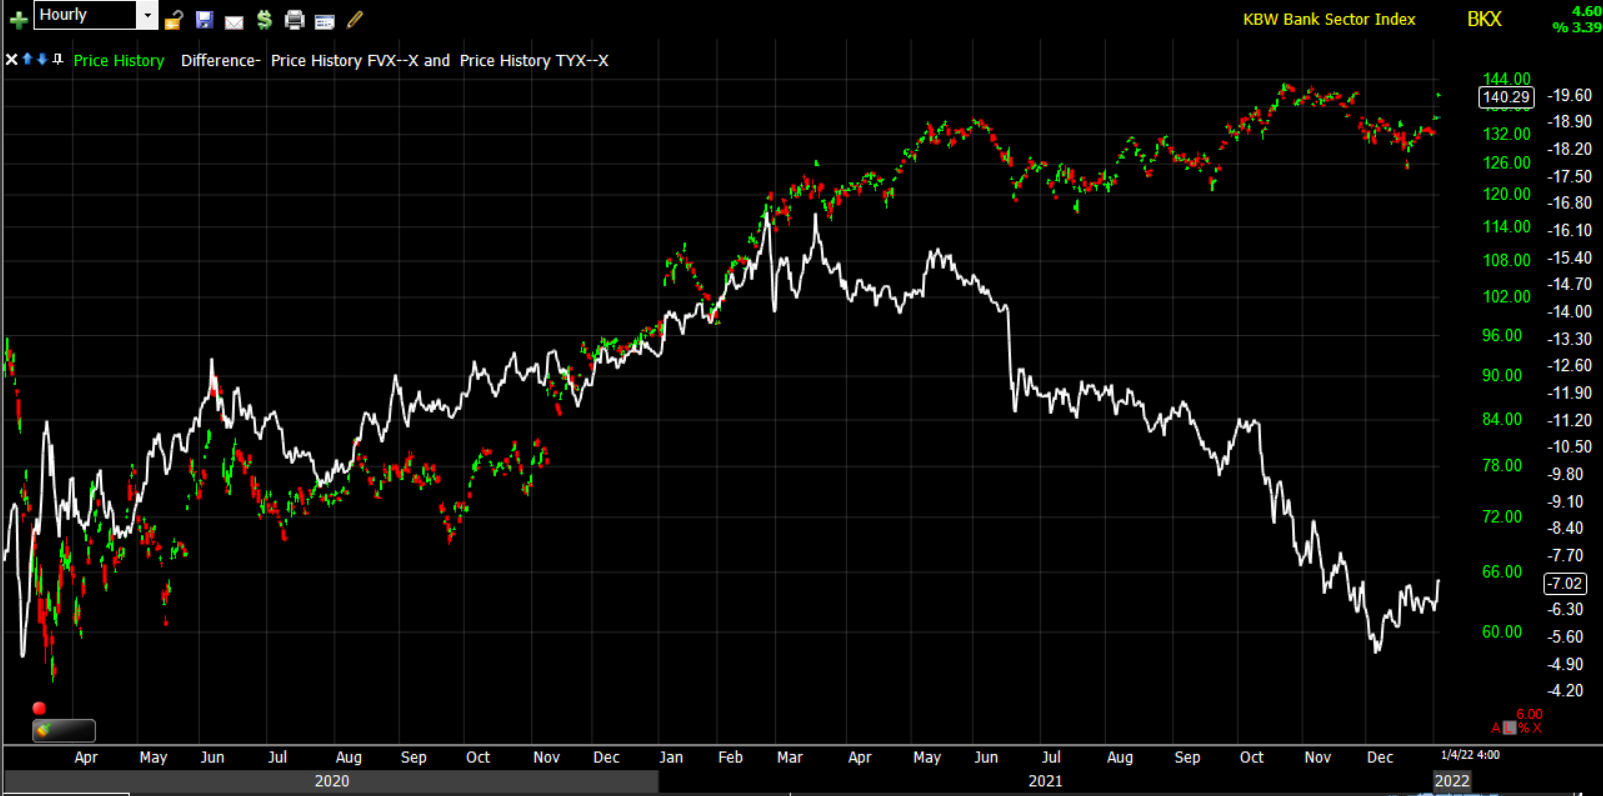 KBW Bank Index (60m) and the 5s-30s yield curve which nearly completely retraced the entre steepening form the COVID crash lows.
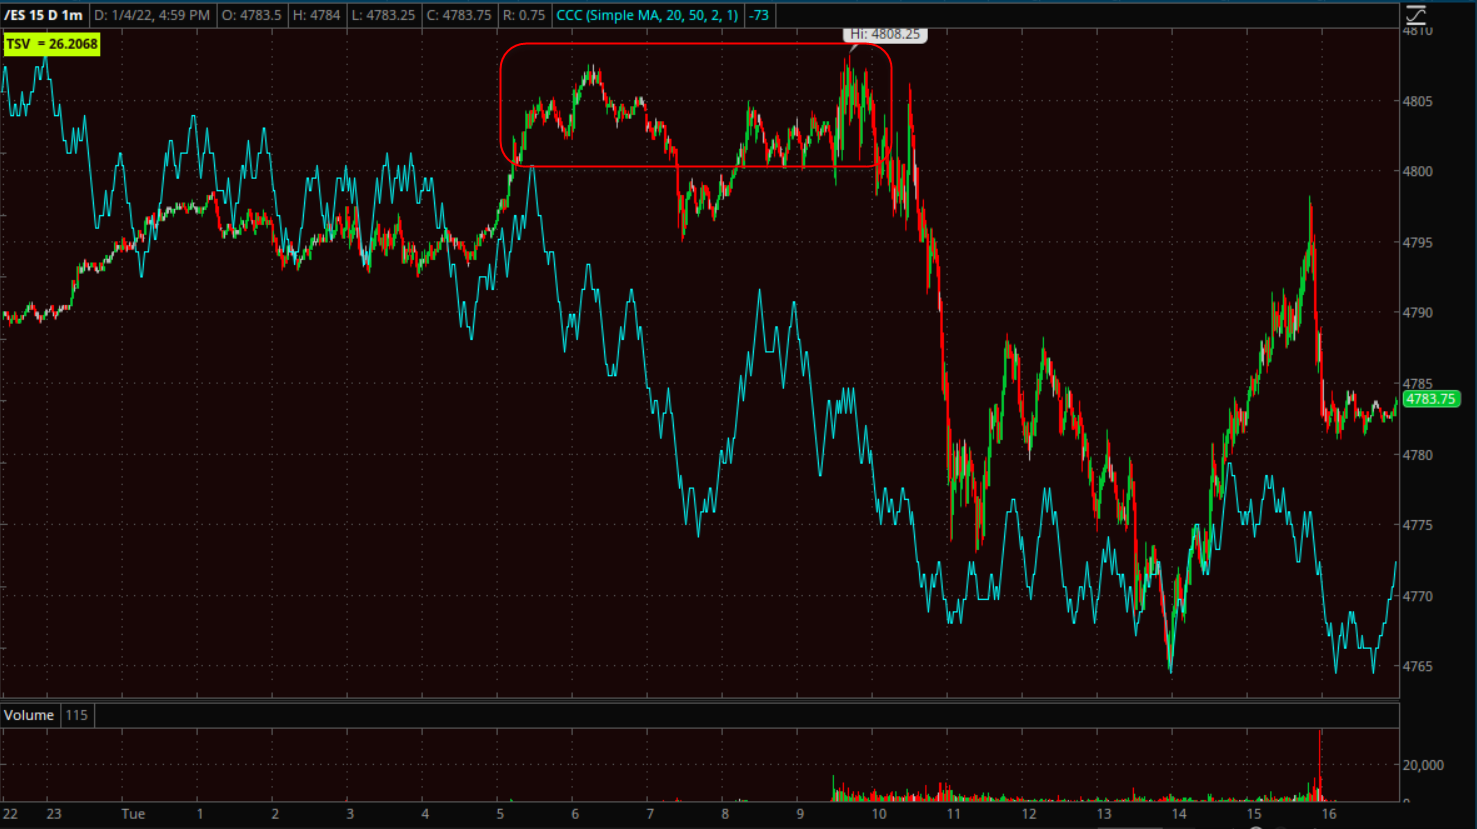
Semiconductors (SOX -0.45%) tried to breakout today, but couldn’t hold.
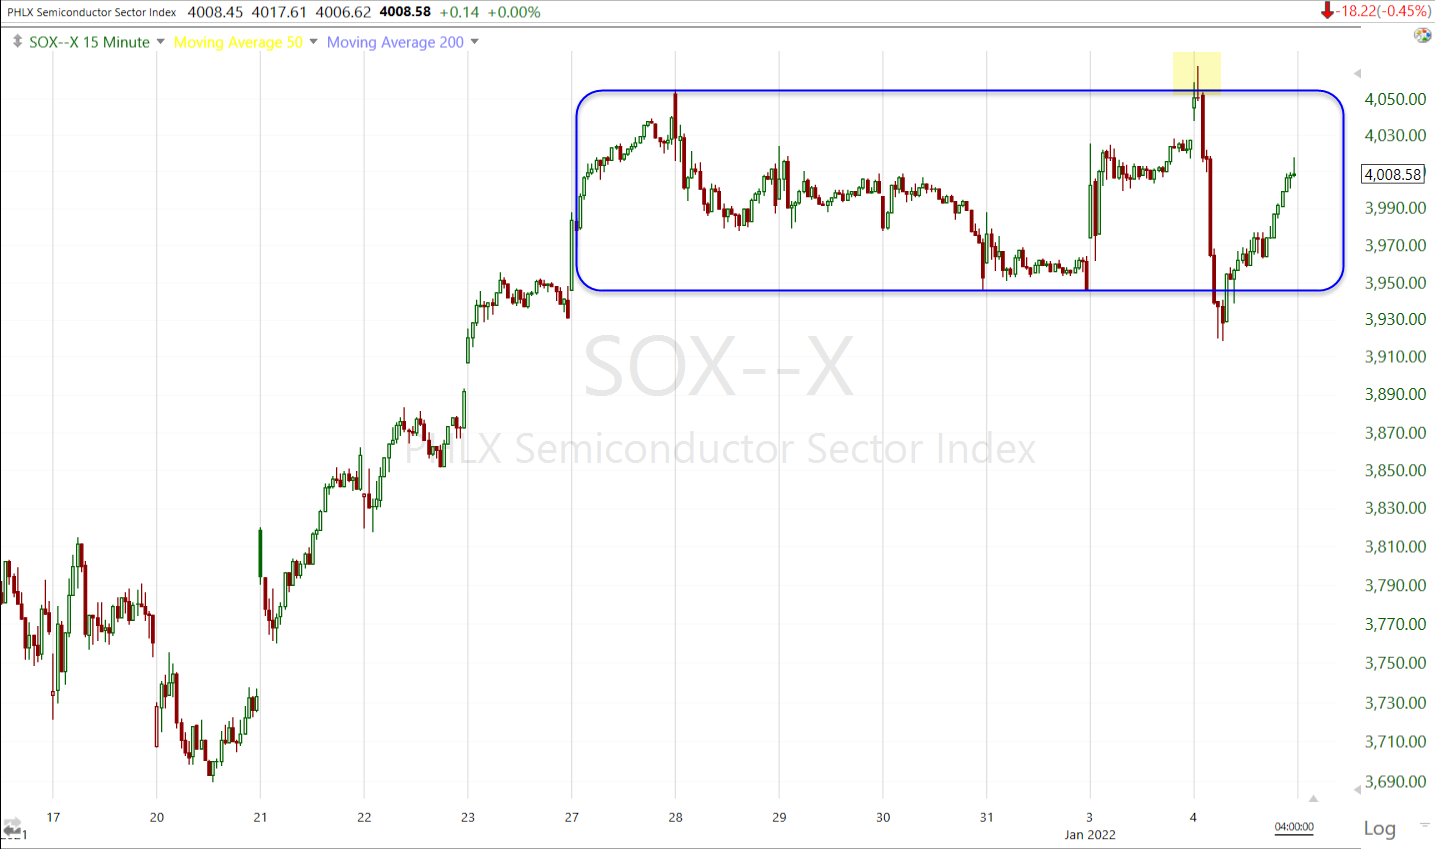 SOX (15m)
Internals
NYSE Advancers (1670) just barely outpaced Decliners (1614) on notably heavier Volume of 950.3 mln shares (vs. 845 mln yesterday) as China and the U.K. come back from holidays. NASDAQ Decliners (2637) solidly outpaced Advancers (1857). While not meeting my standard parameters for a 1-day oversold condition, NASDAQ was much closer than NYSE which factors into the scenario laid out in the Afternoon Update moving forward the next few days.
The dominant price/volume relationship for the Dow and S&P was Close Up/Volume Up, and for the NASDAQ Close Down/Volume Up. Being China and the U.K. just returned from holidays to trade for the first time today, higher volume is expected and I don’t see any utility in the relationship yet, but increasingly as we get back to normal trade the measure should prove useful.
While still nowhere near the December highs, New NYSE 52 week lows hit the highest levels since the oversold rally off the deep oversold lows of December 20th.
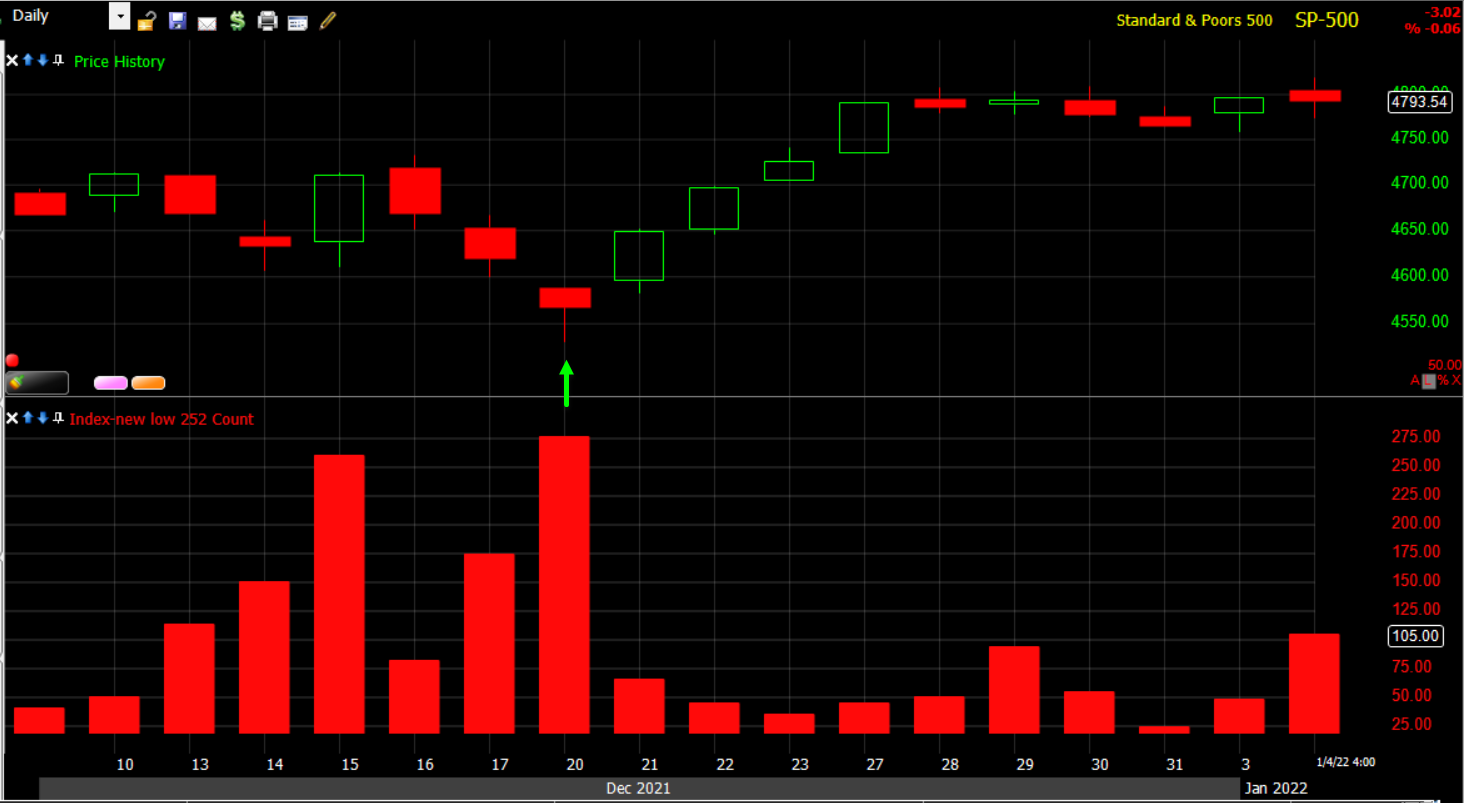 SP-500 (daily) and NYSE new 52 week lows.
Treasuries
Treasuries have posted the worst 2-day loss since 2009 to start the year.
The 2-year yield decreased two basis points to 0.76%, while the 10-year yield increased four basis points to 1.67% in more bear-steepening (2Y -2bps, 30Y +6bps) trade. However, as noted in the Afternoon Update, there’s a loss of momentum as bond yields near resistance.
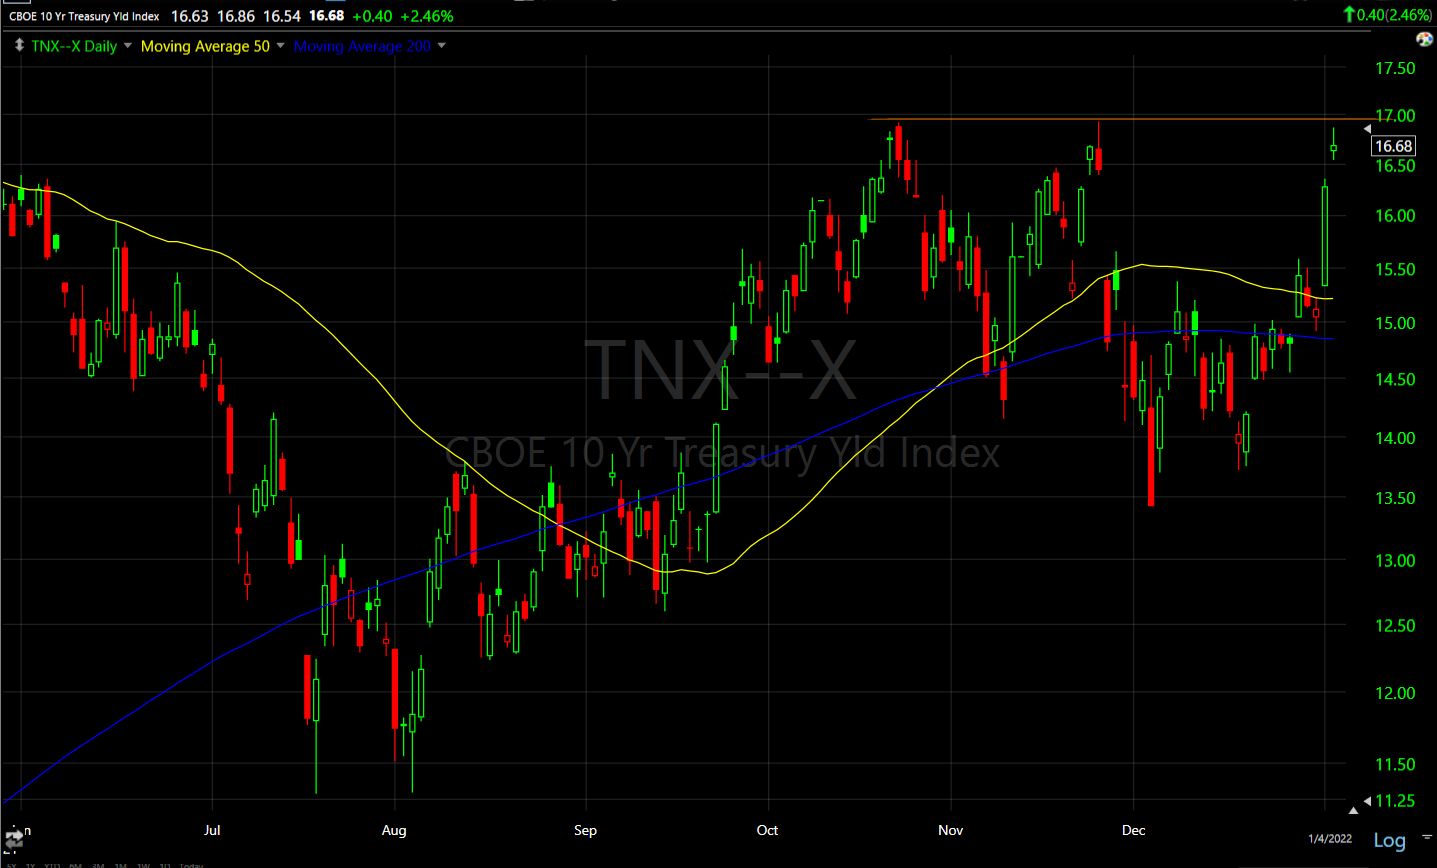 10-year yield (daily) with a smaller bodied candle as it moves toward recent resistance.
Notably, the 10-year yield has now risen 16 basis points to start the year, reflecting the probability that 2022 will be marked by a higher-interest rate environment as expected with the Fed tightening. The market is pricing in 3 full Fed hikes this year, but pulling the liftoff forward almost every day, with the March meeting now 72% “priced in”.
The 5-year yield, which has been a proxy for persistent inflation this year, added 1 basis point after 10 bp yesterday. The 5-year reached the highest level since February 2020.
The 30-year yield jumped as high as 2.10%, but the daily chart shows technical factors (200-day sma) and a longer upper candlestick which indicating the probability of the advance slowing in the next few days as well. Yields on long maturities are likely also influenced by heavy supply of new corporate bonds following a year-end lull.
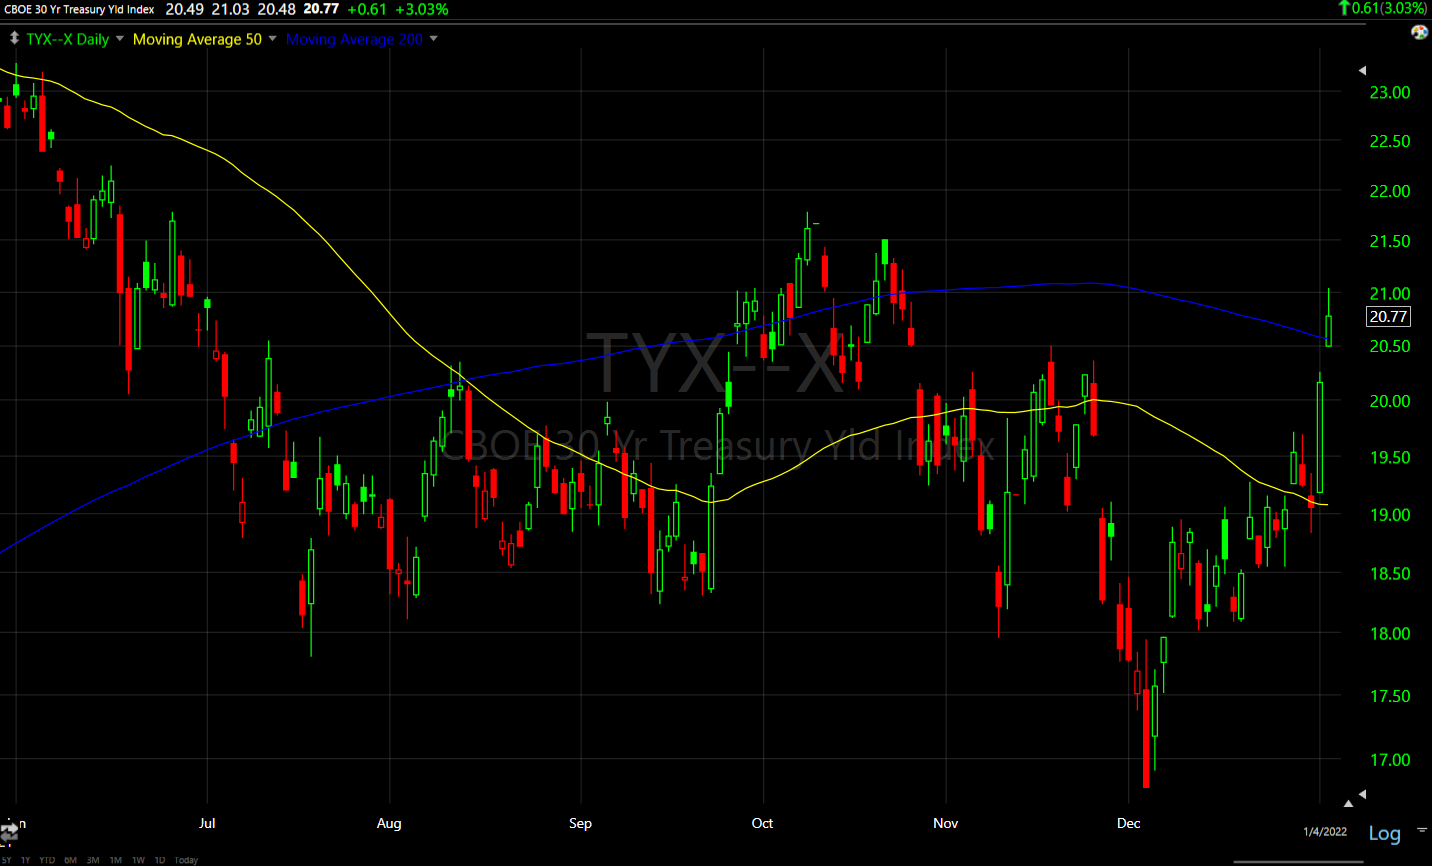 30-year yield (daily) with the 200-day sma (blue) and a longer upper candle wick indicating higher yields failed to hold.
After yesterday’s leading negative 3C divergence in HYG, high yield credit underperformed and diverged with the S&P more today.
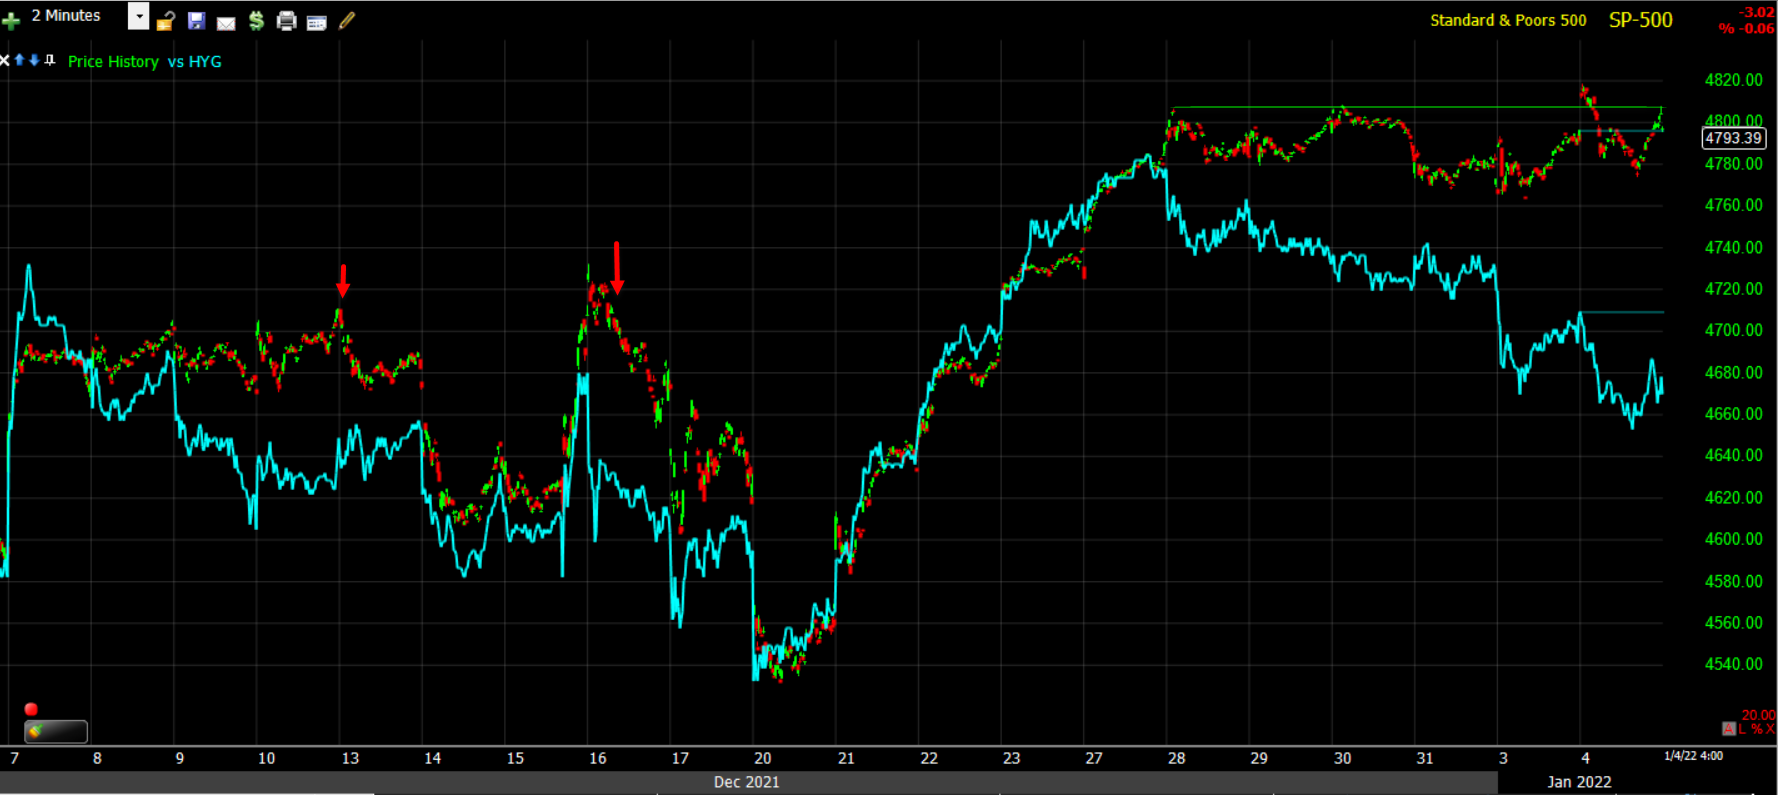 SP-500 (2m) and HYG (blue) – HY credit’s relative weakness is the most notable red flag on my radar.
Currencies and Commodities
The U.S. Dollar Index dropped after this morning’s ISM Manufacturing print disappointed (following yesterday’s PMI Manufacturing survey) due to relatively weaker U.S. manufacturing data vs. most of the rest of the world’s data today, but still managed to gain 0.1% to 96.28.
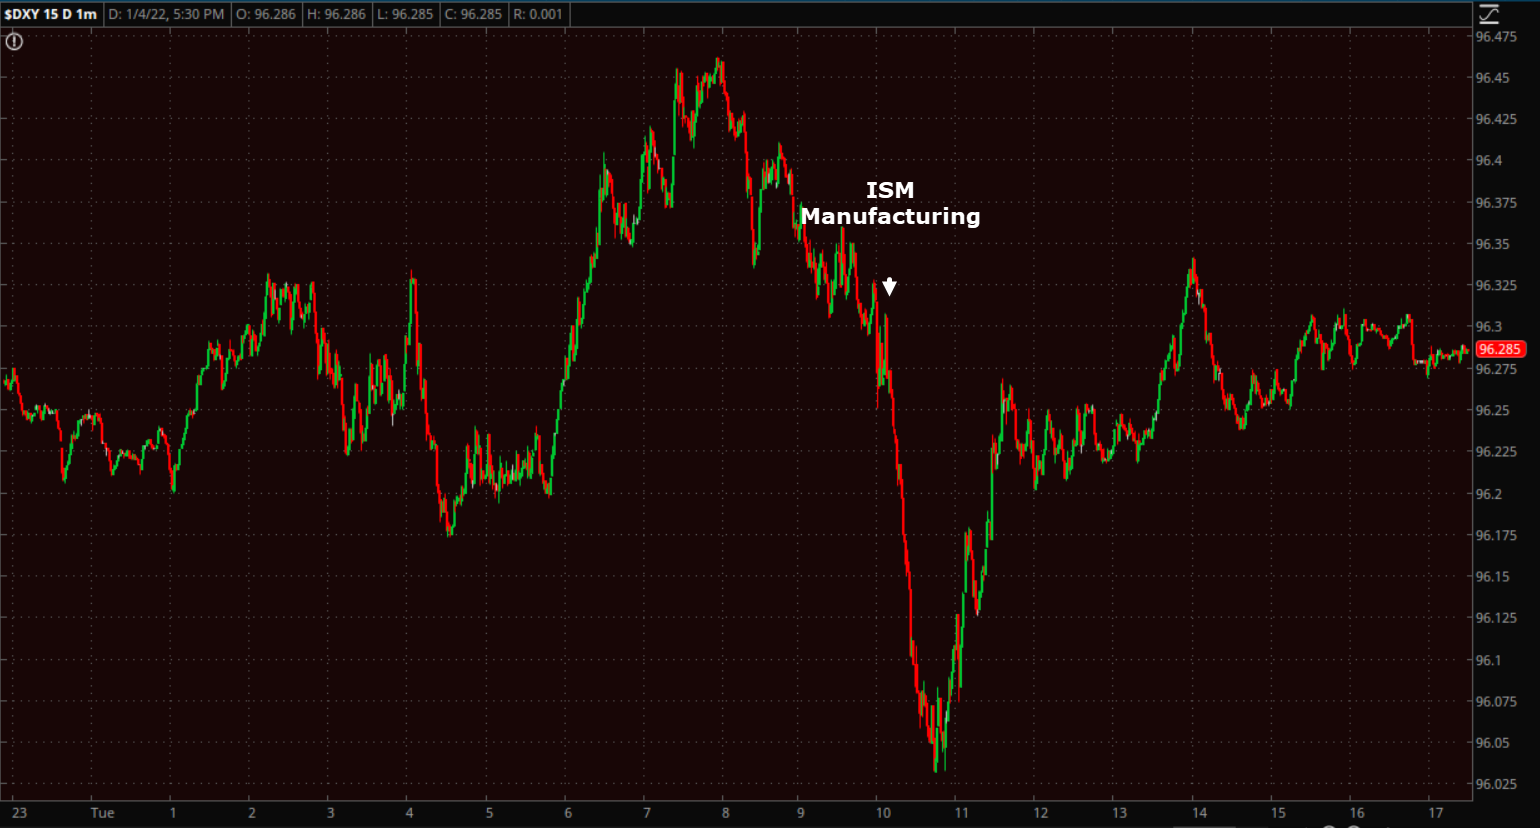 U.S. Dollar Index (1m)
The Dollar Index daily chart remains constructive wiht a bullish consolidation and trading above its 50-day sma.
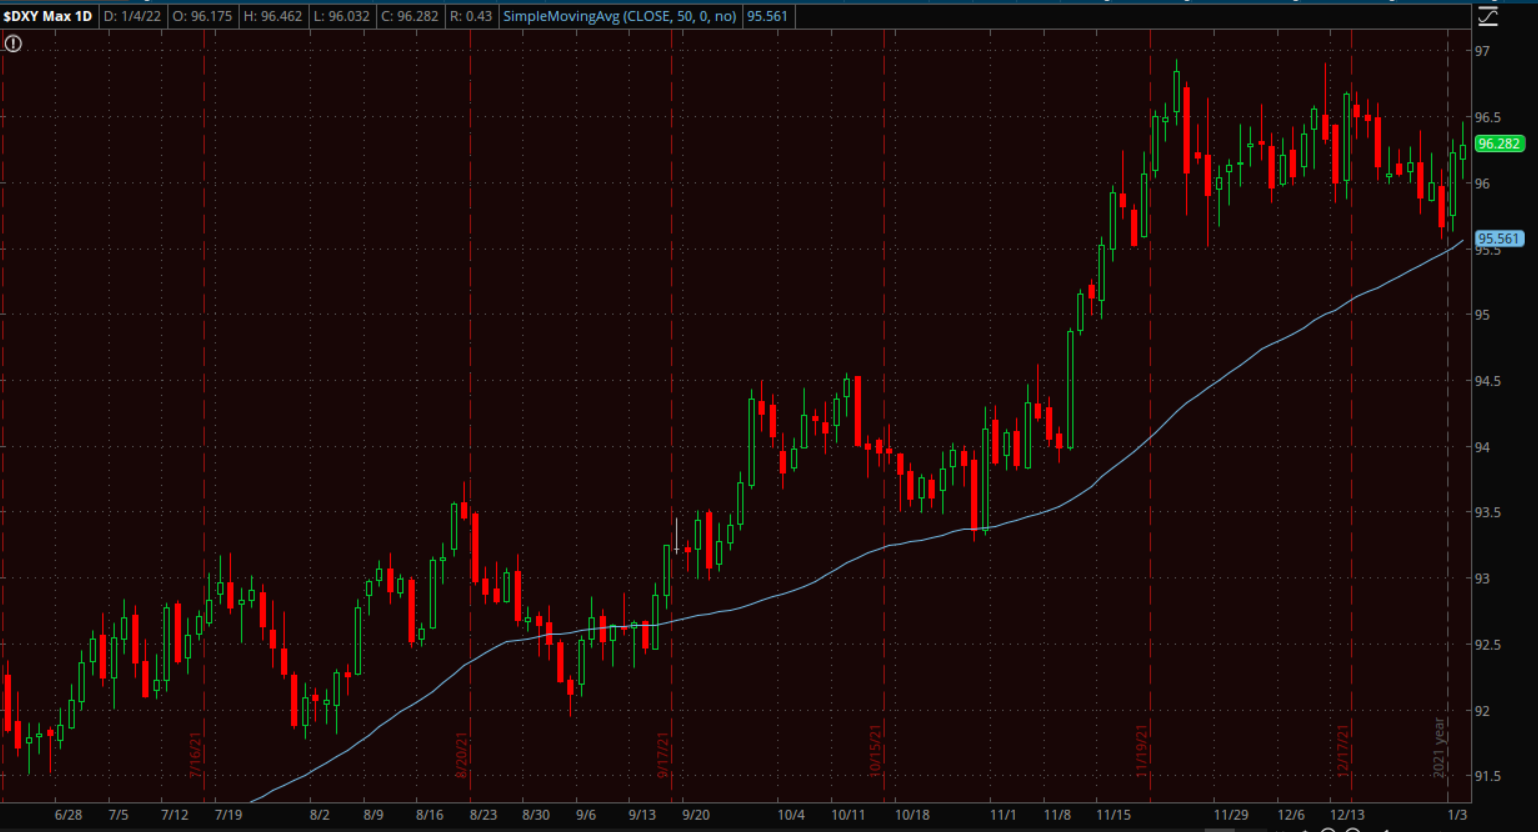 U.S. Dollar Index (daily) and 50-day sma
And the Australian Dollar got a bounce as a result…
 AUD/USD (60m) bouncing after yesterday’s weakness, and…
 AUD/USD (daily) after holding its 50-day sma yesterday.
However, it’s still worth monitoring closely.
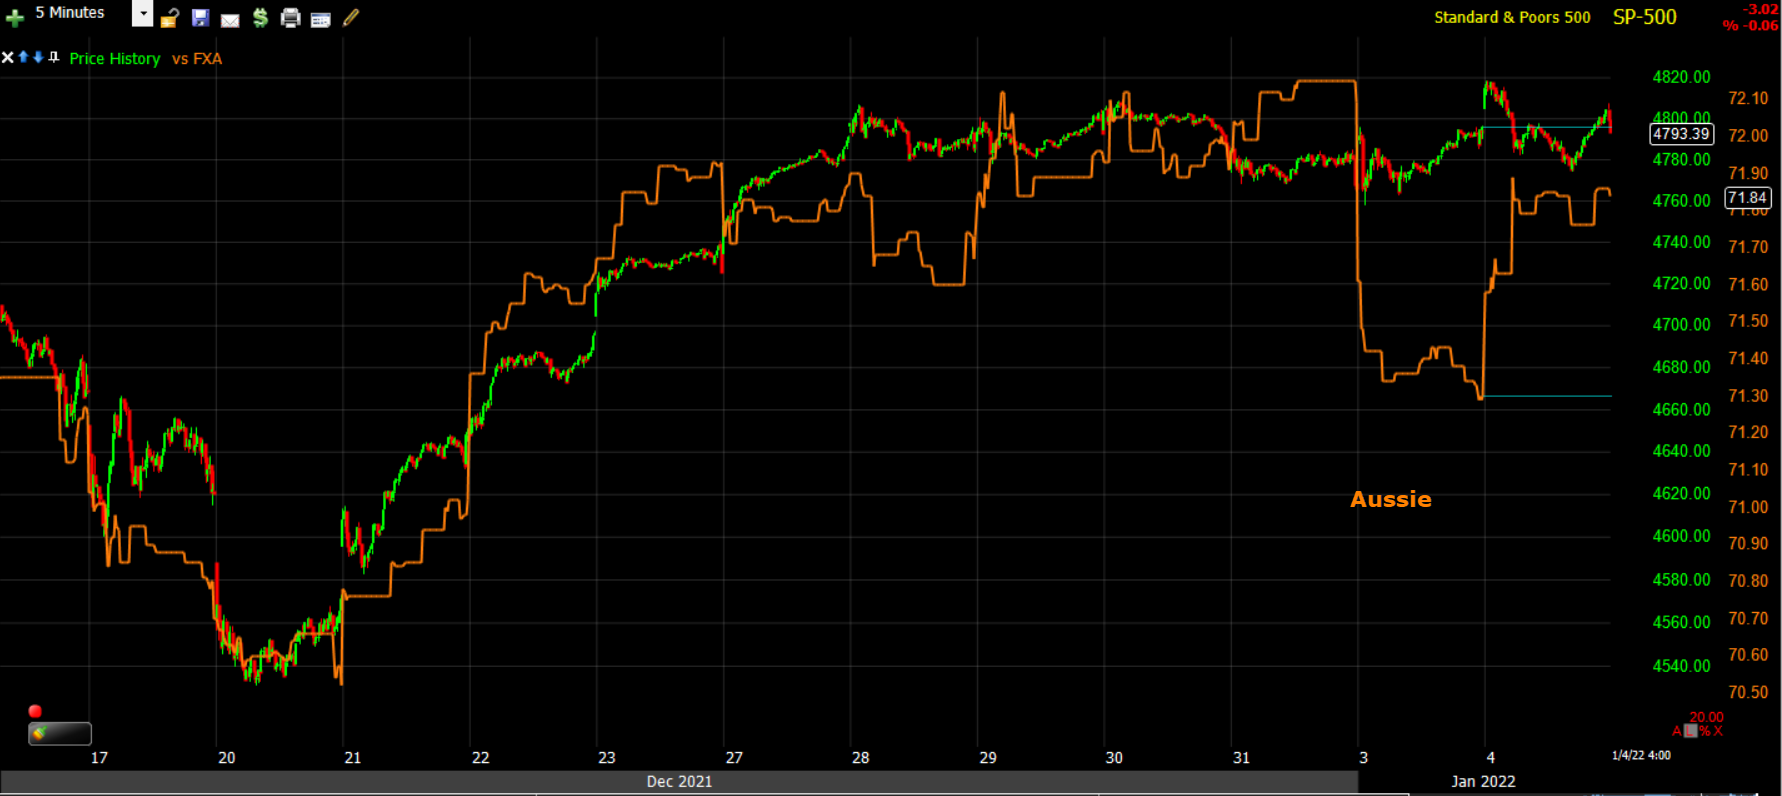 SP-500 (5m) and proxy for the Australian dollar.
WTI crude futures gained +1.3% to close at $77.00 per barrel as OPEC didn’t surprise markets and increased production by 400k bbl a day as expected.
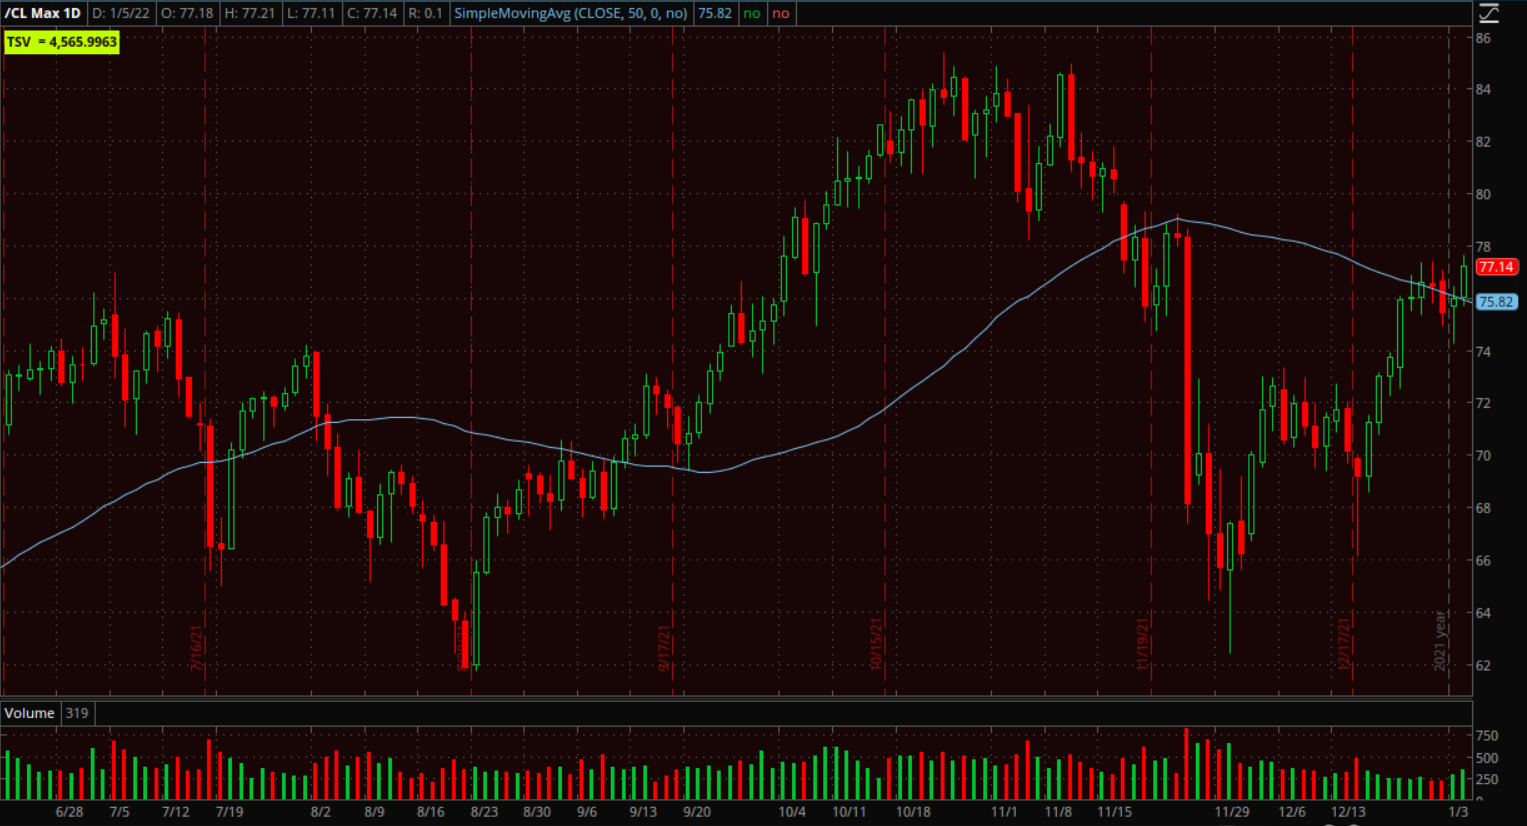 WTI Crude (daily) and 50-day sma – has nearly retraced all the Omicron scare losses and closed solidly above the 50-day.
Gold futures gained +0.8% to $1,814.60/oz, rebounding off Monday’s nearly two-week lows, even as yields across the curve showed another day of decent gains.
Bitcoin is still dead-money for the time being, trapped between price support and technical resistance (200-day).
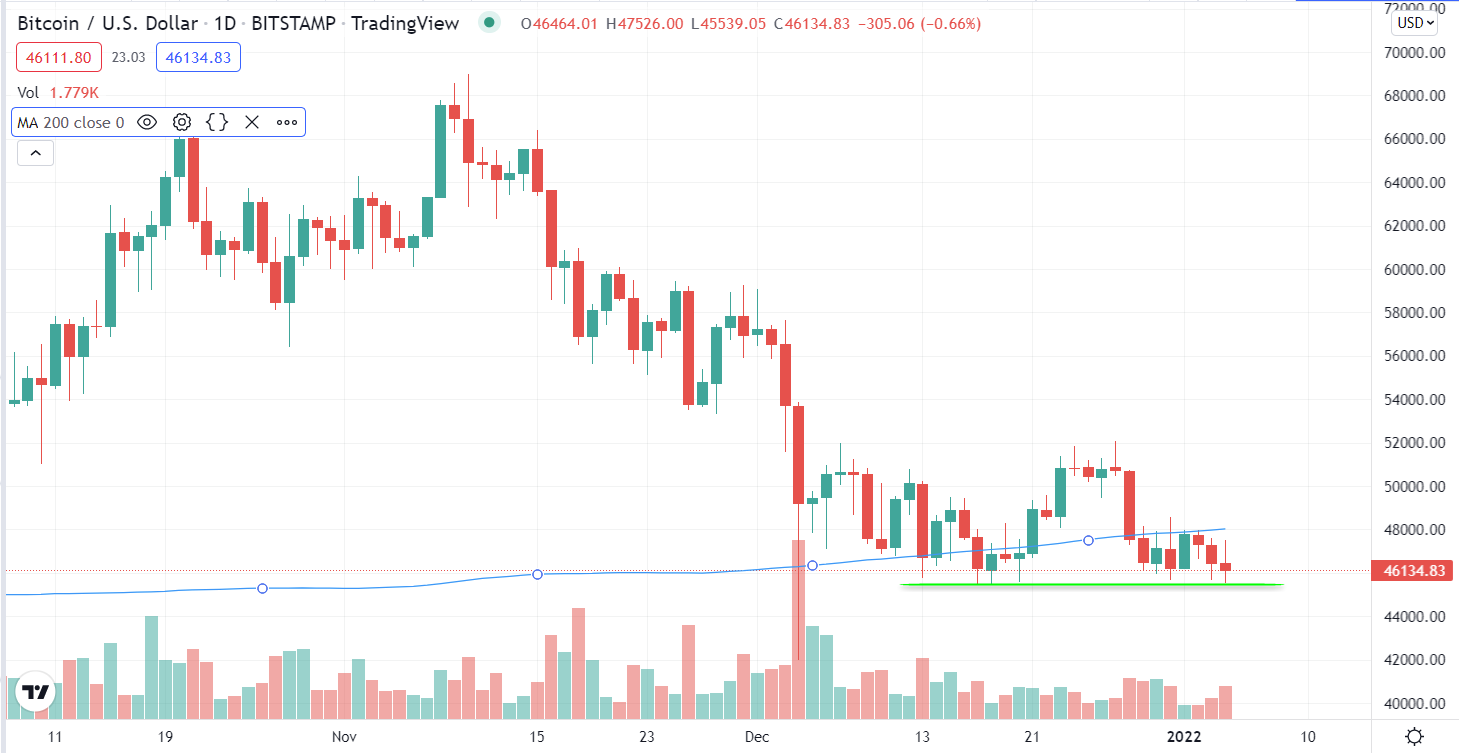
BTC/USD (daily) w/ 200-day sma
Summary
Mega-caps didn’t react as I’d normally expect yesterday with sharply rising yields for reasons mentioned above, but overall the influential group is showing weakness as yields rise which is the gist of the takeaway from my Afternoon Update of how we may find an opportunity in the next few days.
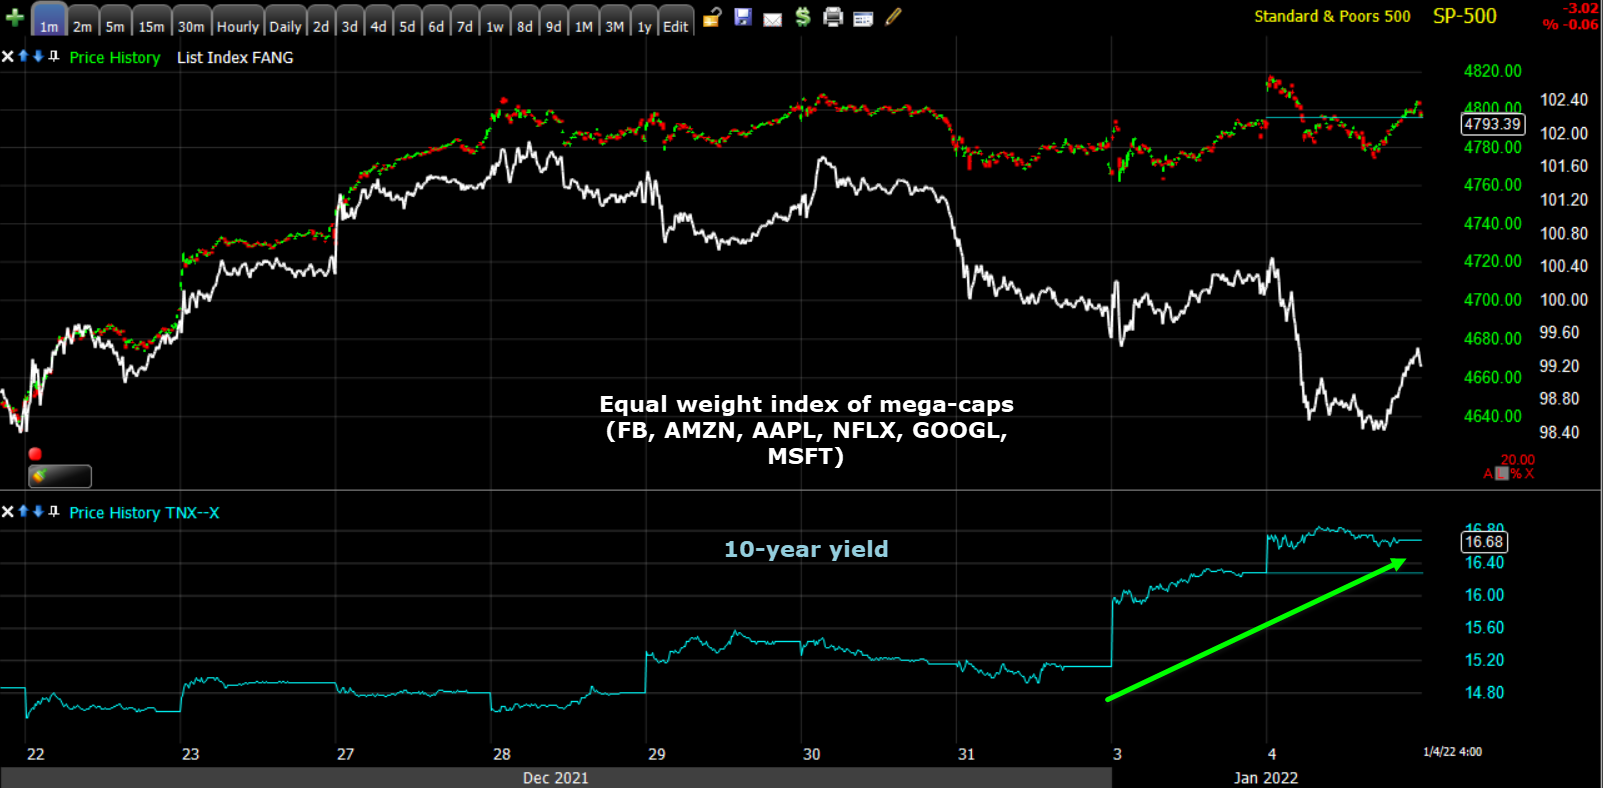 SP-500 (1m) and an equal weight index of mega-caps (white), plus the 10-year yield (blue).
I think the NASDAQ’s internals speak to a decent probability of the scenario I laid out in the Afternoon Update.
Real yields (nominal less inflation) are rising with nominal yields and that suggests that the NASDAQ-100 underperforms Small Caps in the near term as well.
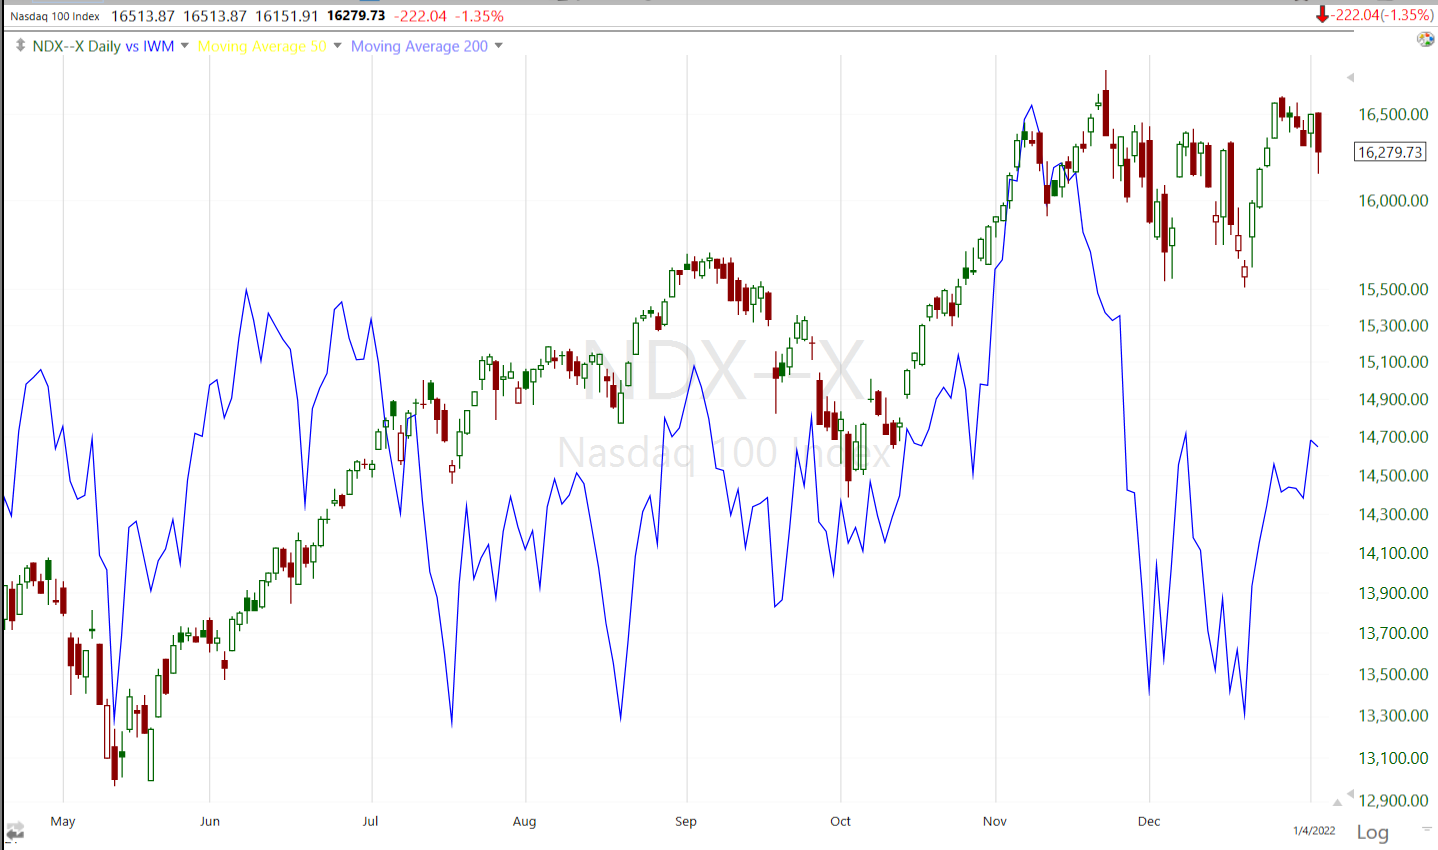 NASDAQ-100 (daily) and Small Cap IWM (blue)
In addition to the Afternoon Update that lays out a plausible scenario for the next few days, also see “Failed Breakouts in the Works?”as the post compliments the Afternoon Update.
Overnight
Chinese stocks will be closely watched after they suffered their worst start to the new year since 2019. An index of New York-traded companies with their business predominantly in China fell the most in more than two weeks.
S&P futures are down -0.2% tonight as the general (weaker) 3C tone has not changed.
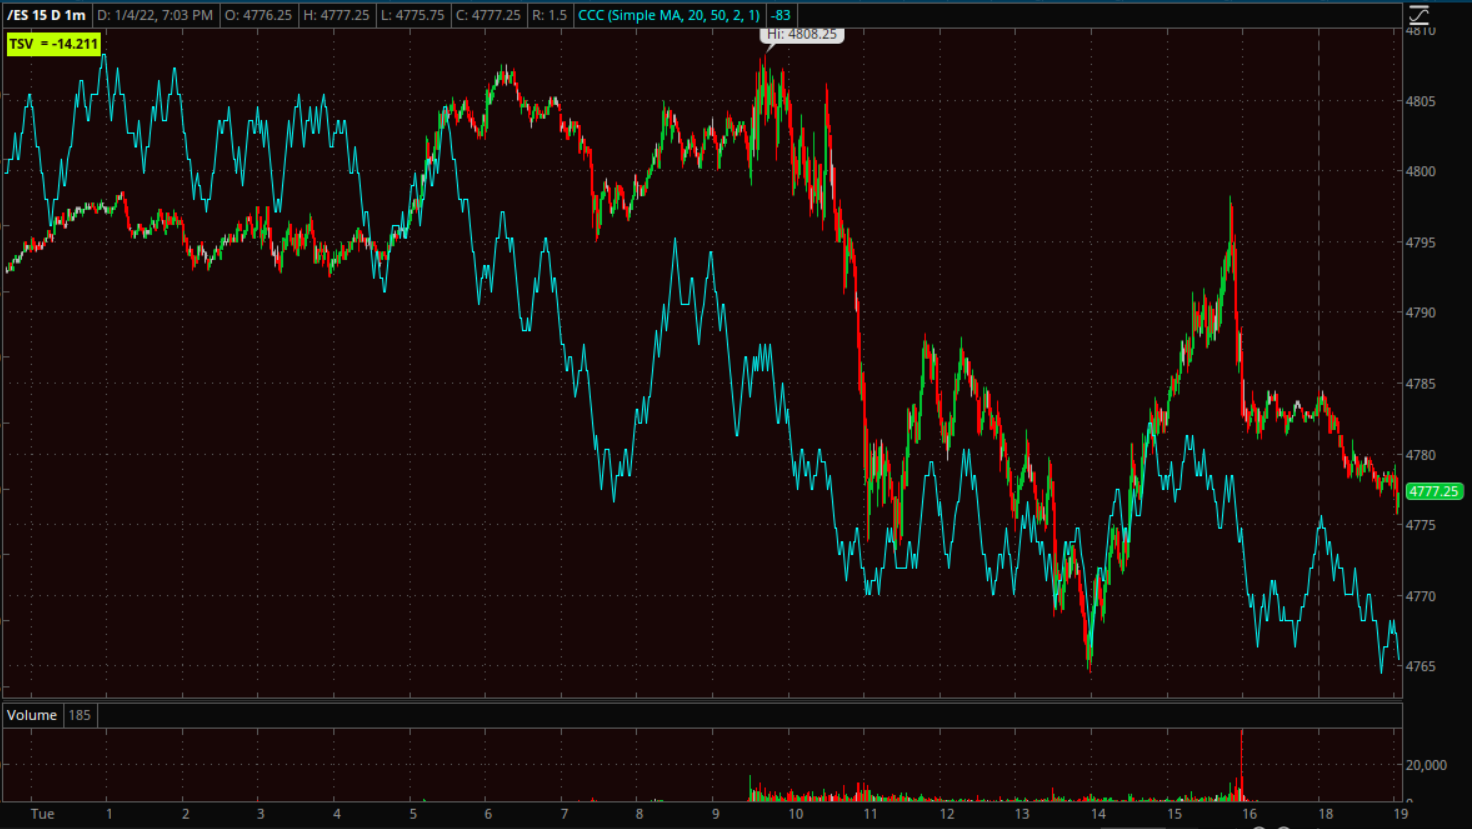 ES (1m)
VIX futures’ 3C chart is similar to the one posted above and trading in line with price after this morning’s positive divergence.
WTI Crude futures are flat, as are Gold futures.
Looking ahead, investors will receive the ADP Employment Change report for December, the FOMC Minutes from the December meeting, the preliminary IHS Markit Services PMI for December, and the weekly MBA Mortgage Applications Index on Wednesday.
Also this week…
- FOMC meeting minutes scheduled for release Wednesday which may shed more light on the potential pace of rate hikes. Noted long-time dove, Minneapolis Fed President Neel Kashkari, said he supports two rate increases this year to counter risks posed by inflation.
- Fed’s Bullard discusses the U.S. economy and monetary policy in an event on Thursday
- Fed’s Daly discusses monetary policy on a panel Friday
- U.S. Payrolls Friday
- ECB’s Schnabel speaks on a panel Saturday