Stock Market Daily Wrap
The S&P 500 fell -1.4% on Thursday, as the growth stocks succumbed to renewed selling interest in spite of lower interest rates. Growth heavy-NASDAQ-100 fell the most. The retreat in growth stocks started shortly after the open, even as the Treasury market remained calm.
There were a couple of yellow flags mentioned in the Early Update. The most notable was a negative 3C divergence in HY Credit (HYG), although it wasn’t as sharp as early January. Another yellow flag was NASDAQ Composite’s A/D line weakening fairly fast. The growth related sectors have underperformed all of the new year as investors have rotated to cyclical Energy and Financials which tend to withstand higher yields more easily….to a point any way.
The Producer Price Index rose for the 20th straight month, it was up slightly less than expected at 9.7% YoY, yet still a record high. The Producer Price Index increased 0.2% m/m in December (consensus +0.4%), and core producer prices increased 0.5 % m/m (consensus +0.4%). Year-over-year, producer prices are up 9.7% (vs +9.6% in November) while core producer prices are up 8.3% (vs +7.7% in November). The index for final demand increased just 0.2% m/m (consensus 0.4%) amid a sharp decline in oil prices, but it’s important to note that oil prices have since reclaimed those losses.
Averages
The NASDAQ was up almost 0.5% after the PPI was released, so it’s interesting how things turned south as bond yields were well behaved. The Dow had been flat until the last hour of the day in which it was sold as well. Small Caps saw some early strength as investors rotated to cyclicals/value stocks and was up +1% in early trade, but it too succumbed to selling pressure.
S&P 500 ⇩ -1.42 %
NASDAQ ⇩ -2.57 %
DOW JONES ⇩ -0.48 %
RUSSELL 2000 ⇩ -0.76 %
 SP-500 (daily) was unable to find buyers at its 50-day (yellow) after posting a loss of momentum Doji Star candlestick yesterday and bearishly engulfing it today.
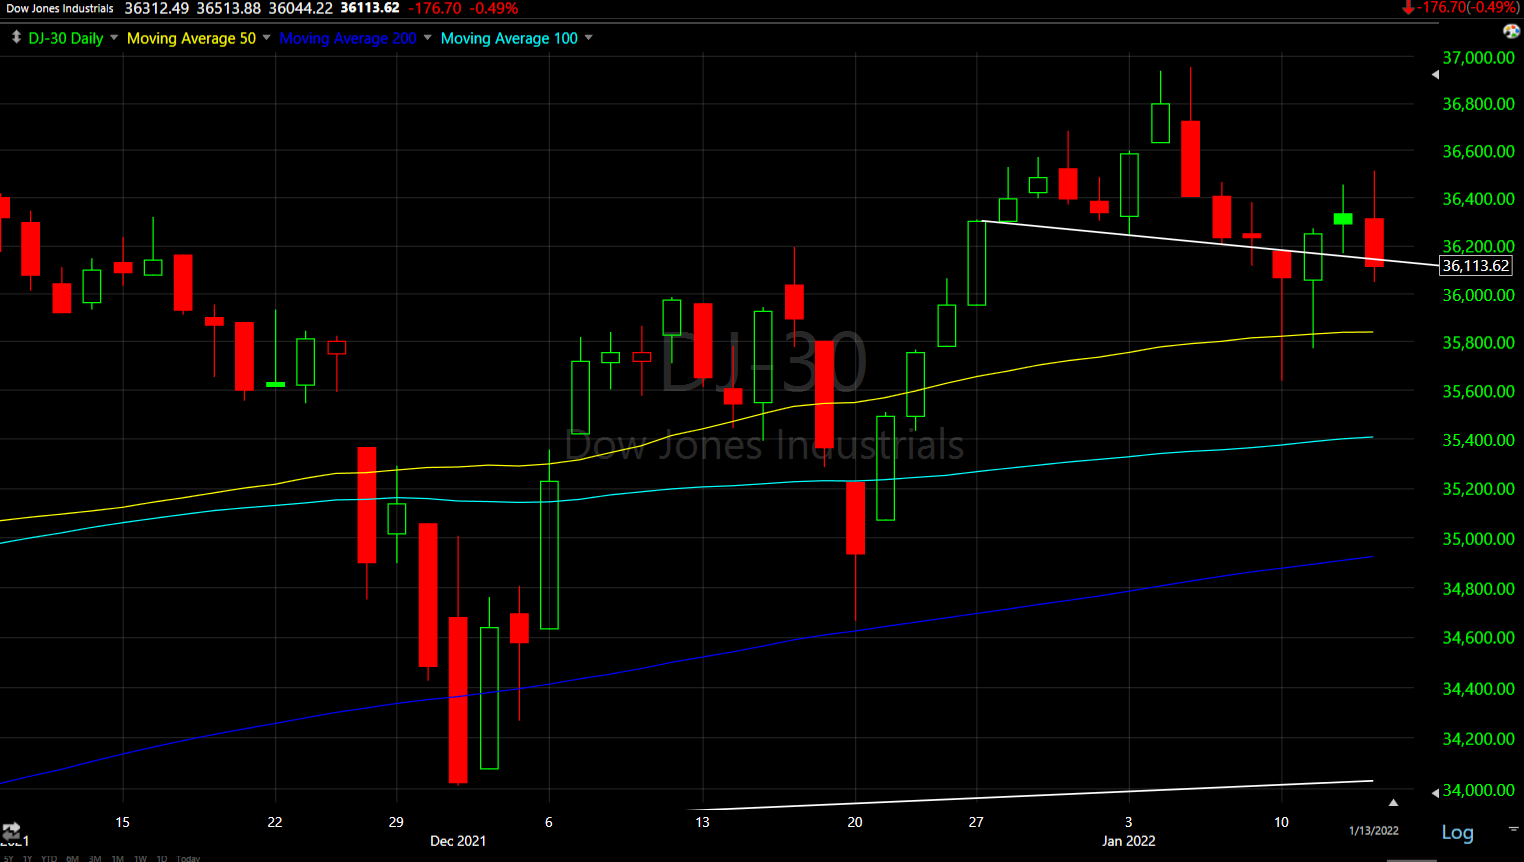 The Dow (daily) slipped under its trendline in the final hour of trade. Dow Transports (+0.2%) were modestly green.
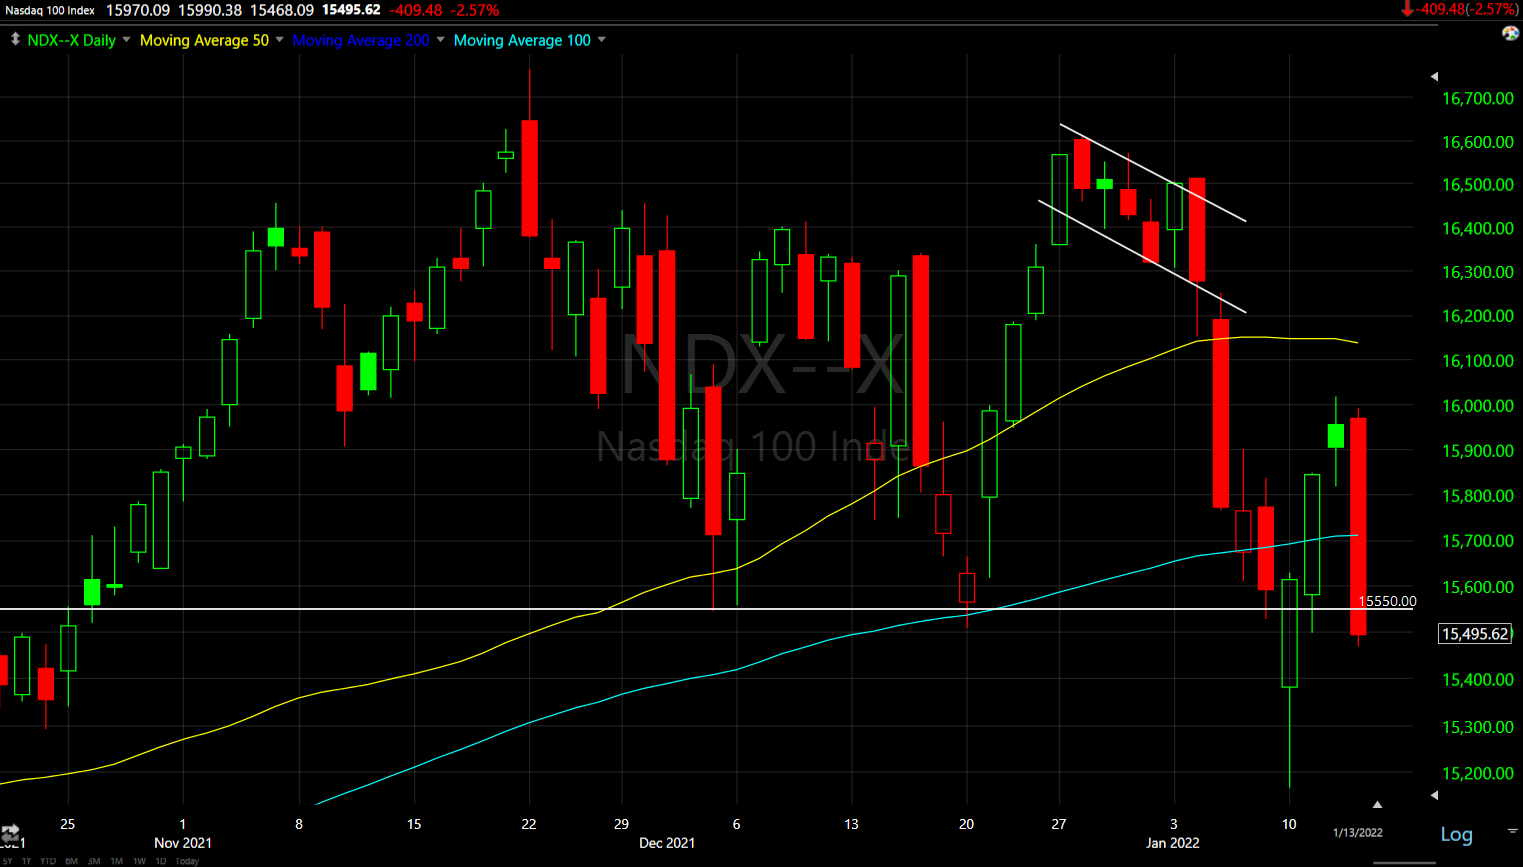 NASDAQ-100 (daily) took the brunt of the selling due to growth stocks under pressure and closed below support at the $15,500 area, and the lowest close since October.
 As pointed out yesterday, the NASDAQ Composite bounced off its 200-day Monday, but met resistance at its 100-day yesterday (yellow arrow), also the lowest close since October.
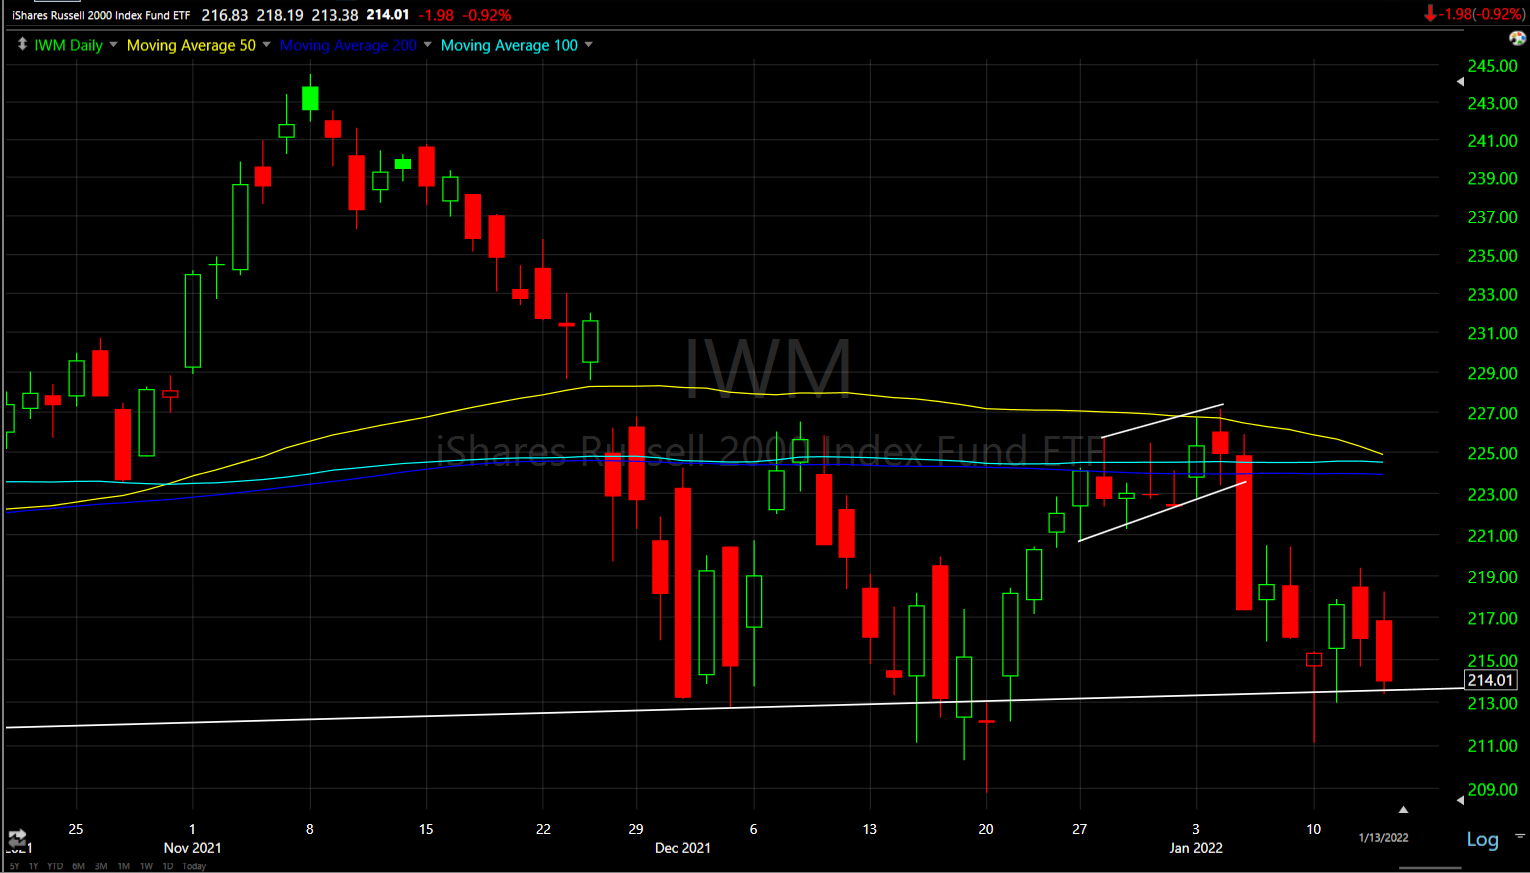 Small Caps haven’t been able to get any real traction, despite a rotational attempt this morning and closed at the 2021 trend line.
 Typically the most shorted stocks are squeezed on an oversold rebound from technical support, but I haven’t seen that at all this time and in fact you can see the MSI fading lower toward Monday’s low.
Judging from the cash 3C charts (other than Small Caps), I’m a little surprised at the extent of today’s weakness. All had a small relative divergence (except IWM which had a leading negative divergence), but usually that wouldn’t be consitient the kind of selling seen today, especially in the NASDAQ.
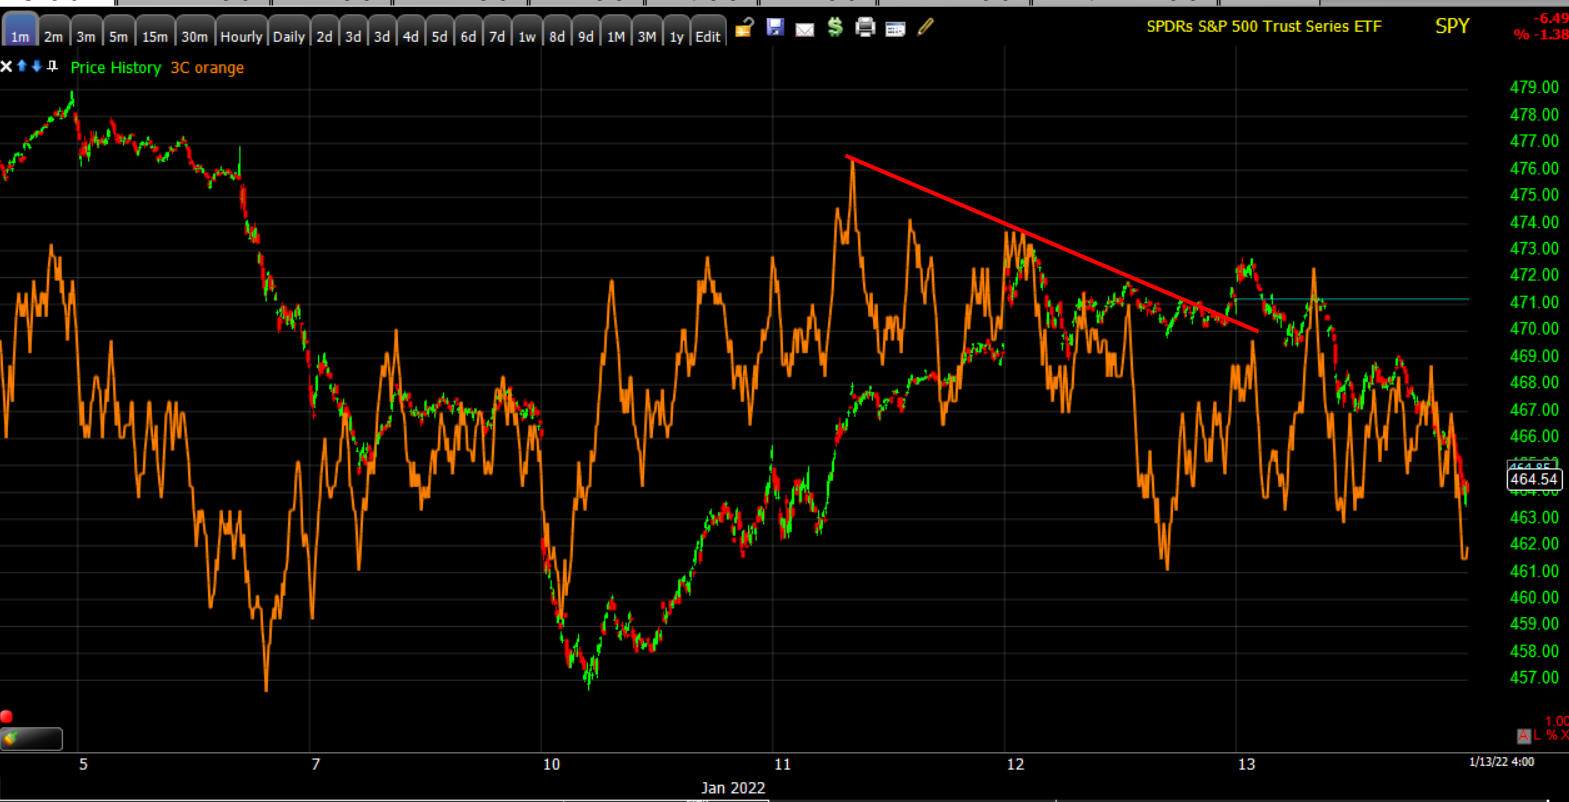 SPY (1m)
 QQQ (1m)
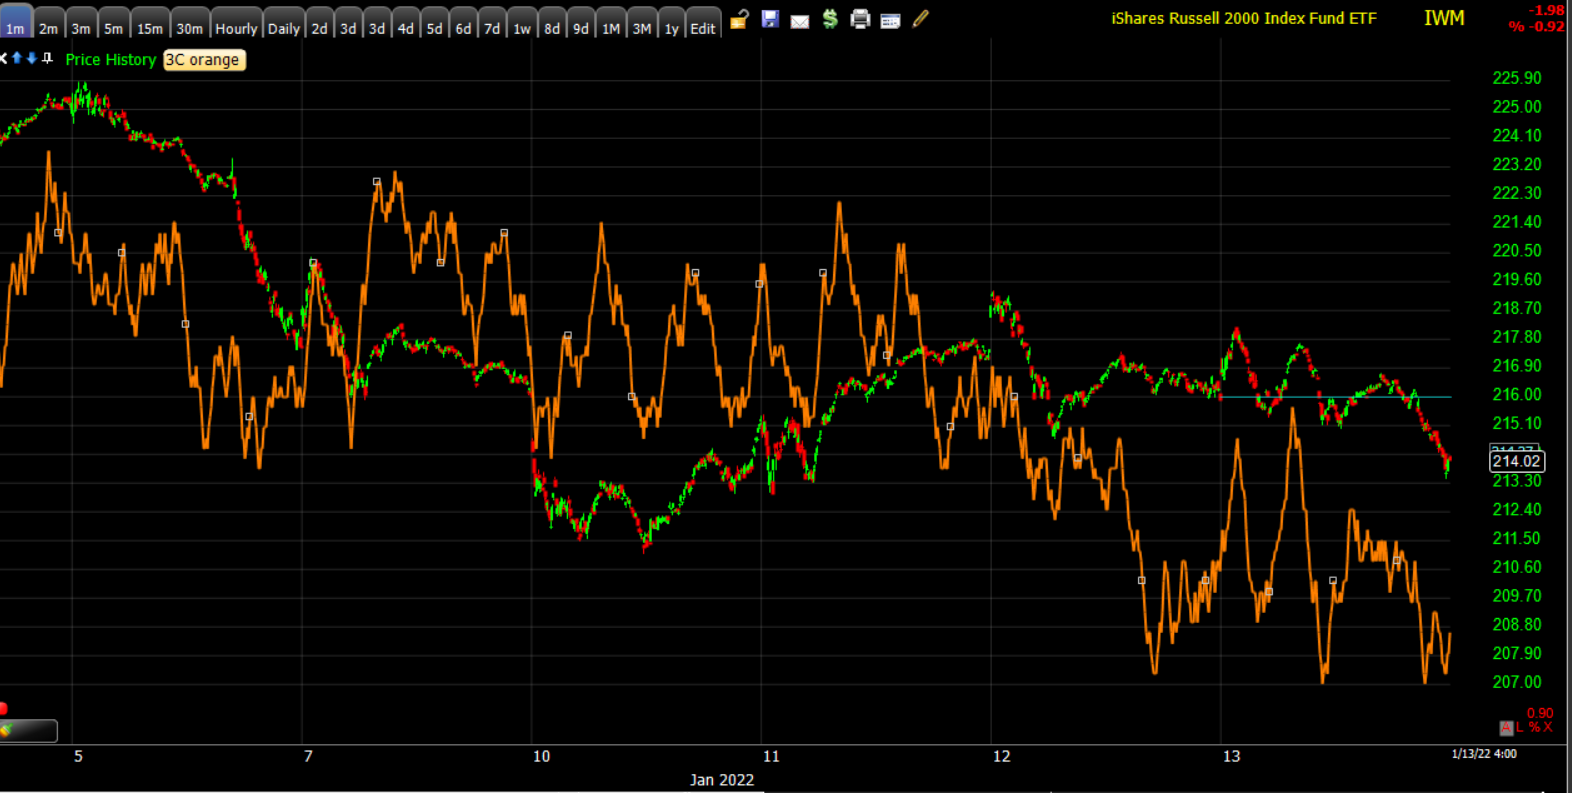 IWM (1m) has looked bad for most of the week, leading lower.
However, everything has to be viewed in context and the first week of the year’s selling did some major damage to the longer term, stronger 3C charts.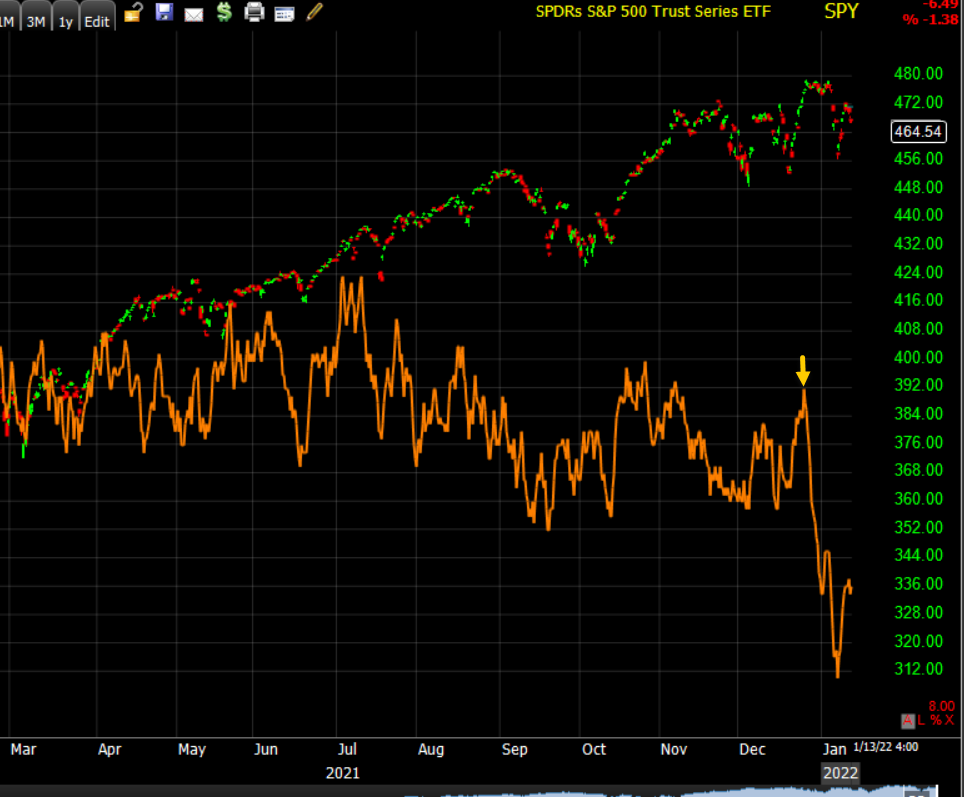 SPY (30m) went deeply leading negative at the start of the year (yellow arrow).
VIX gained +15.3% to close above its 50, 100 and 200-day sma’s
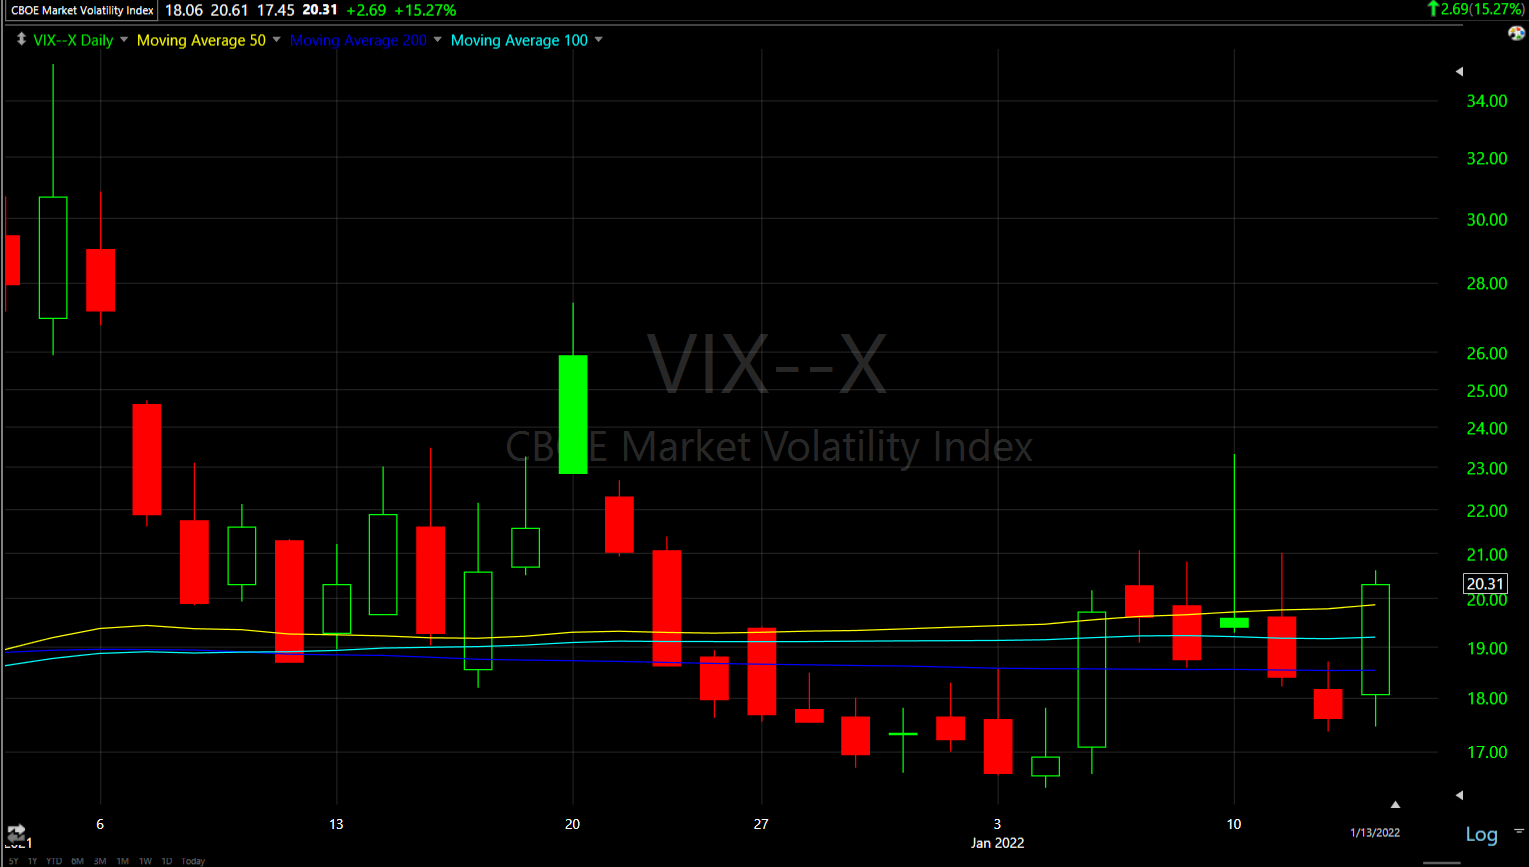 VIX (daily)
More importantly, the Absolute Breadth Index posted that sub-14 print with a low today of 13.95, triggering a long volatility signal with typical expectations being that VIX gains on average 50% over the next month, but sometimes starts as soon as the same or very next day.
S&P sectors
8 of 11 sectors closed lower with growth and mega-cap heavy Technology and Consumer Discretionary, and the second most heavily weighted Health Care sector were worst. The defensive bond proxy sectors – Utilities and Consumer Staples, along with Industrials were the only sectors to close green.
Materials ⇩ -0.78 %
Energy ⇩ -0.51 %
Financials ⇩ -0.39 %
Industrial ⇧ 0.22 %
Technology ⇩ -2.59 %
Consumer Staples ⇧ 0.18 %
Utilities ⇧ 0.49 %
Health Care ⇩ -1.55 %
Consumer Discretionary ⇩ -2.01 %
Real Estate ⇩ -0.35 %
Communications ⇩ -1.04 %
Some travel related names outperformed (JETS ETF +2.2%), which was in large part due to Delta Air Lines (DAL +2.1%) beating EPS estimates, and Boeing (BA +3%) rallied as Bloomberg News reported the 737 Max is set to resume commercial flights in China as soon as this month. Cruise lines also gained from +1.5 to 4%, however the Resorts and Casinos sub-group ended lower by -1%.
Similar to the NASDAQ Composite, the Tech sector bounced off its 200-day amid oversold conditions Monday morning, but met resistance at its 100-day yesterday.
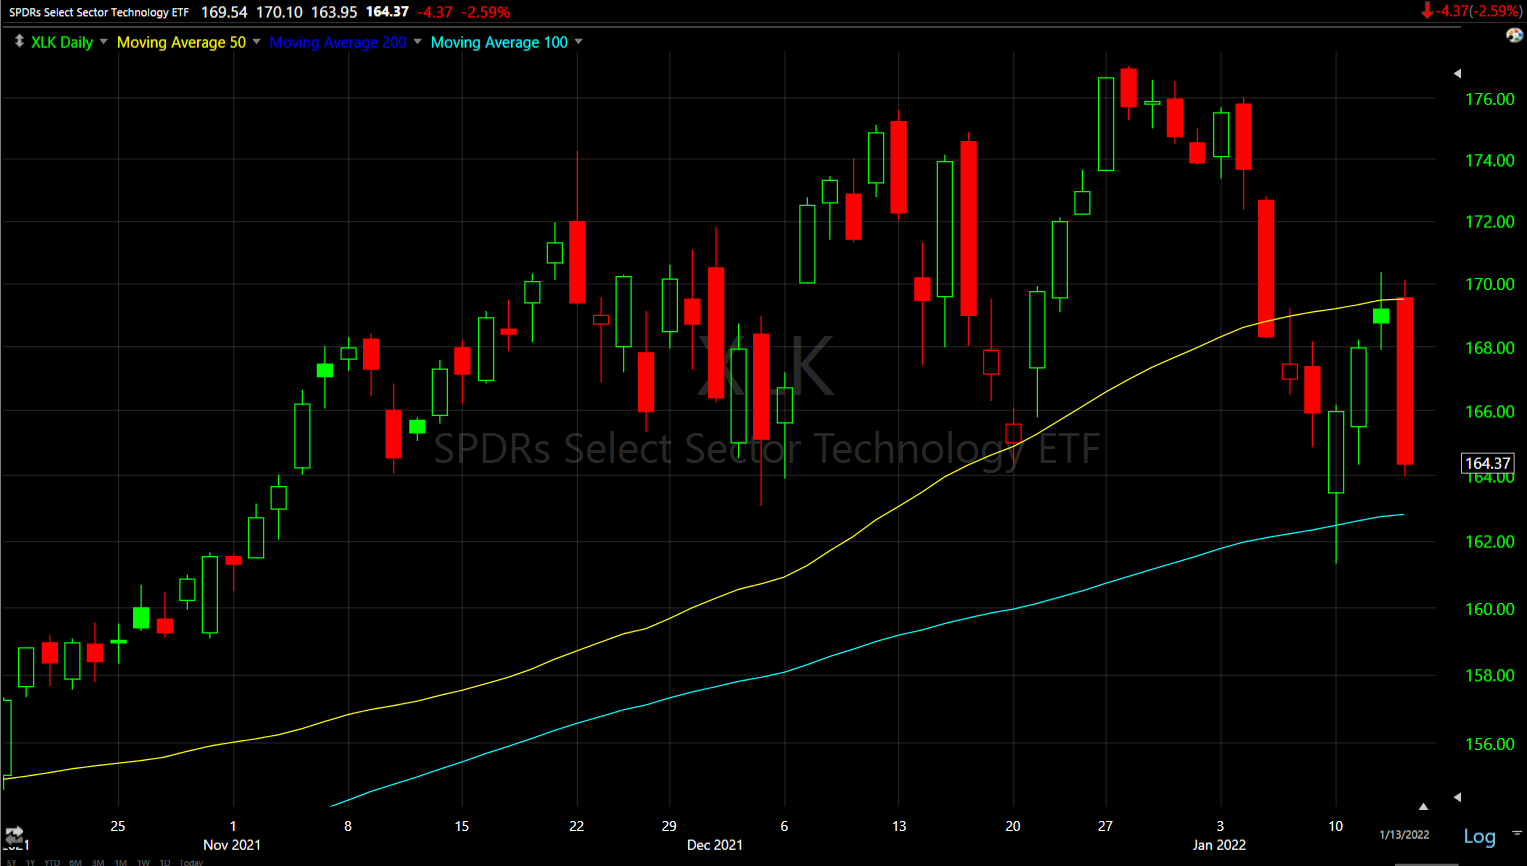 Technology sector (daily) finding resistance at its 50-day after a loss of momentum star candlestick there yesterday.
Semiconductors (SOX -2.3%) were relatively weak despite Taiwan Semi ( TSM +5.3%) beating EPS and guiding higher as semis followed the growth stocks and Tech sector lower.
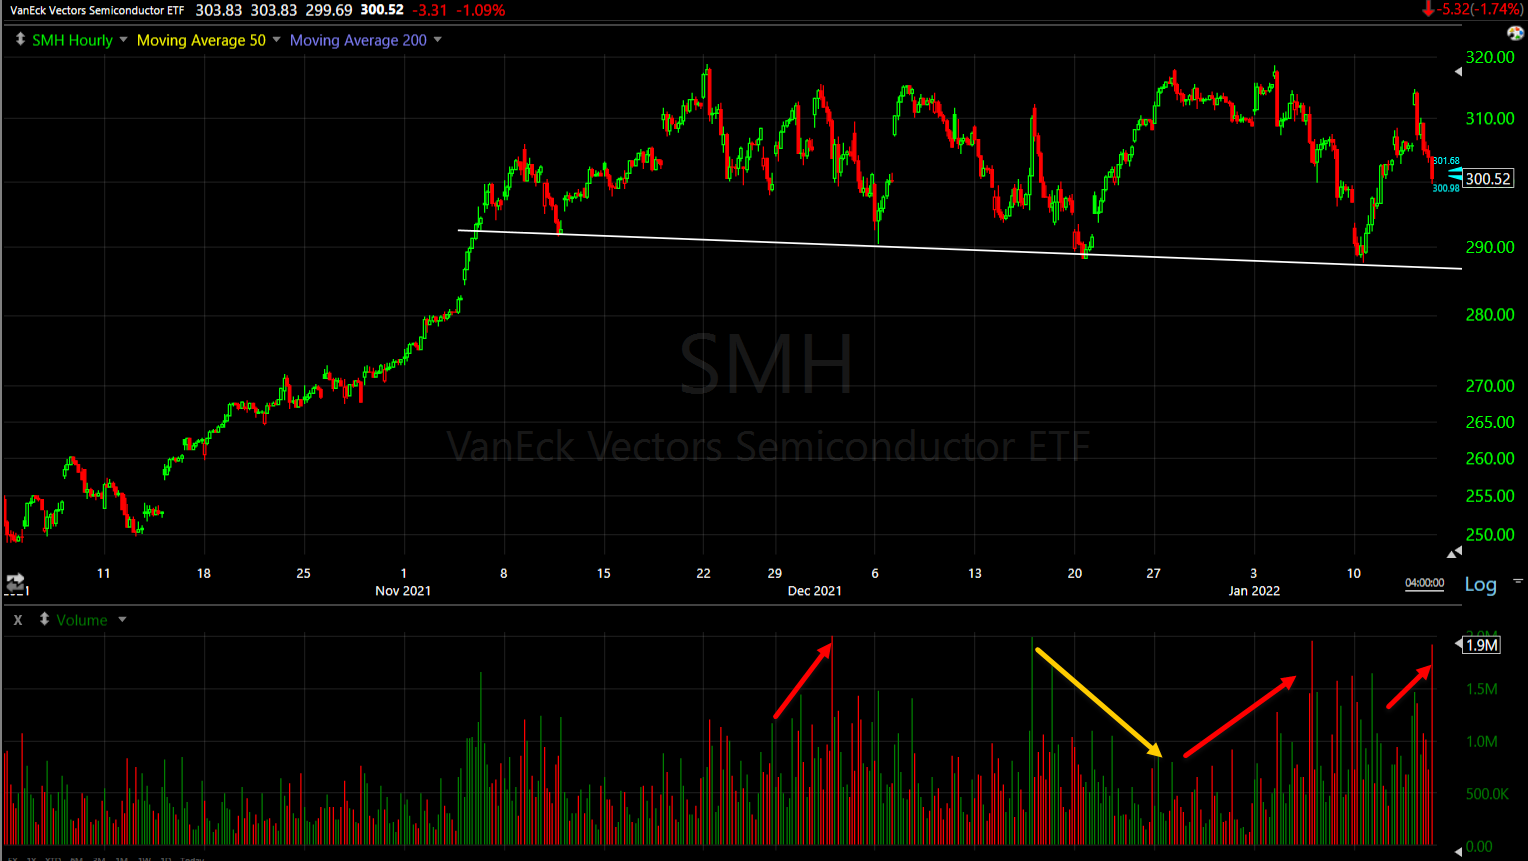 I’m using the SMH ETF here (daily) to show volume as this has the feel of a toppy pattern. Notice as it develops volume increases on the declines and volume decreases on the advance (an important way to confirm the validity of a H&S top).
Internals
As weak as the averages were, NYSE internals were not that bad with Decliners (1741) only having a narrow edge over Advancers (1529) on lighter Volume of 841 mln. shares, however NASDAQ Decliners (2923) outpaced Advancers (1439) by a 2-to-1 margin, apparent in the NASDAQ’s advance/decline line posted in the Early Update -Stocks Struggling to Gain Traction.
There was no Dominant price/volume relationship and therefore no 1-day oversold condition.
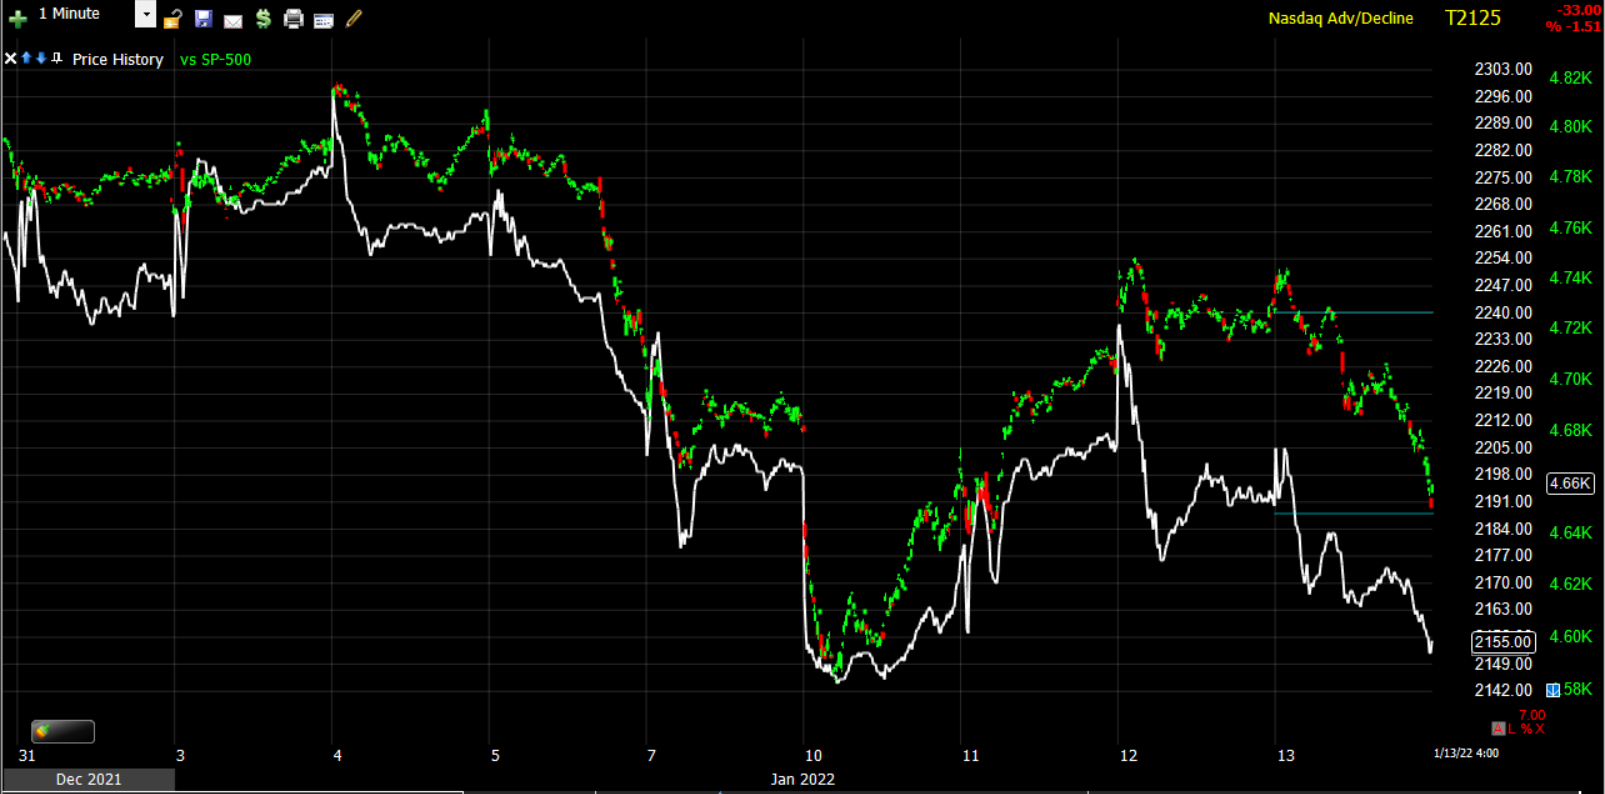 SP-500 (1m) and NASDAQ Composite’s A/D line weakening more this morning.
NYSE 52 week new lows ticked up today, but that’s not unusual for a day the averages are down.
Treasuries
The 2-year yield was unchanged at 0.89%. The 10-year yield declined by one basis point to 1.71%
The Treasury yield curve is lower for the year. Considering the FOMC hawkish minutes came out just last week and gave investors a peak into how much more hawkish the Fed is than what Powell let on, the yield curve is once again fretting that the Fed is going to make a policy error, potentially throwing the economy into a recession in trying to deal with inflation. I have no doubt the Fed would much rather accept a recession than inflation spiralling out of control, but as they withdraw the liquidity that has sent stocks soaring to record valuations in the wake of COVID, they helped foster the inflationary spiral we’ve experienced.
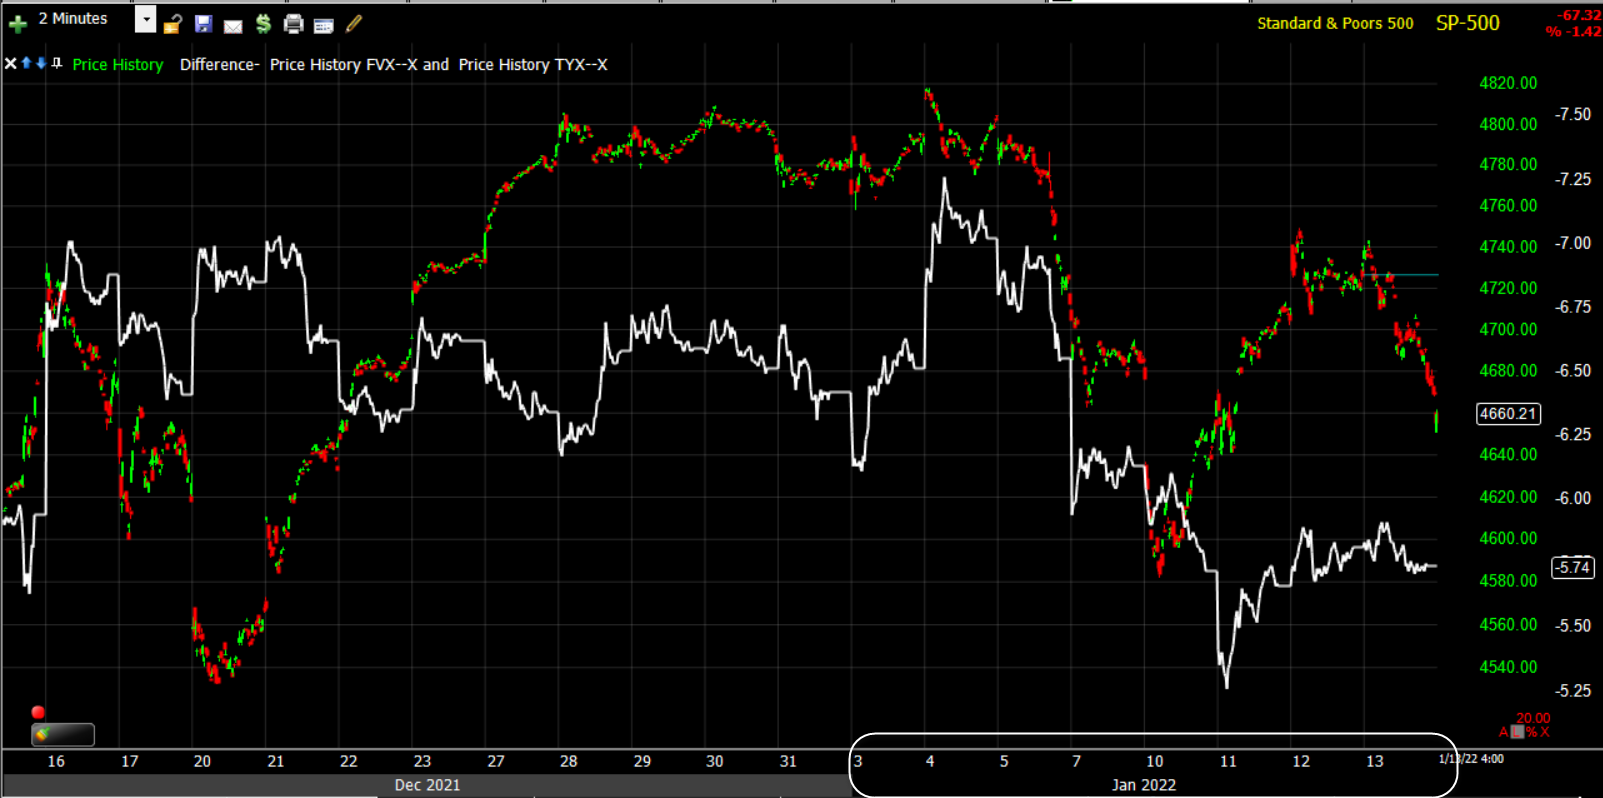 SP-500 (2m) and the 5s-30s yield curve flatter for the year.
We can already see 30-year mortgage rates soaring in anticipation of the Fed’s tightening…
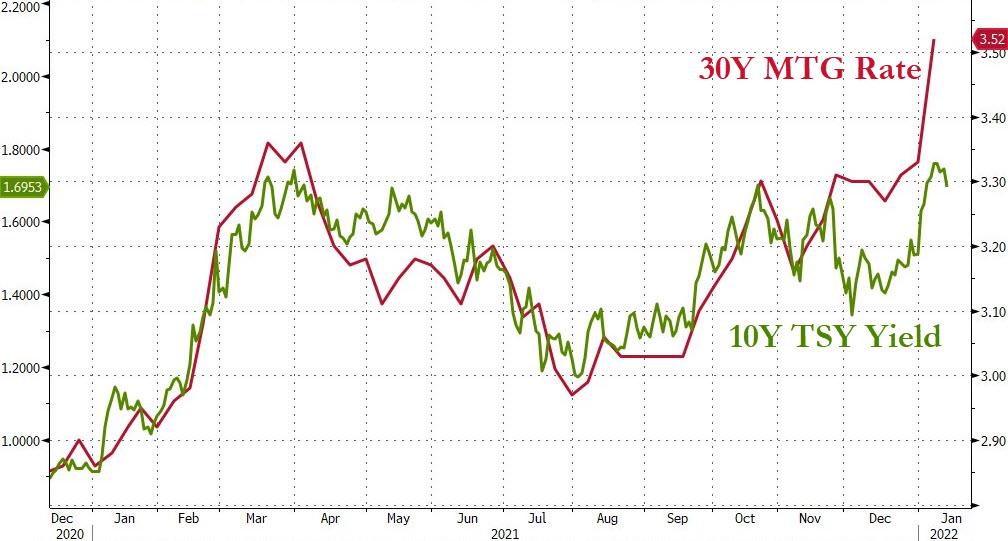
Source: Bloomberg
Currencies and Commodities
The U.S. Dollar Index decreased 0.1% to 94.87.
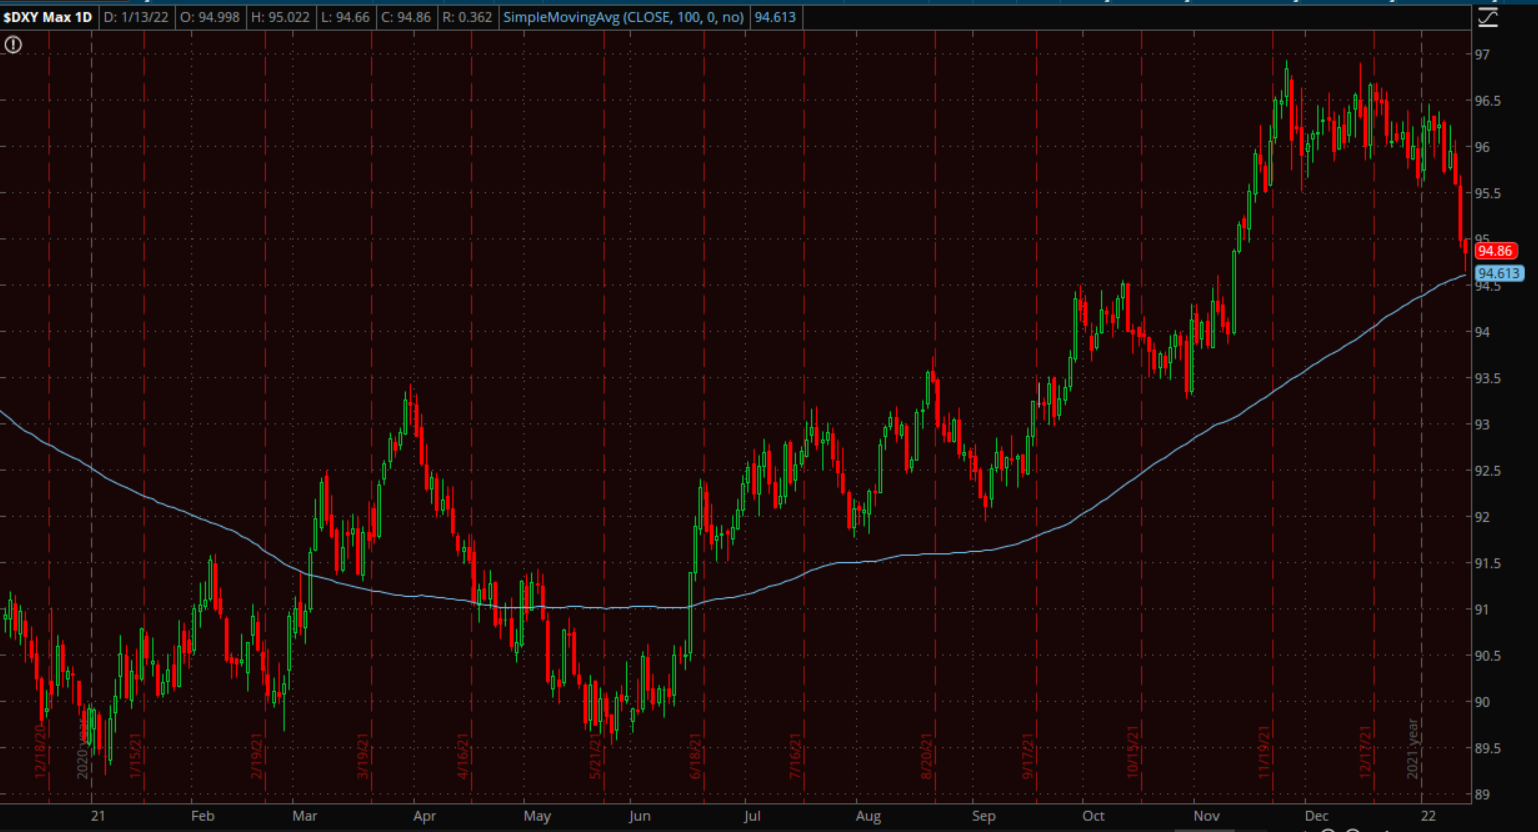 U.S. Dollar Index (daily) testing its 100-day sma.
WTI crude futures decreased 0.7% to $81.96/bbl today.
Gold futures settled lower for the first red day in the last five, falling -0.3% to $1,821.40/oz after coming within 2 points of the $1830 level where 3C has negatively diverged twice and sent prices lower recently. Yesterday Gold futures’ 3C chart showed the first crack since the rebound from below $1800 as price approached $1830.
 Gold futures (30m)
Bitcoin fell -2.9% as it has been acting more like stocks than the inflationary hedge it acted as in the Fall.
 BTC/USD (daily) w/ 200-day sma coming down from $44k.
Summary
While yields were well-behaved and don’t account for the selling in growth stocks, it’s very likely more hawkish Fed-speak was the catalyst.
Fed Governor Lael Brainard said officials could boost rates as early as March to ensure that generation-high price pressures are brought under control. Fed Bank of Philadelphia President Patrick Harker favors a March liftoff and three or four hikes for 2022. His Chicago counterpart Charles Evans — who sees a similar number of increases this year — said he couldn’t judge the likelihood of the first raise taking place in two months’ time. Richmond Fed President Thomas Barkin said officials will be in a position to start normalizing rates at their March meeting should circumstances support that. In other words, no matter how much Powell tries to soften the blow, the evidence of the FOMC minutes and numerous Fed officials shows that the Fed is about to embark on what could be a historic pace of monetary tightening via the balance sheet and rates, much sooner, faster and more aggressive than investors have seen in decades. Most investors have never seen anything like this.
In that context, perhaps it’s not so surprising that growth stocks were sold had today due to hawkish comments from Fed officials.
This is what I’ve been expecting for months and why I’ve said numerous times that 2022 is set to be much more volatile than 2021 and stocks are always the last to discount even the obvious. This too is of the Feds making as they have increasingly conditioned investors over the last 2 decades to expect the Fed to come to the rescue on any dip of more than 5%, by cutting rates or flooding the system with freshly printed dollars that inevitably make their way into assets. The Fed’s modus operandi has been to pull growth and consumption foreword by keeping interest rates so low that savers are actually punished and lose buying power. Don’t take my word for it, just look at the Fed funds rate since the 1980’s…
 Fed Funds rate has been on a steady downward trajectory since the 1980’s with two period of ZIRP (Zero Interest Rate Policy) highlighted in green. Consumers have zero incentive to save, but rather to finance as much debt as they can at low interest rates which pulls consumption (or growth) forward from the future. You already have 3 big screen T.V.s? Why not by a fourth at low interest rates? That’s pulling growth froward from the futures. You’re not going to get any reasonable interest in a savings account, you’ll actually lose buying power, thus TINA (there is no alternative) thanks to the Fed.
Or look at the trajectory of their balance sheet…
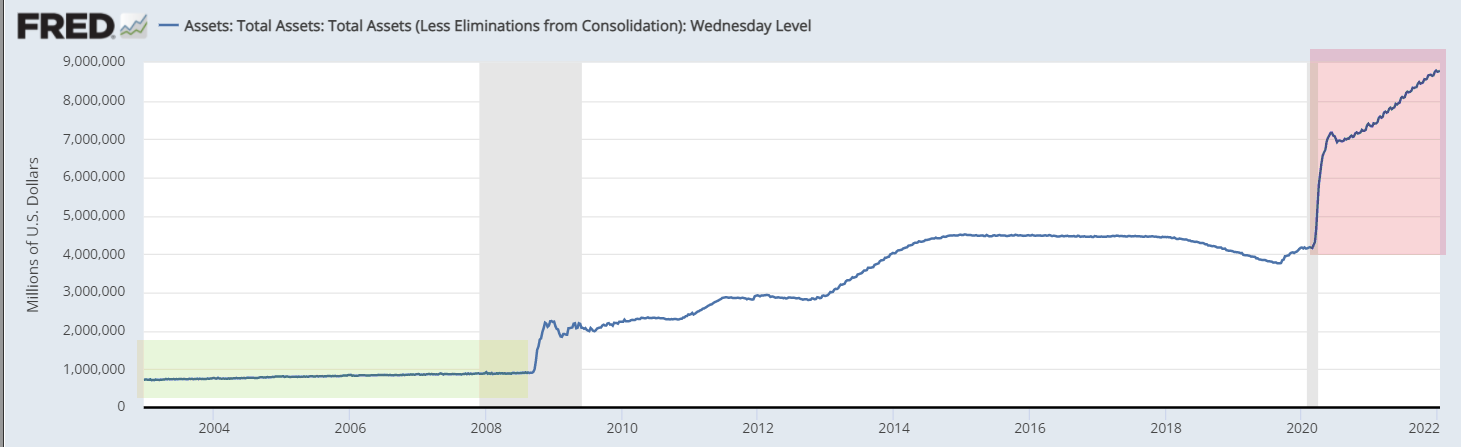
Before the Financial crisis (highlighted in green) the Fed’s balance sheet ran around $750-$850 billion. Since then it has steadily risen. Because the Fed is prohibited by law from financing the government’s debt, they simply buy assets in the secondary market from banks with freshly printed money out of thin air. What do you think the banks do with this money? They buy anything that yields more than a treasury – like stocks. And after COVID, the Fed’s policy easing got even more obscene… slamming the Fed funds rate down to zero and expanding the balance sheet from $4.2 trillion in March of 2020 to $8.8 trillion in December of 2021.
Decades of this obscene interference in markets has conditioned investors to throw all caution to the wind and buy the dip because there is no alternative, is suddenly set to come to a crashing halt this year. There are few investors alive that have experienced a market that hasn’t been artificially propped up by the Fed. Not only is that artificial suport about to end, but the Fed is set to actually drain money from the system as their balance sheet shrinks and rates rise all because inflation, which they haven’t even been able to sustain at their target of 2% for decades, is becoming entrenched…not transitory as Powell has insisted.
It seems Fed chairpersons almost always have embarrassing, wrong-footed famous last words that show just how absurd and arrogant they are…
Fed chair Ben Bernanke:
- “The U.S. government has a technology, called a printing press (or today, its electronic equivalent), that allows it to produce as many U.S. dollars as it wishes at no cost.” – November 2002
- “We’ve never had a decline in house prices on a nationwide basis. So, what I think what is more likely is that house prices will slow, maybe stabilize, might slow consumption spending a bit. I don’t think it’s gonna drive the economy too far from its full employment path, though.“ – July 2005. Just a couple years before a near depression caused by the Financial Crisis, sparked by some of the most obscene and questionable speculation in sub-prime Real Estate and derivatives ever known.
- “With respect to their safety, derivatives, for the most part, are traded among very sophisticated financial institutions and individuals who have considerable incentive to understand them and to use them properly.” November 2005 (see above).
- “Housing markets are cooling a bit. Our expectation is that the decline in activity or the slowing in activity will be moderate, that house prices will probably continue to rise.”- February 2006
- “…we do not expect significant spillovers from the subprime market to the rest of the economy or to the financial system. – May 2007
- “The Federal Reserve is not currently forecasting a recession.” – January 2008
- “The risk that the economy has entered a substantial downturn appears to have diminished over the past month or so.“ – June 2009, 3 months before the Financial Crisis went from recession to narrowly avoiding a depression.
Janet Yellen:
- “I don’t think we’re about to lose control of inflation” -October 2021
Jerome Powell’s legacy may indeed be his inability to imagine inflation as anything other than a brief transitory blip.
“We tend to use transitory to mean that it won’t leave a permanent mark in the form of higher inflation,” – December 2021
We’re about to enter a stage of Fed policy that few investors or Fed officials alive today have had any direct experience with. It’s little wonder the bond market is screaming, “Policy error”. Suffice it to say, I think 2022 and perhaps beyond, is going to be very volatile, very interesting and catch a lot of investors wrong-footed, but in volatility we find unique opportunities.
Overnight
S&P futures are +0.1% and consolidating the day’s losses.
 S&P futures (1m) – present price action has a clear bearish bias akin to a small bear flag.
3C is in line (confirming) VIX futures’ price action.
WTI Crude futures are down -0.4%. Gold futures are unchanged.
As mentioned yesterday, I’m watching Treasury futures very closely as a resumption in the rise in yields would put more pressure on stocks, especially growth/large-cap Tech and NASDAQ-100. Most 3C charts of treasury futures are unremarkable, but 1-year Treasury futures do have a 3C divergence.
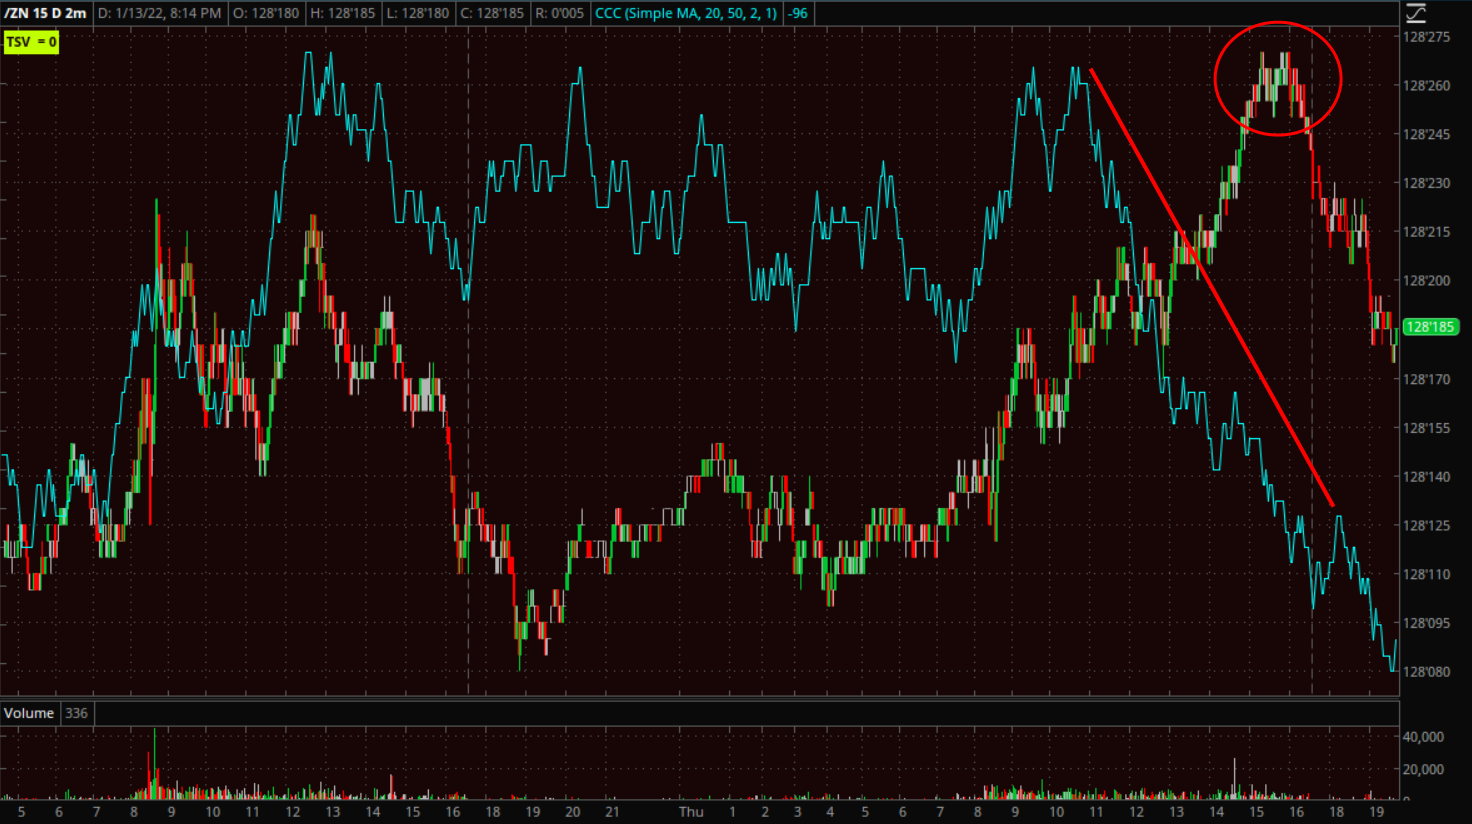 10-year Treasury futures (2m)
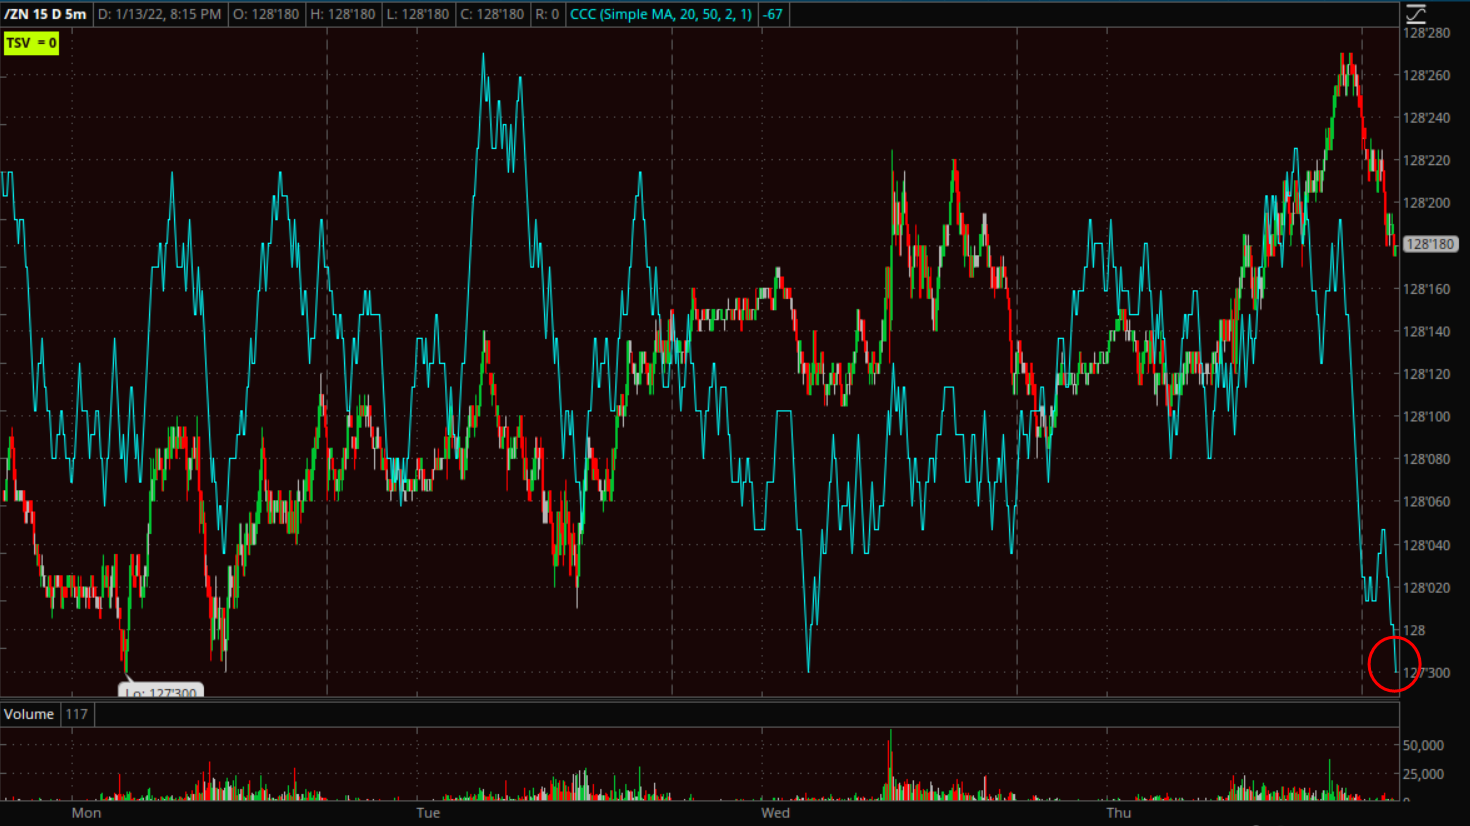 10-year Treasury futures (5m)
Looking ahead, investors will receive Retail Sales for December, the preliminary University of Michigan Index of Consumer Sentiment for January, Industrial Production and Capacity Utilization for December, and Import and Export Prices for December on Friday.
Here are some key events this week:
- Bank of Korea policy decision and briefing on Friday.
- Wells Fargo, Citigroup, JPMorgan due to report earnings on Friday.
- New York Fed President John Williams speaks Friday.