Stock Market Daily Wrap For August 2nd, 2021
August has a tendency to have a negative seasonal bias, but the first few days of any month tend to draw in new inflows to the equity market. The latter seemed to be the course futures were on this morning in pre-market, but treasury yields were already lower in pre-market after mixed economic reports from China and Europe, and as mentioned in the A.M. Update,
“It appears to me that yields could fall more by the posture of Treasury futures.”
That’s precisely what happened after the 10 a.m. ET ISM report.
The positive start could be attributed to several factors: new inflows on the first trading day of the month; the Senate finalized the text of the $1 trillion bipartisan infrastructure bill that could be voted on Thursday; Square (SQ +10.2%) announced a $29 billion, all-stock acquisition of Australian company Afterpay.
Small Caps and cyclicals led early on the the upside, in part due to a small short squeeze in the most shorted stocks.
 IWM (5m) and Most Shorted Index with a modest squeeze at the open (green) that faded. The MSI was largely responsible for Small Caps’ early strength off the July 19th low, but the index has been dropping lower for over a week.
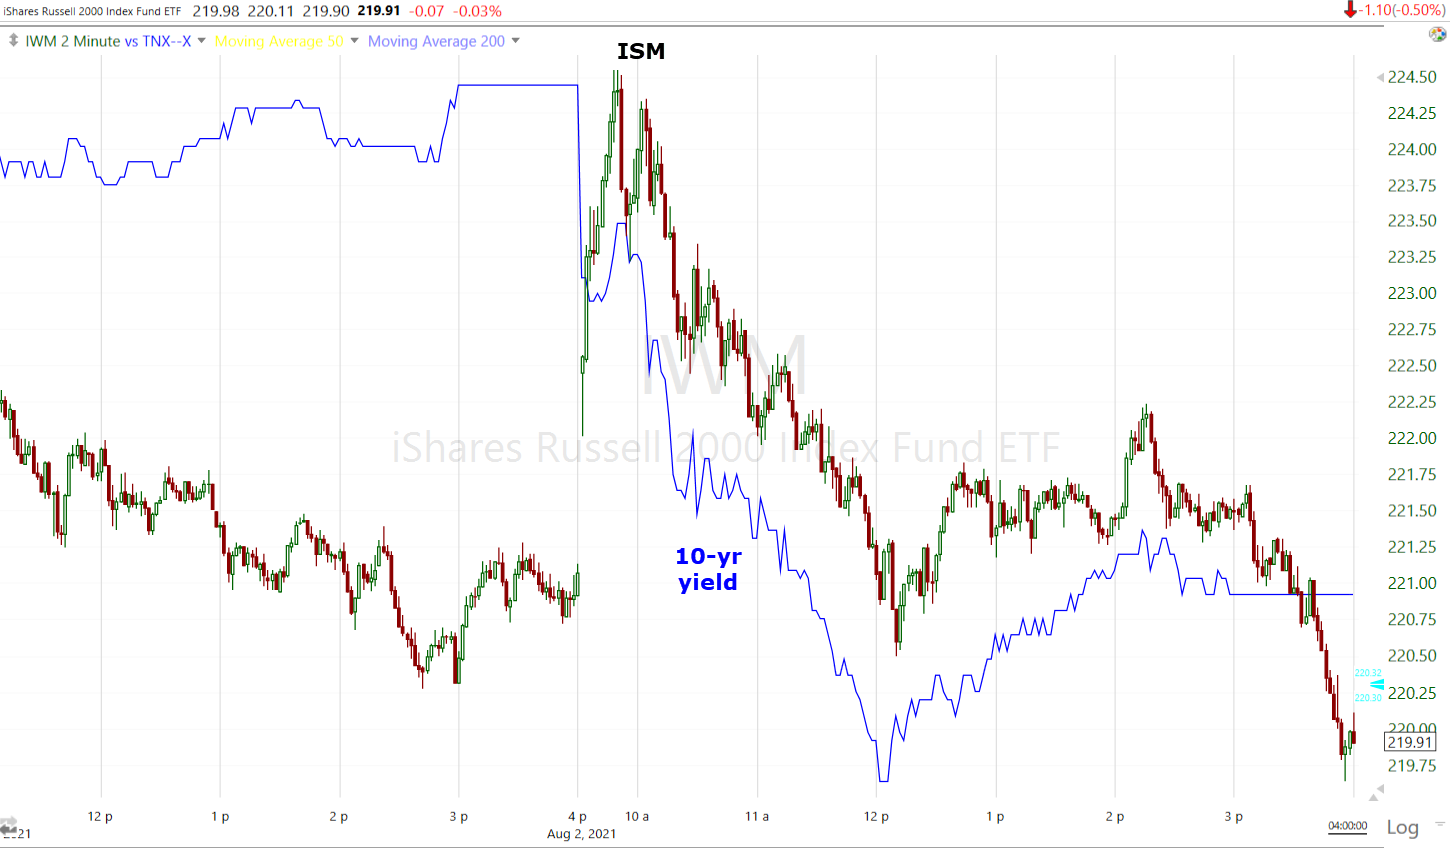
At 10 a.m. the July ISM Manufacturing Index marked the 14th straight month of expansion for the sector, but the index missed expectations and decelerated to 59.5% (consensus 60.7%) from 60.6% in June, and fell to the lowest of 2021, reinforcing peak economic growth. The Prices Index of the report decreased to 85.7% from 92.1% while the construction spending report for June also missed expectations.
Yields immediately tumbled, cyclical sectors lost early leadership and Small Caps turned down.
As mentioned at the end of the Early Update,
“With yields falling after economic reports, it’s a more supportive environment for secular growth stocks (i.e. the mega-cap Tech stocks). I would expect cyclicals and Small Caps (which are benefitting from a moderate short squeeze this morning) to start to underperform. “
That was initially the case…
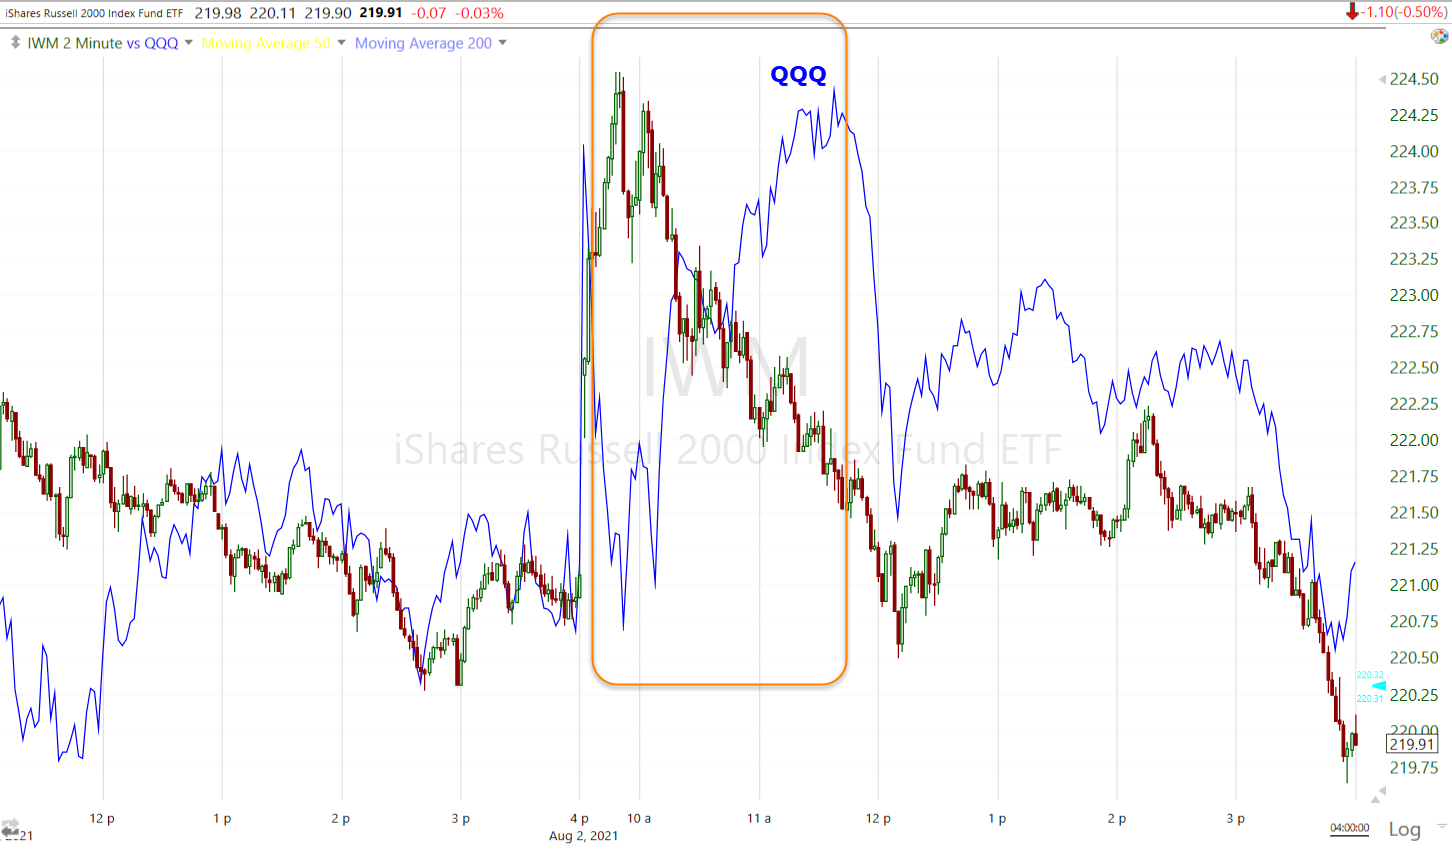 IWM (2m) and QQQ. Small Caps came down after ISM, while NASDAQ/QQQ saw rotation and gained, but soon even the NASDAQ ran out of upside and turned down to close near session lows. It’s not very surprising given that the mega-cap Tech stocks didn’t do anything to pull their weight after weaker than expected guidance from many of the mega-caps’ earnings last week.
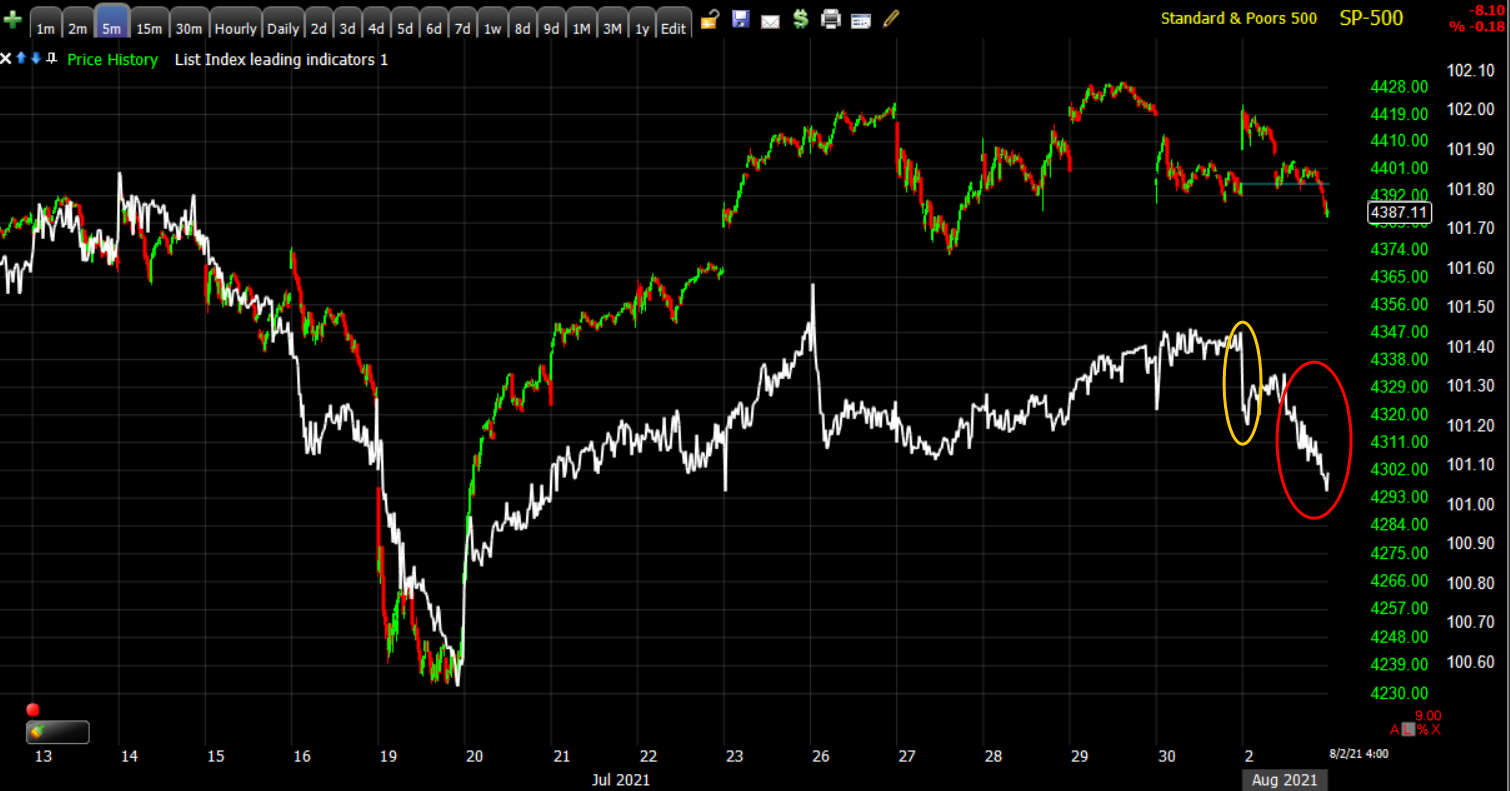
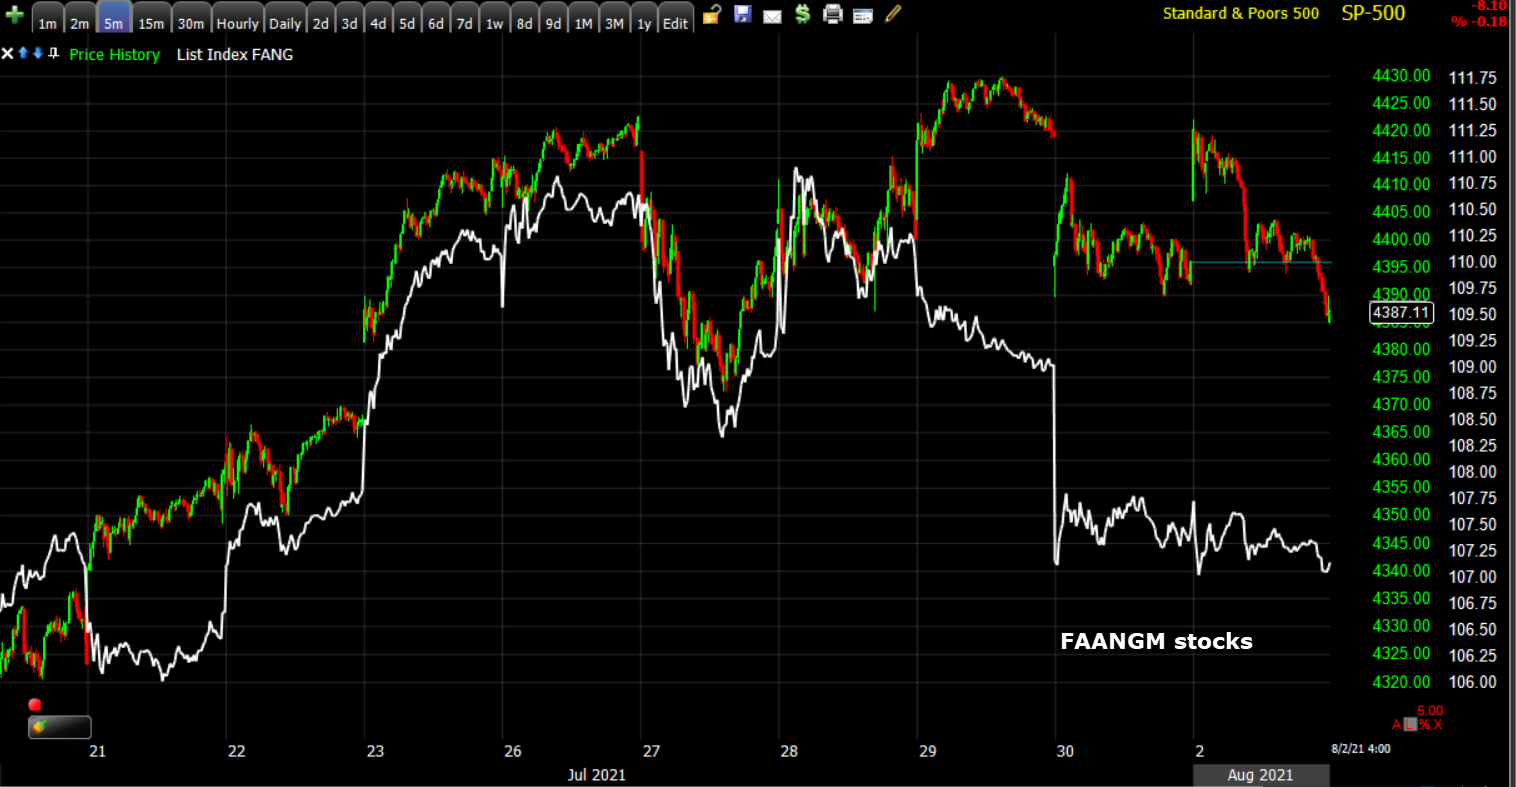 SP-500 (5m) and mega-cap index (white).
The Fed’s Waller further spooked the market in the last hour sending the averages to session lows:
“I think you could be ready to do an announcement by September,” Waller said Monday in an interview on CNBC.
“That depends on what the next two jobs reports do. If they come in as strong as the last one, then I think you have made the progress you need. If they don’t, then I think you are probably going to have to push things back a couple of months.”
“If the jobs reports come in as I think they’re going to in the next two reports, then in my view with tapering we should go early and go fast, in order to make sure we’re in position to raise rates in 2022 if we have to. I’m not saying we would.”
Averages
The more cyclically biased Small Caps ended -0.5% lower after an early lead of +1.4%. The large-cap indices were up +0.6% to +0.7% in early action, but also ended red.
S&P 500 ⇩ -0.18 %
NASDAQ ⇧ 0.02 %
DOW JONES ⇩ -0.28 %
RUSSELL 2000 ⇩ -0.48 %
I highlighted the 300 point range over the last 7 days around the Dow’s $35k area, which was resistance the second week of July. The Dow slipped under that range toward the close.
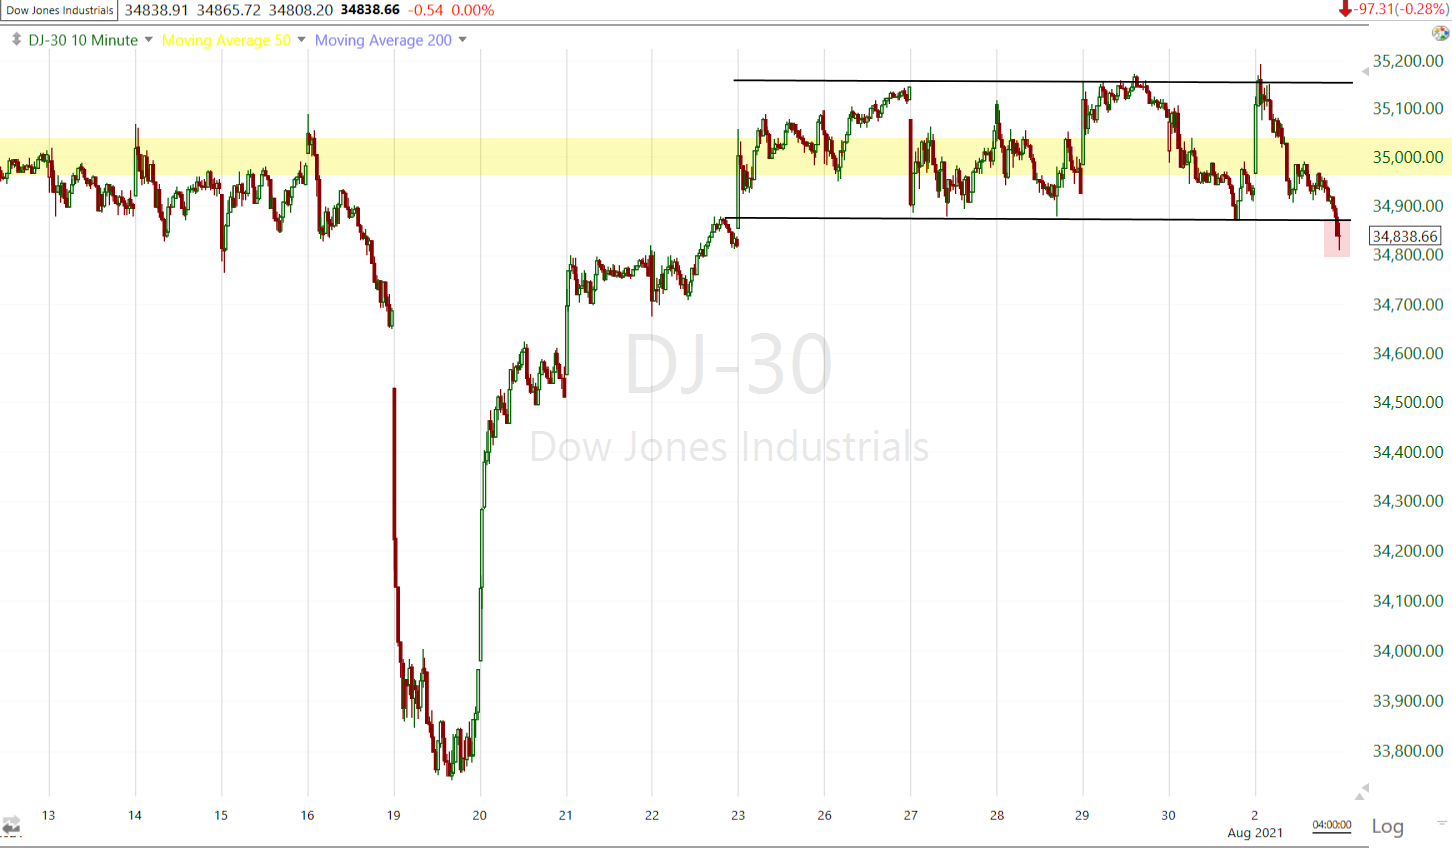 Dow (10m)
3C has been increasingly displaying resistance around the Dow’s range area.
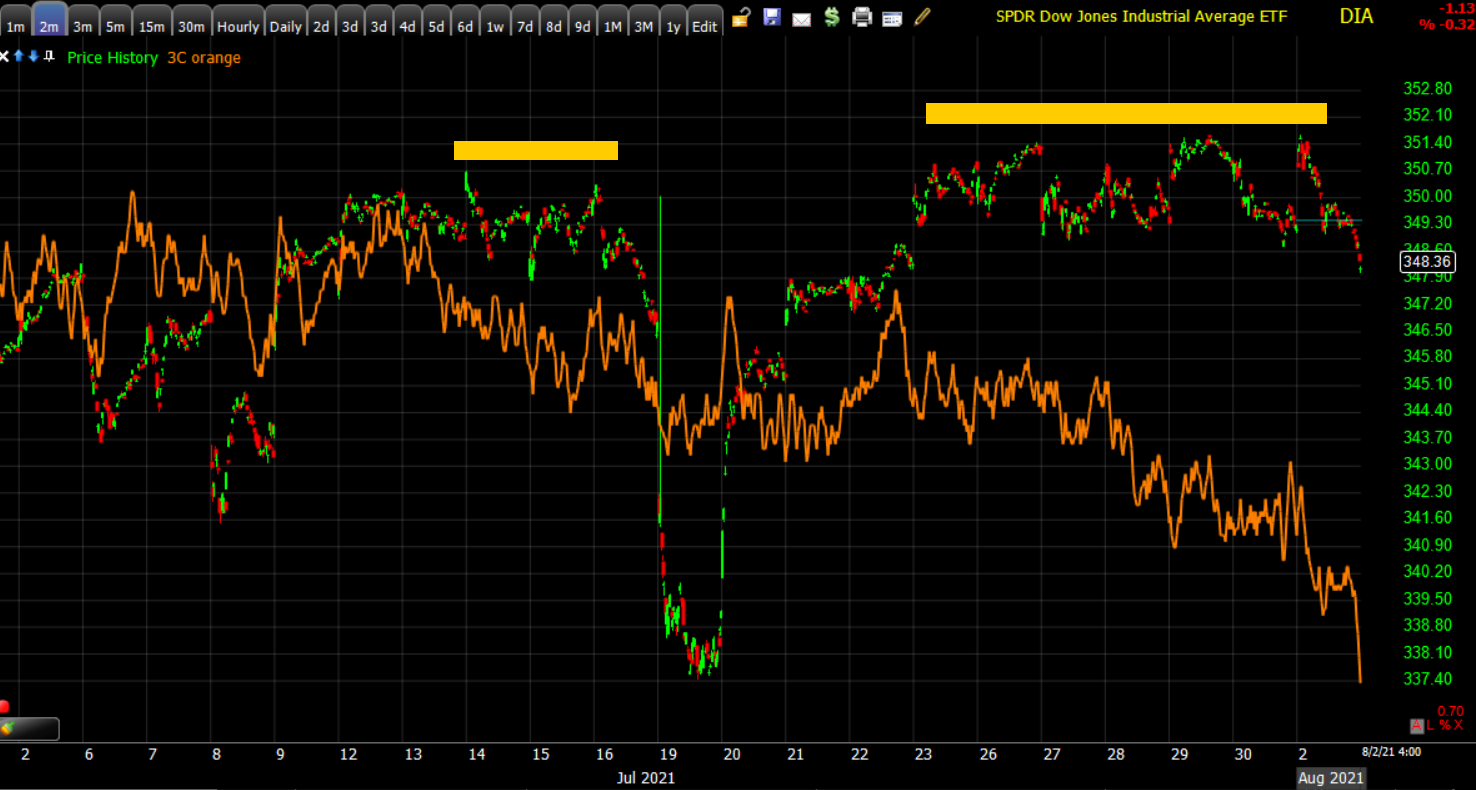 DIA (2m) with resistance as per 3C around the $35k area. Note the deep dive today leading prices lower.
Dow Transports (-0.6%) underperformed Dow Industrials.
![]() Dow Transports (60m) the price trend suggests the probability Transports make another lower low in the series of lower highs/lower lows since breaking down from a descending triangle. Which means, Transports continue leading the Dow lower…
Dow Transports (60m) the price trend suggests the probability Transports make another lower low in the series of lower highs/lower lows since breaking down from a descending triangle. Which means, Transports continue leading the Dow lower…
![]() Dow Industrials (60m) vs. Dow Transports.
Dow Industrials (60m) vs. Dow Transports.
I also highlighted a similar range in the S&P this afternoon, which it closed below.
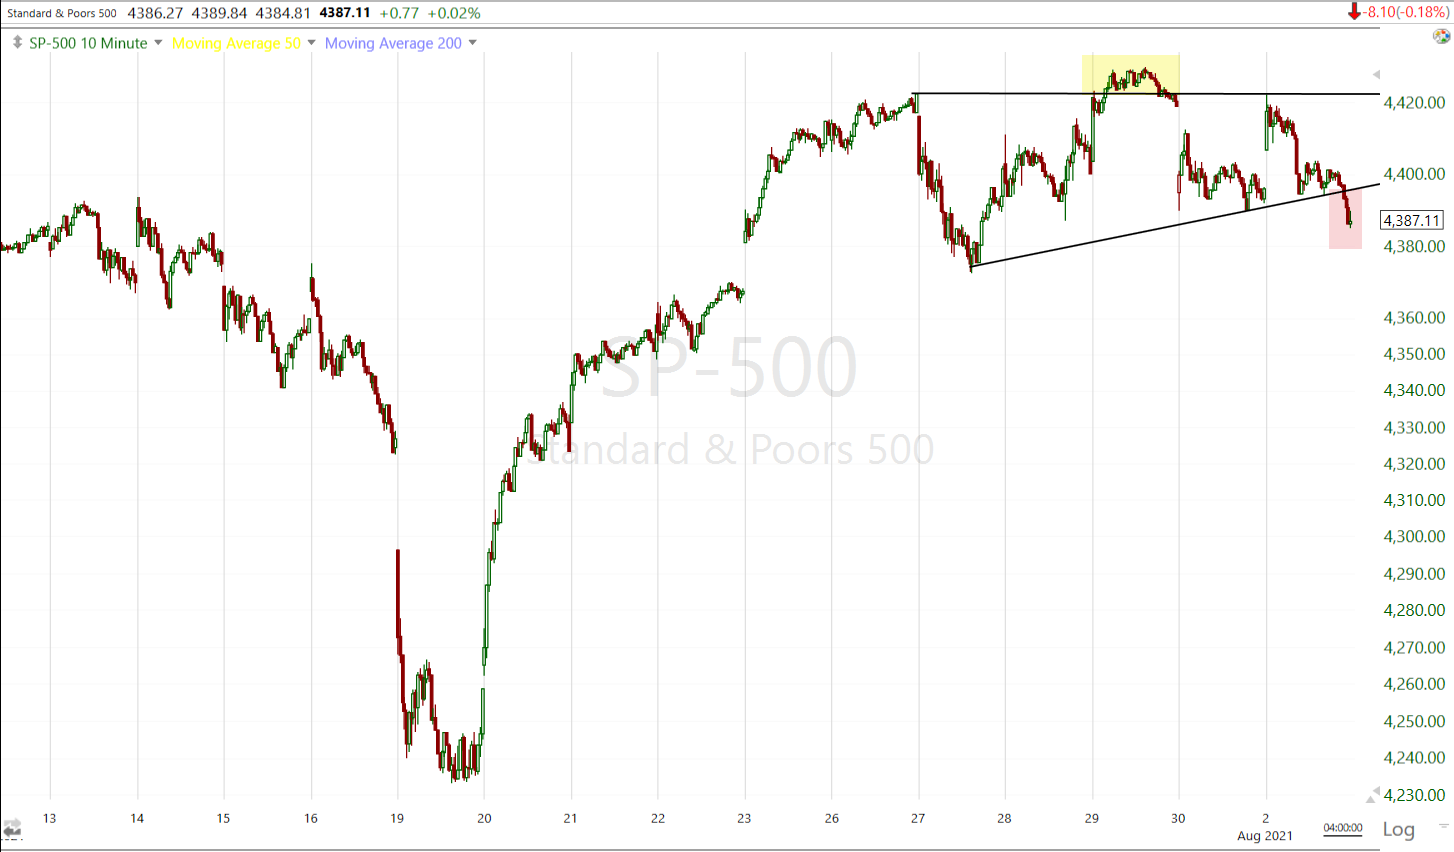 SP-500 (10m) technical and oversold rebound off the July 19th lows. The price pattern here (bullish ascending triangle) was more constructive than the Dow’s, but the price action raises the specter of a failed breakout (yellow) and fast downside reversal in the works.
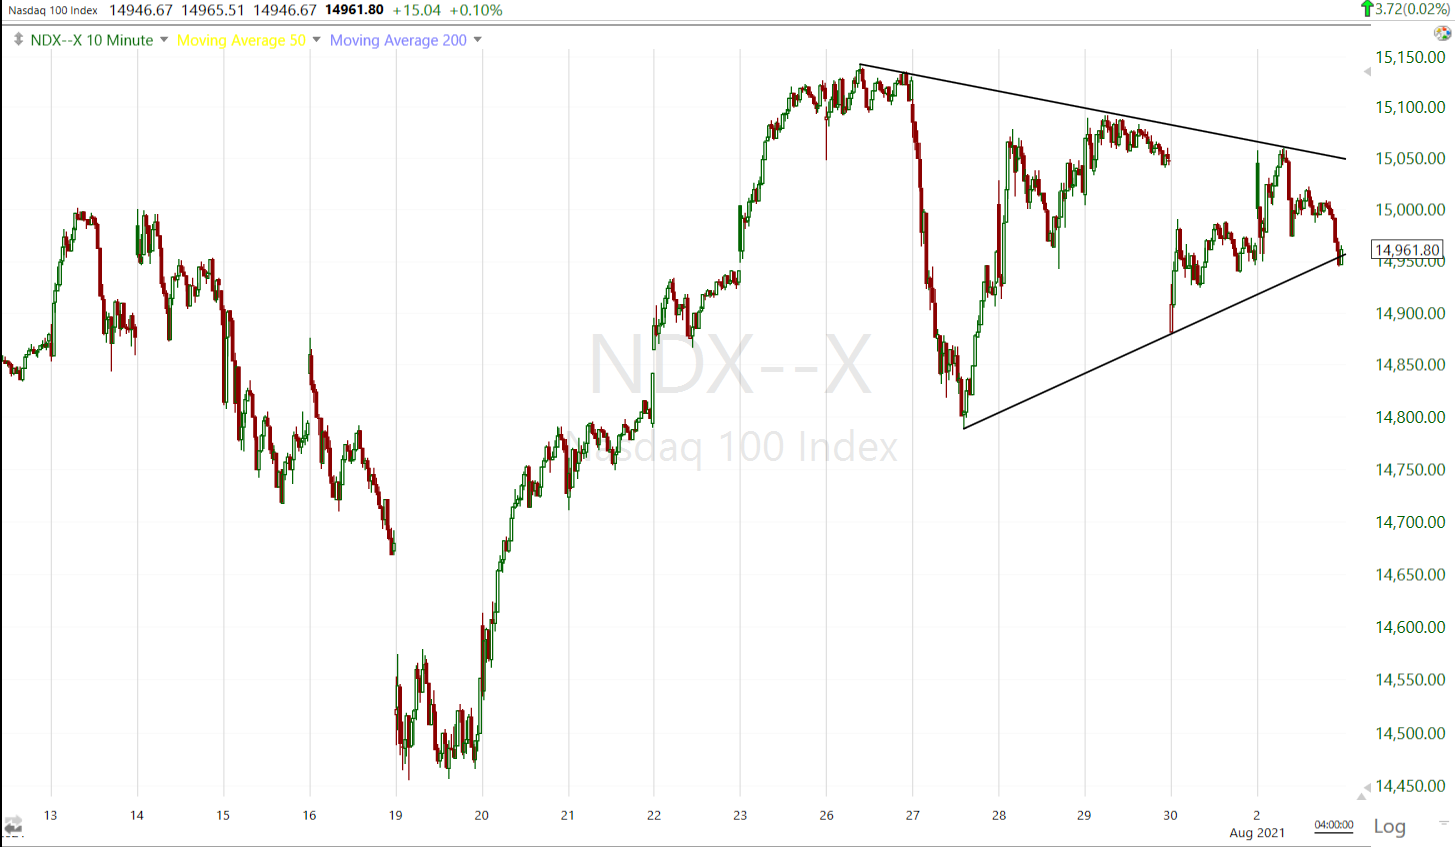 NASDAQ-100 (10m) had been trading in a consolidation triangle. I’m not aware of a name for this kind of triangle, but when the first swing in the triangle is so sharp to the downside, they tend to have a negative resolution, even though a sym. triangle after an advance is considered a bullishly biased consolidation. NASDAQ closed just inside the triangle.
 Small Cap IWM (daily) made yet another attempt (3rd in last 3 days) to tag its 50-day sma (yellow) from below, and failed yet again. The year-to-date price action here is more bearish and suggests to me that there is at least some earlier recognition of peak economic growth early in Q2. Small Caps are still up 12% year-to-date, but have gone nowhere since early February.
IWM’s 3C chart was one of the weakest before and almost immediately after the rebound from July 19th lows.
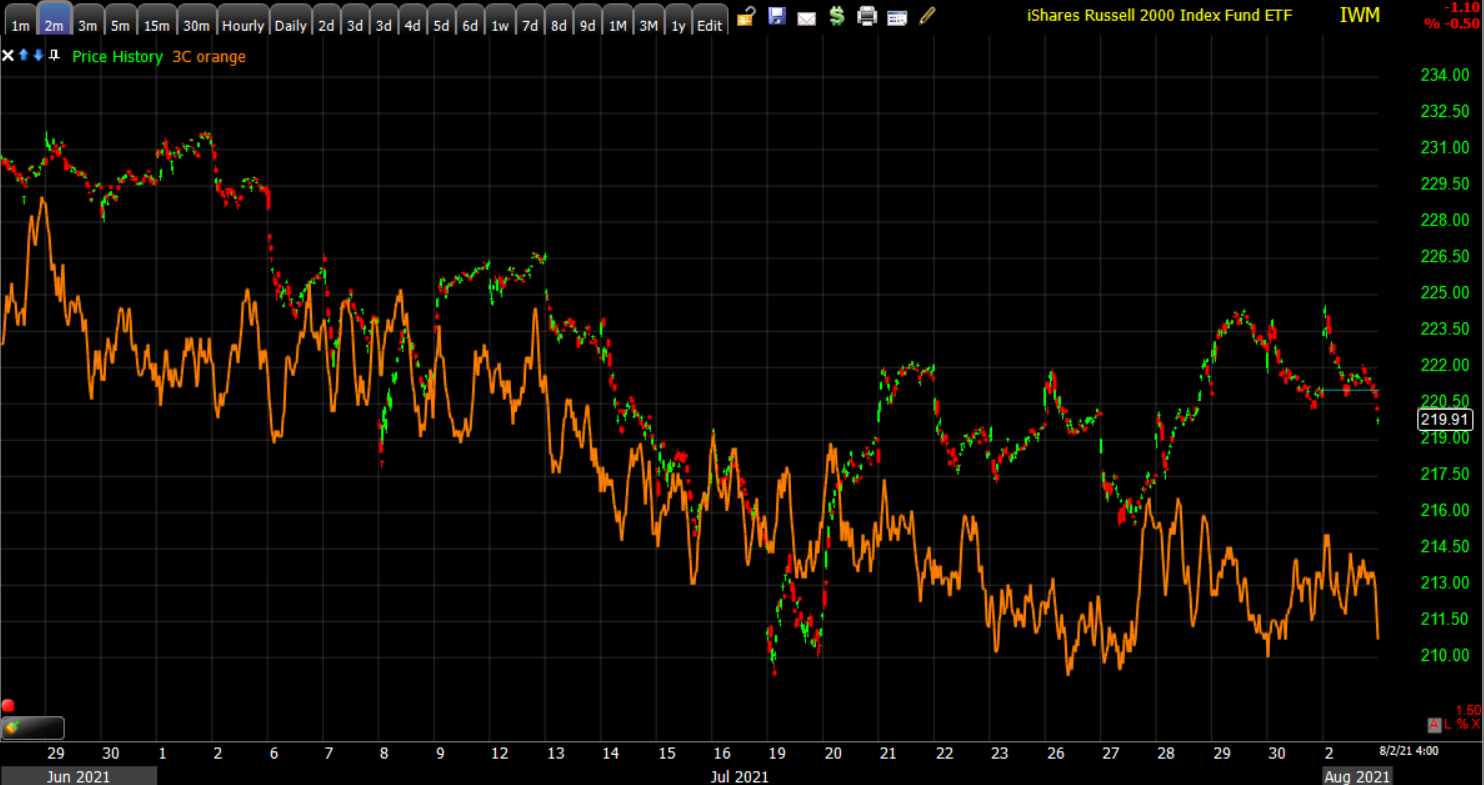 IWM (2m)
Volatility (VIX +6.7%) was displaying relative strength right out of the gate, demonstrated in the Early Update, whether that be the trend of relative strength in VIX and VVIX, Volatility’ term structure moving deeper into backwardation, or perhaps most significantly the SPX/VIX 30-day correlation going positive today.
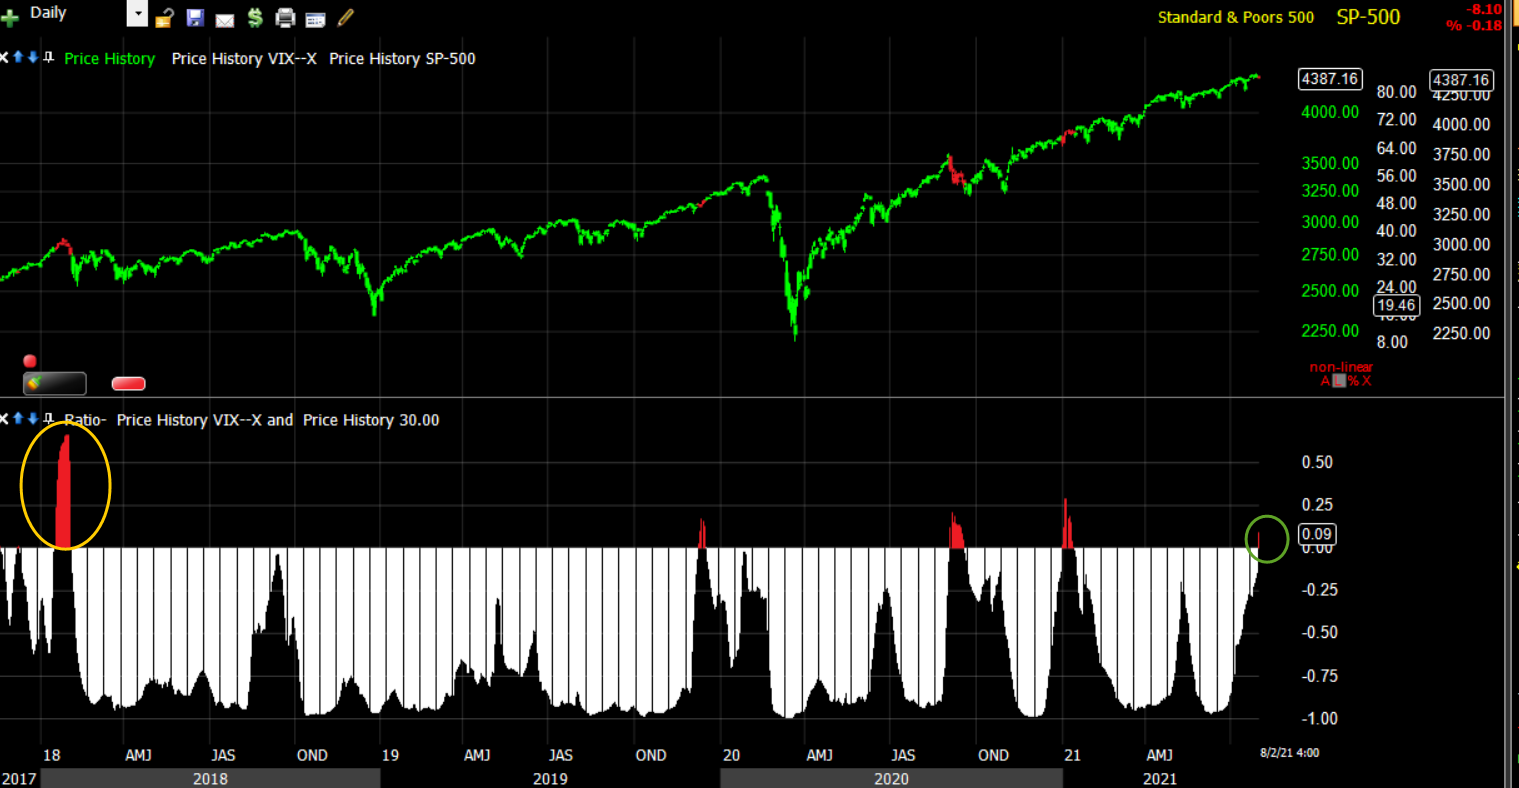 SPX/VIX (daily) 30-day correlation going positive today (green) at 0.09
“The higher or longer the correlation moves, the more significant the warning. It’s at +0.09 right now. Readings above 40 have correlated with major market sell-offs including the 1987 crash, the top of the Dot.Com bubble, the Financial Crisis and just before the January 2018 sell-off.”
The 30-day correlation is not as good at predicting minor market corrections of 2-5% as the 10-day correlation, but it can signal much stronger market declines as it rises to or above 0.40. A +0.40 correlation was last seen just before the January 2018 market sell-off (yellow). Others were seen before the Financial Crisis, the Dot-com bubble top and the 1987 crash.
One other note on volatility, the Absolute Breadth Index traded down to 19 today from 34 on July 20th. Extreme low prints (below 15) tend to see VIX make a double digit percentage gain anywhere from the next day to the next month.
S&P sectors
All 11 S&P sectors started the day green, but only 5 ended green. Cyclical sectors played an early leadership role, but that soon fell apart after the U.S. economic data at 10 a.m. and cyclical sectors ended as some of the worst performing on the day. Defensive/bond proxy sector, Utilities, was the only sector to standout by the close with notable relative strength as bonds jumped.
Materials ⇩ -1.21 %
Energy ⇩ -0.75 %
Financials ⇧ 0.03 %
Industrial ⇩ -0.69 %
Technology ⇩ -0.36 %
Consumer Staples ⇩ -0.42 %
Utilities ⇧ 0.77 %
Health Care ⇧ 0.14 %
Consumer Discretionary ⇧ 0.29 %
Real Estate ⇧ 0.04 %
Communications ⇩ -0.23 %
The Philadelphia Semiconductor Index (+0.6%) was a pocket of relative strength, as components keyed off ON Semiconductor’s (ON+11.7%) better-than-expected earnings report and upside Q3 guidance.
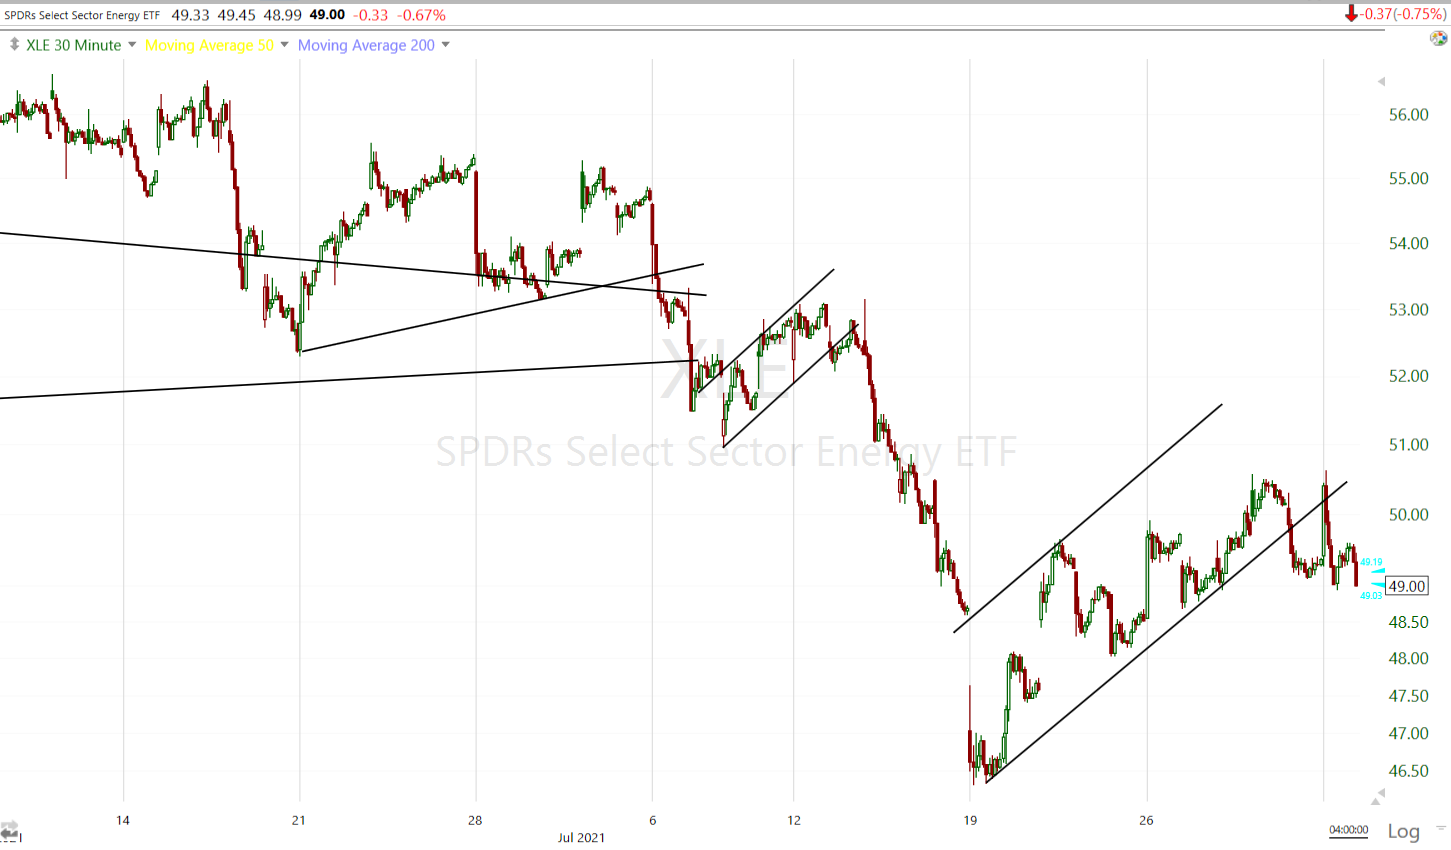 Energy sector (30m) has rebounded with the market off the July 19 lows, but has done so in a bearish flag. After briefly back-testing the flag this morning, it looks like it’s breaking down for a second leg lower. The flag suggests another 10% of downside on a second leg lower.
The Banks (KBW index -0.55% and Regional Banks -0.96%) underperformed the Financial sector.
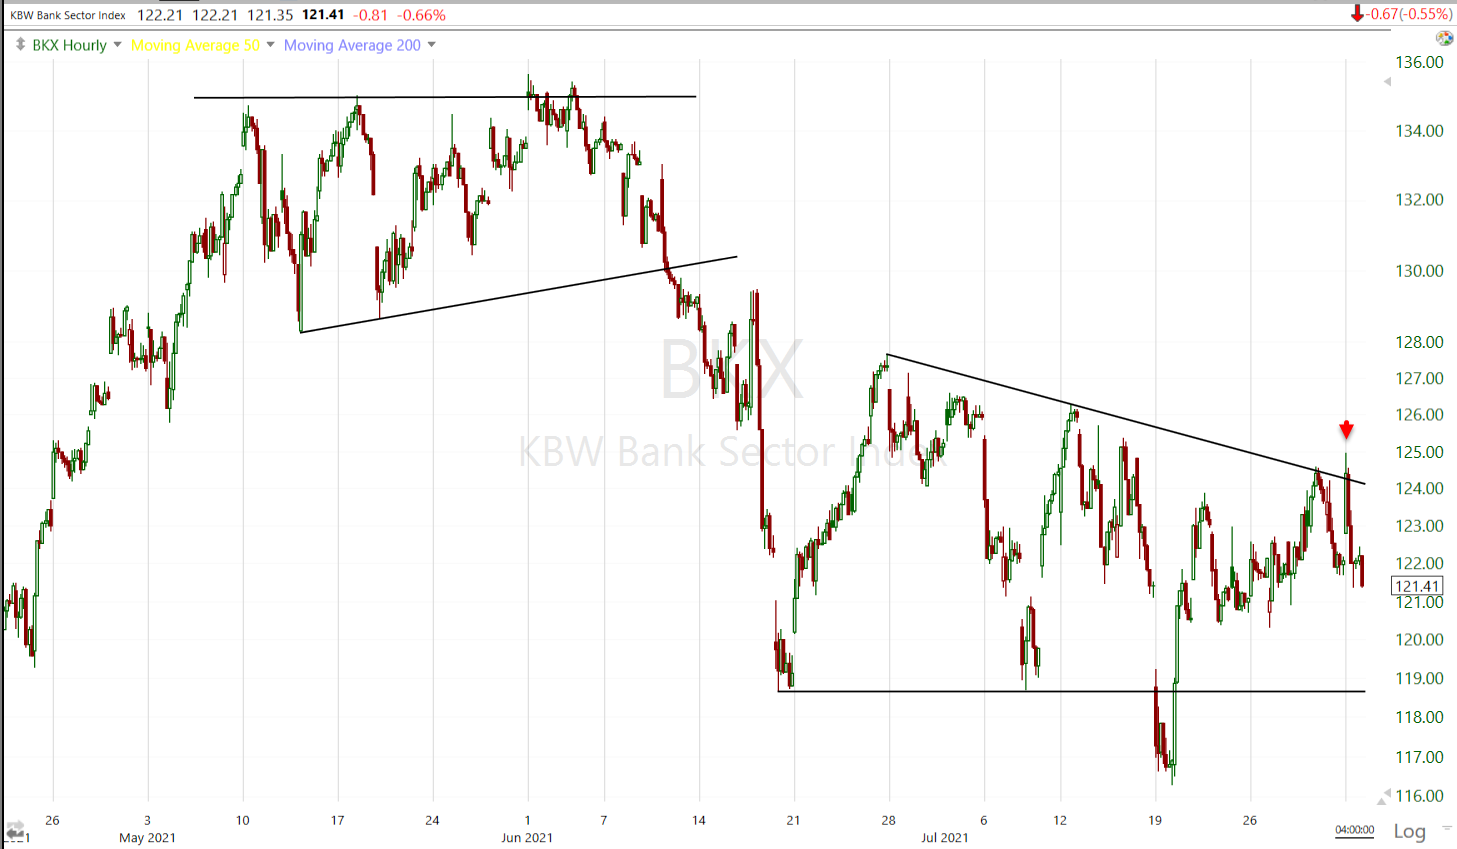 KBW Bank Index (60m) briefly tested above the bearish descending triangle consolidation (potential failed breakout) before being trend back this morning.
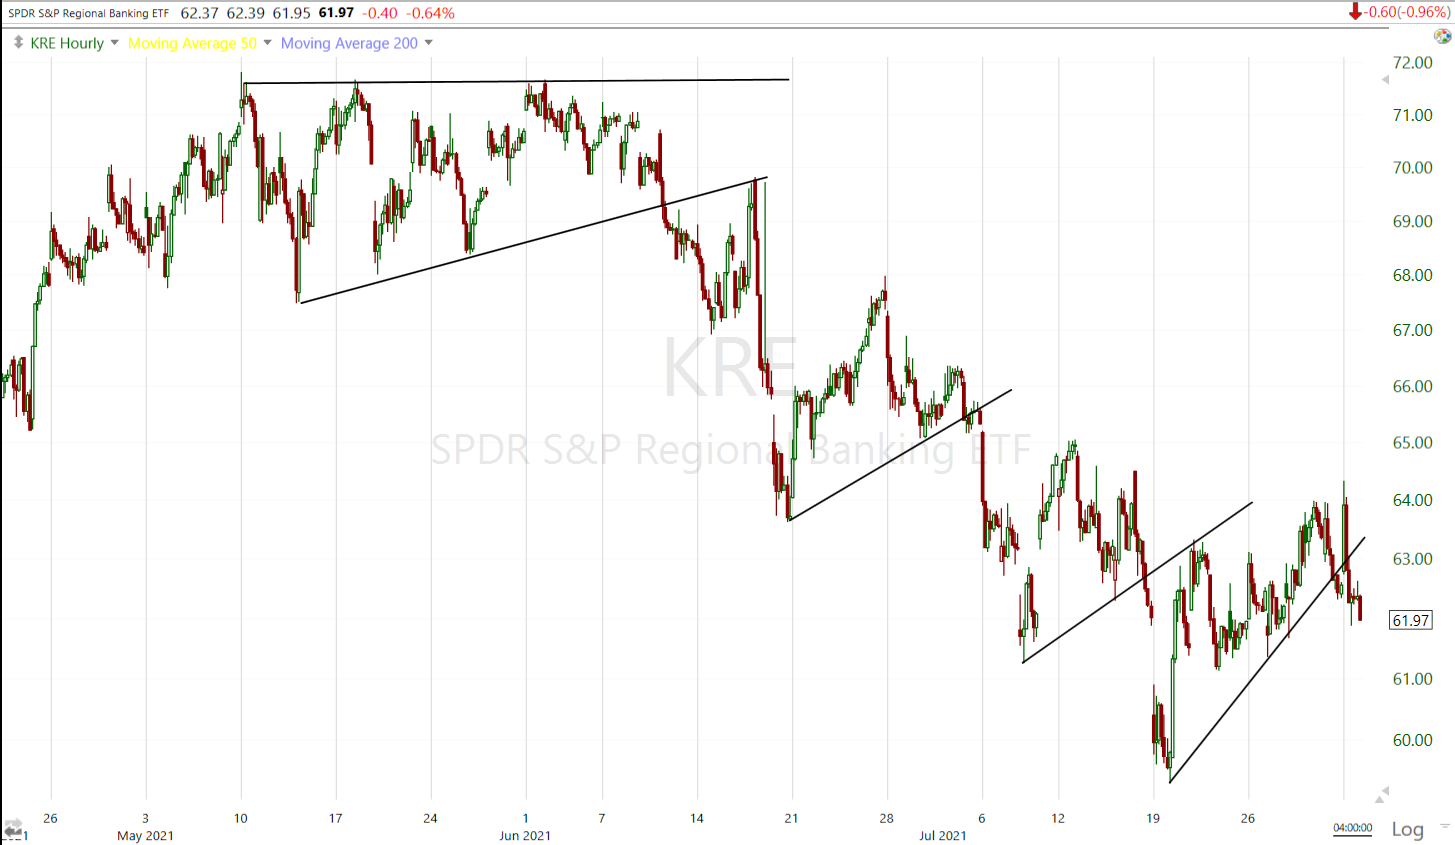 The Regional Banks (60m) are breaking the bear flag consolidation off the July 19th market lows.
Internals
NYSE Advancers (1530) had almost a 3-to-1 edge over Decliners (1730) this morning, but that was blown by the close, on slightly lower Volume of 835 mln. shares.
The mixed S&P sectors and similar advancers/decliner would have ruled out a 1-day oversold condition anyway. The Dominant price/volume relationship also rules it out, although it did lean toward Close Down/Volume Down, which is typical of a consolidation day, but does leave the door open to more downside until a short term oversold condition.
I’ve pointed out rising 52 week lows as the averages advanced (shouldn’t happen in a healthy market), but let me also point out the declining number of new 52 week highs, the most serious divergent trend since the March 2020 lows.
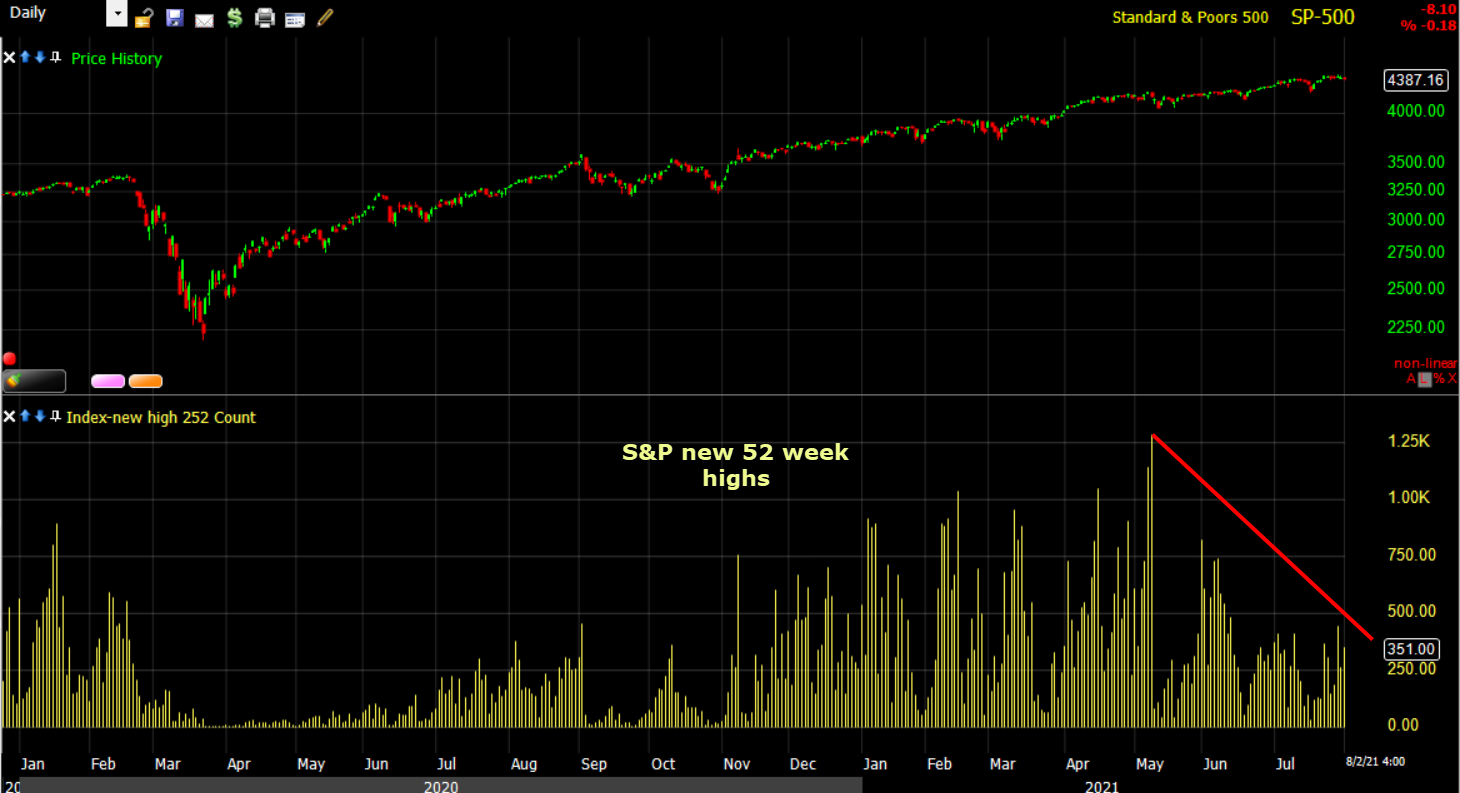 SP-500 (daily) and New 52 week highs declining as the S&P advances.
Treasuries
German 30 yields tumbled back below 0 for the first time since Feb 5th.
The U.S. 10-year yield was trading at 1.21% right before the two reports were released at 10:00 a.m. ET, then dropped to 1.15% over the next two hours as the data reinforced expectations for growth rates to moderate. The 10-year yield settled the session at 1.17%, or seven basis points below Friday’s settlement, which is a fairly large move. The 2-year yield decreased one basis point to 0.17% suggesting that either inflation concerns are taking a backseat as economic growth stalls, or that the Fed will be less willing to raise rates, as the June FOMC hinted at via the dot-plot, with economic growth faltering. It should be noted that the longer and more severe the delta variant spreads, the more it will impact supply chains and bolster inflationary pressures.
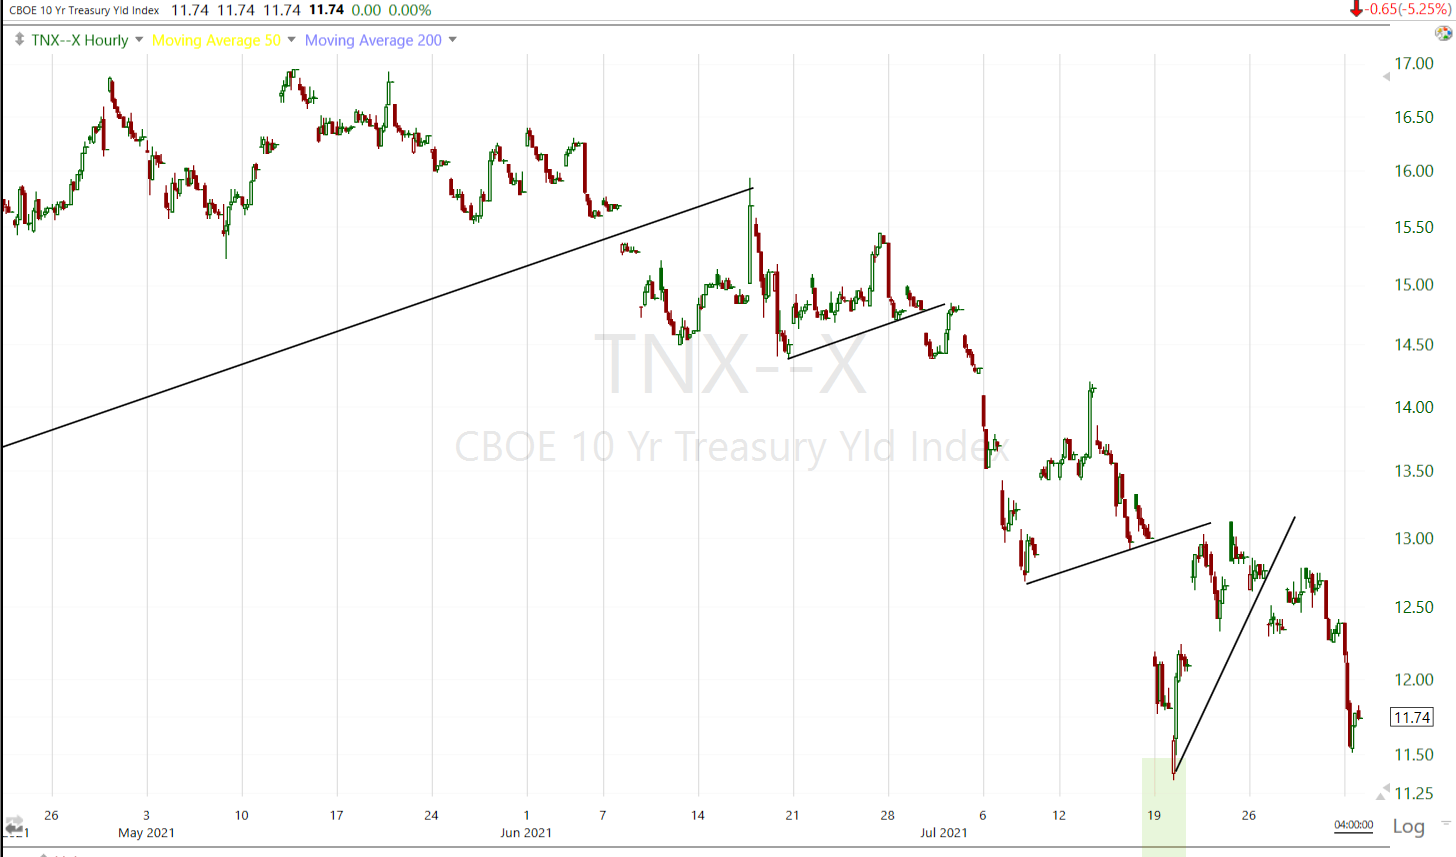 The 10-year yield (60m) bounced off July 19th market lows with equities, but broke below the trend last week, and closed below July 19th levels today – leading the benchmark index lower.
TLT’s most recent consolidation has mutated into several different forms, but all have had a bullish bias.
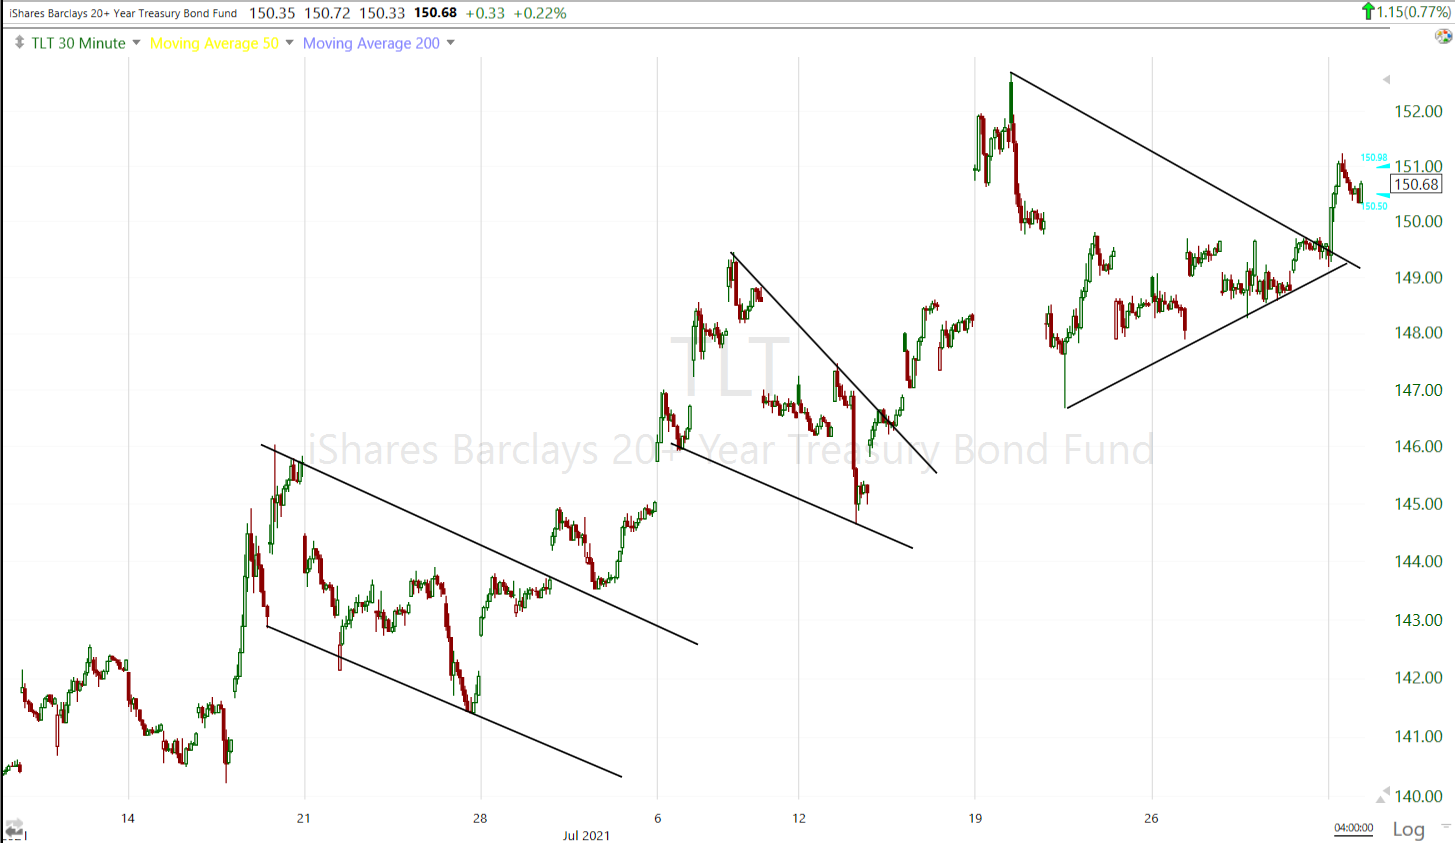 TLT (30m) is looking like a breakout from a triangle consolidation. The measured move suggests at least 4% upside on the next leg up.
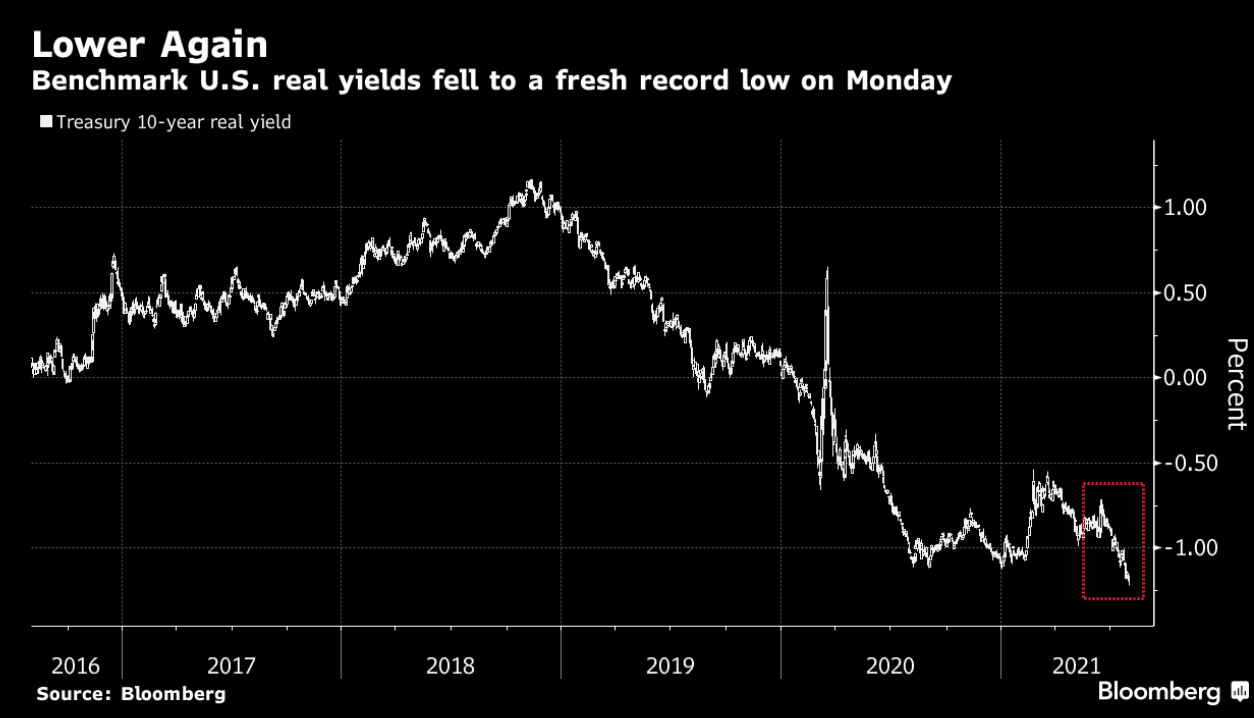
U.S. real yields (nominal less inflation) hit a new record low today, which should be supportive for gold prices.
Currencies and Commodities
The U.S. Dollar Index decreased 0.1% to 92.07.
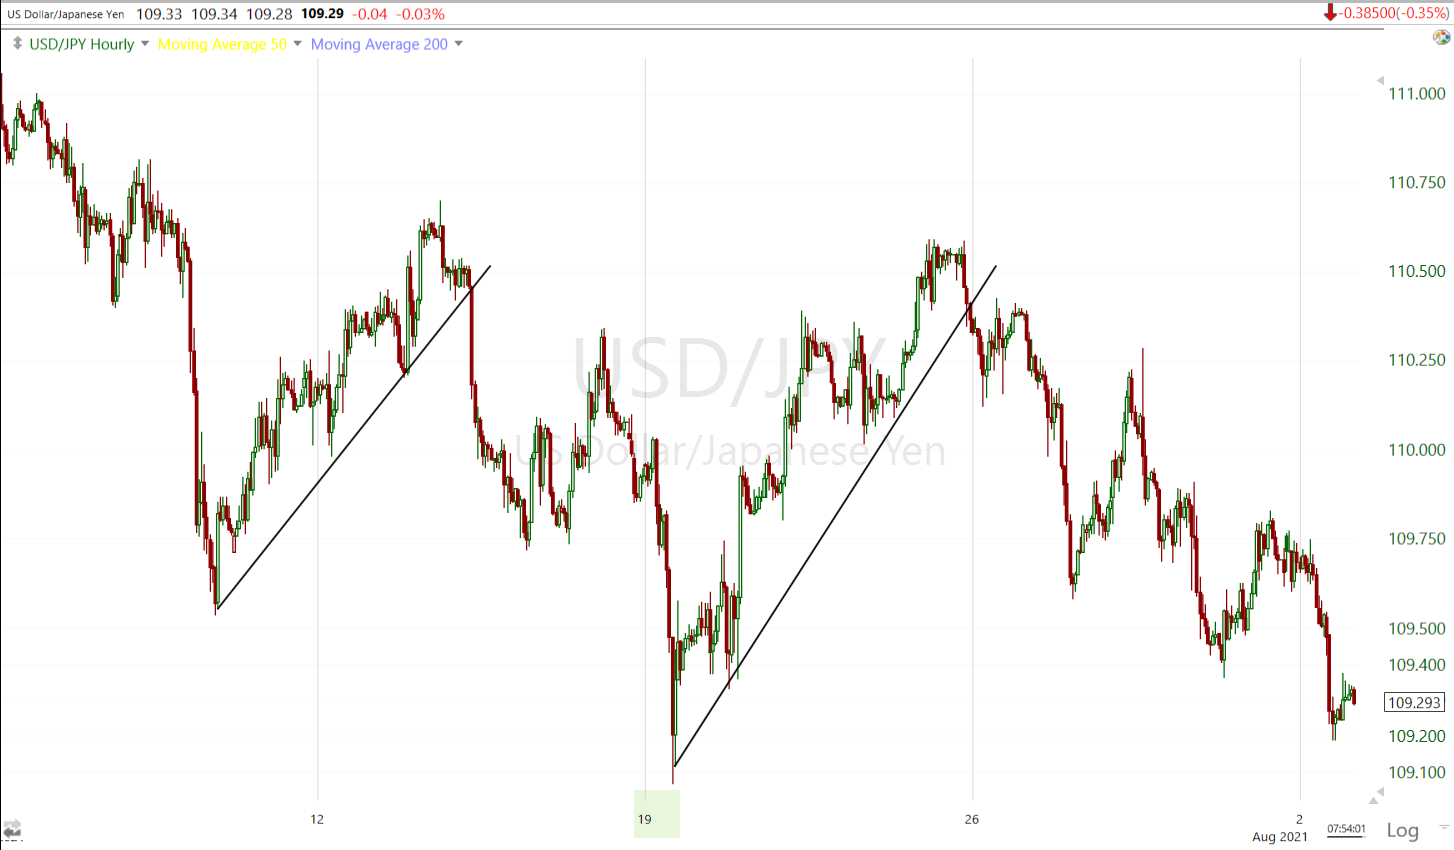
USD/JPY broke below the July 19th rebound trend (bear flag) with another leg lower today, indicating increased appetite for the safe-haven Japanese Yen.
Commodities were mixed with crude the big laggard along with copper. Precious metals were flattish.
WTI crude futures fell -3.5% to $71.31/bbl. plunging the most in two weeks as the virus dents the outlook for consumption.
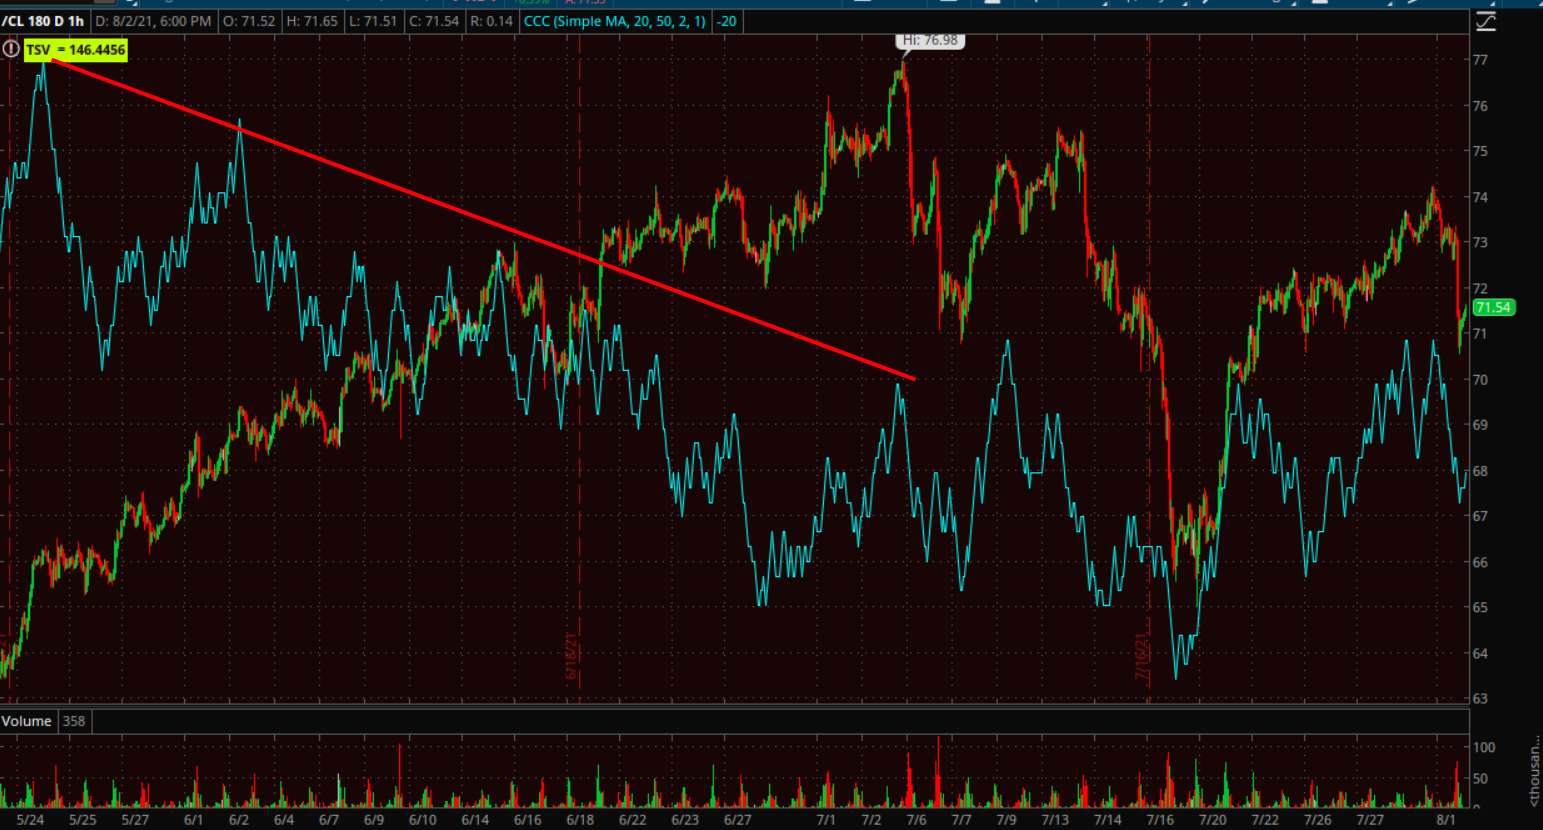 WTI Crude futures (60m) 3C was divergent at Crude’s highs, suggesting a lack of conviction in further upside gains.

Crude (5m) tumbled after the release of the ISM report this morning, and while bouncing off session lows, the bounce has the makings of the start of a bearish flag suggesting there could be more downside to come.
Among macro market signals that have signalled peak growth and started turning lower (AUD/USD or long term bond yields), Crude had remained resilient. As pointed out this morning, that may be starting to change which would give more credibility to the macro signals leading lower. It’s too early to say definitively like AUD/USD or long term bond yields, but Crude showed the first sign of relative weakness recently, and today led the benchmark S&P lower.
 SP-500 (15m) and USO (not normalized) shows the first divergent high in crude last week at the red arrow, and leading lower today (red circle).
The one positive development is WTI Crude tested under and held its 50-day sma.
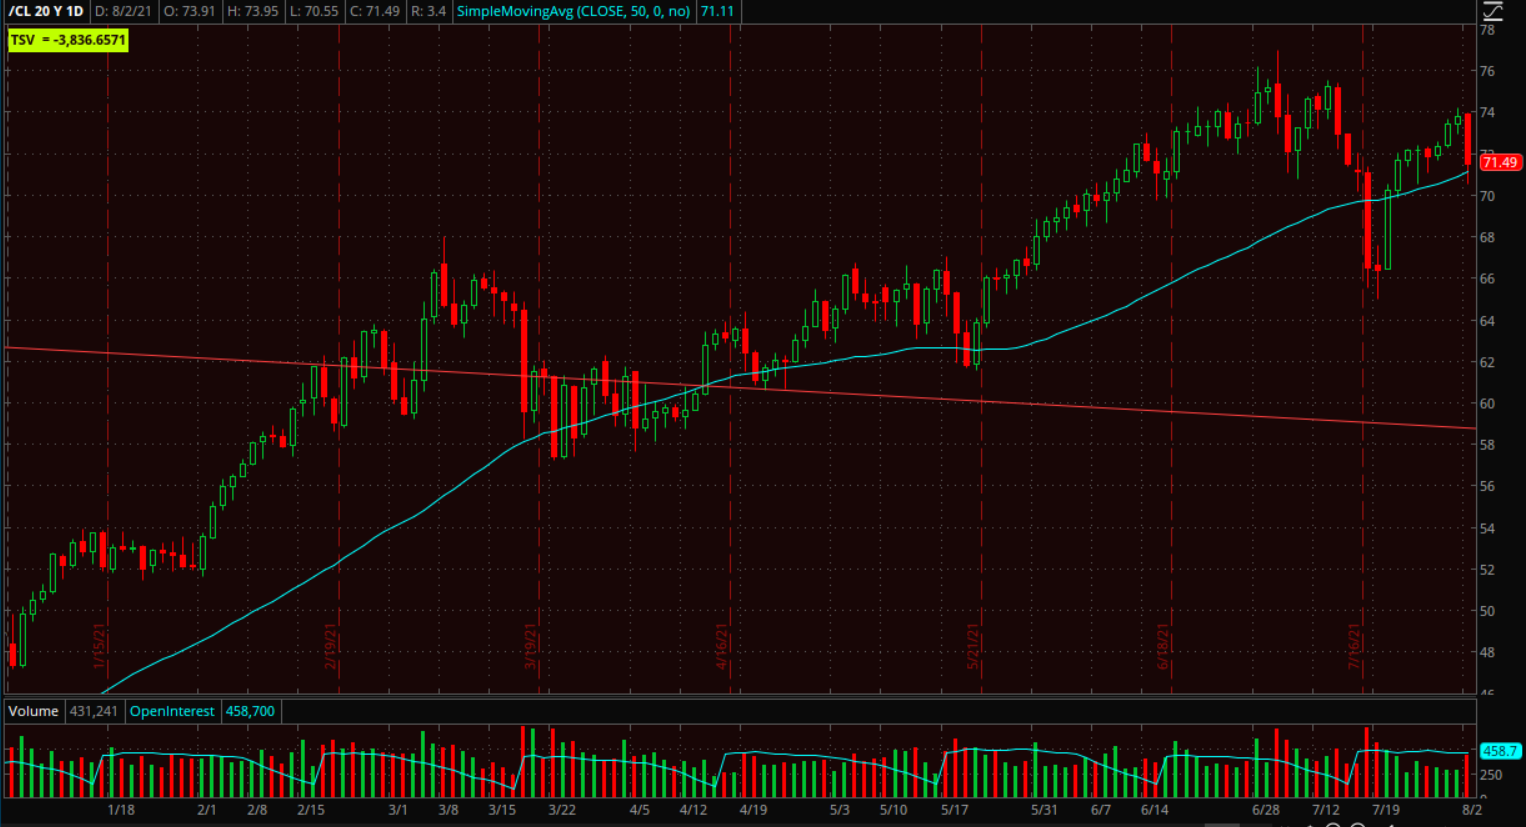 WTI Crude (daily) and 50-day sma (blue). The red trendline is a long term primary downtrend from 2008.
Keep in mind that the S&P Energy sector reflected weakness before WTI Crude.
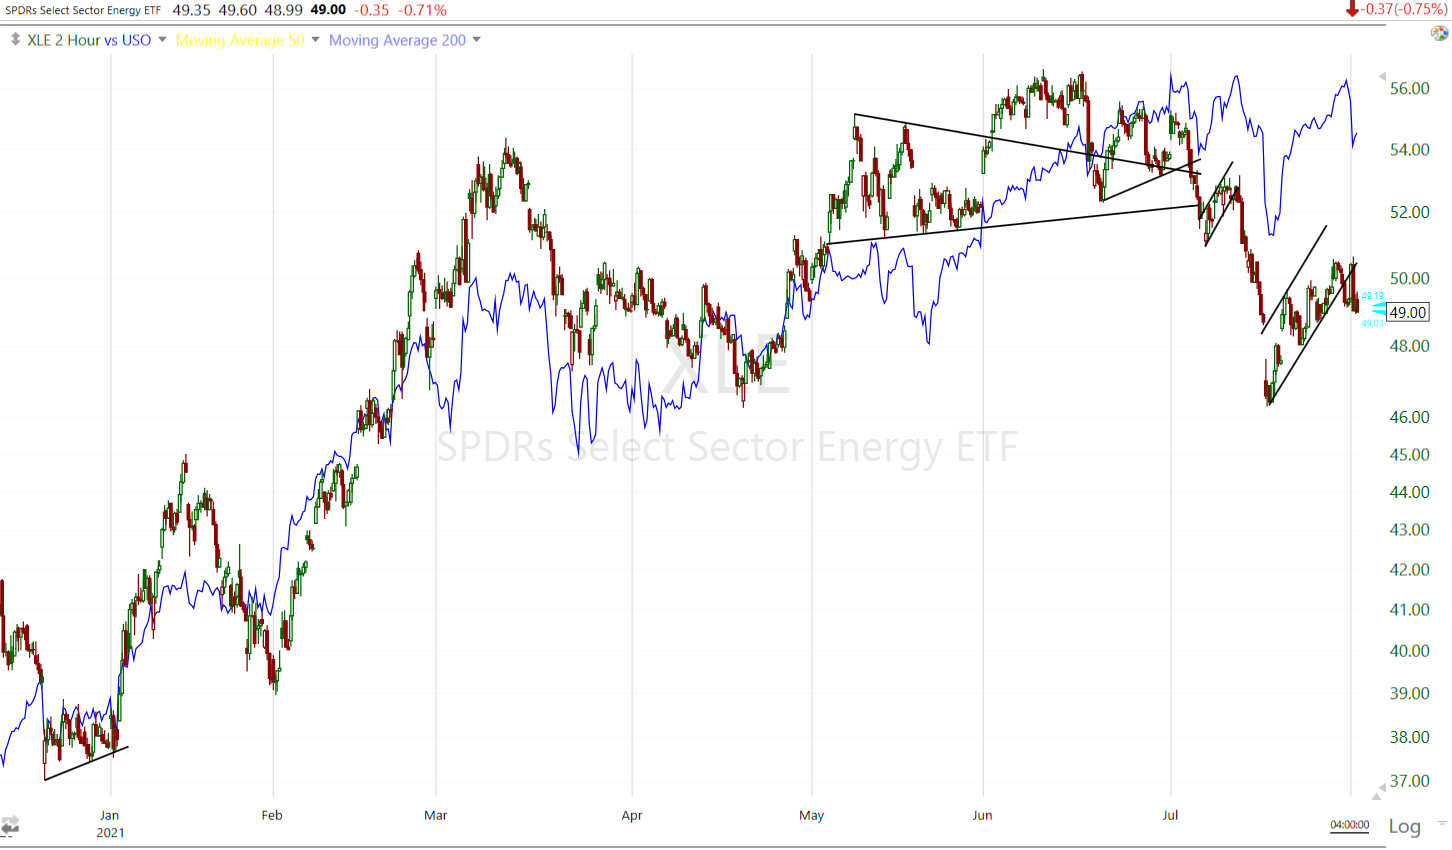 Energy sector (2h) and USO (blue)
Gold futures settled $5 higher (+0.3%) to $1,822.20/oz, aided in part by a decline in treasury yields and the dollar. The new record low in U.S. real yields continues to be a supportive factor for gold and recent price action has improved.
 GLD (60m) taking on a more constructive price tone from the green trend lines. Prices just filled the upside gap which is not an issue.
I’ve been pointing out a recent bullish change in character in Bitcoin’s price action… an ascending triangle. Friday afternoon price broke out of the triangle on an uptick in volume…
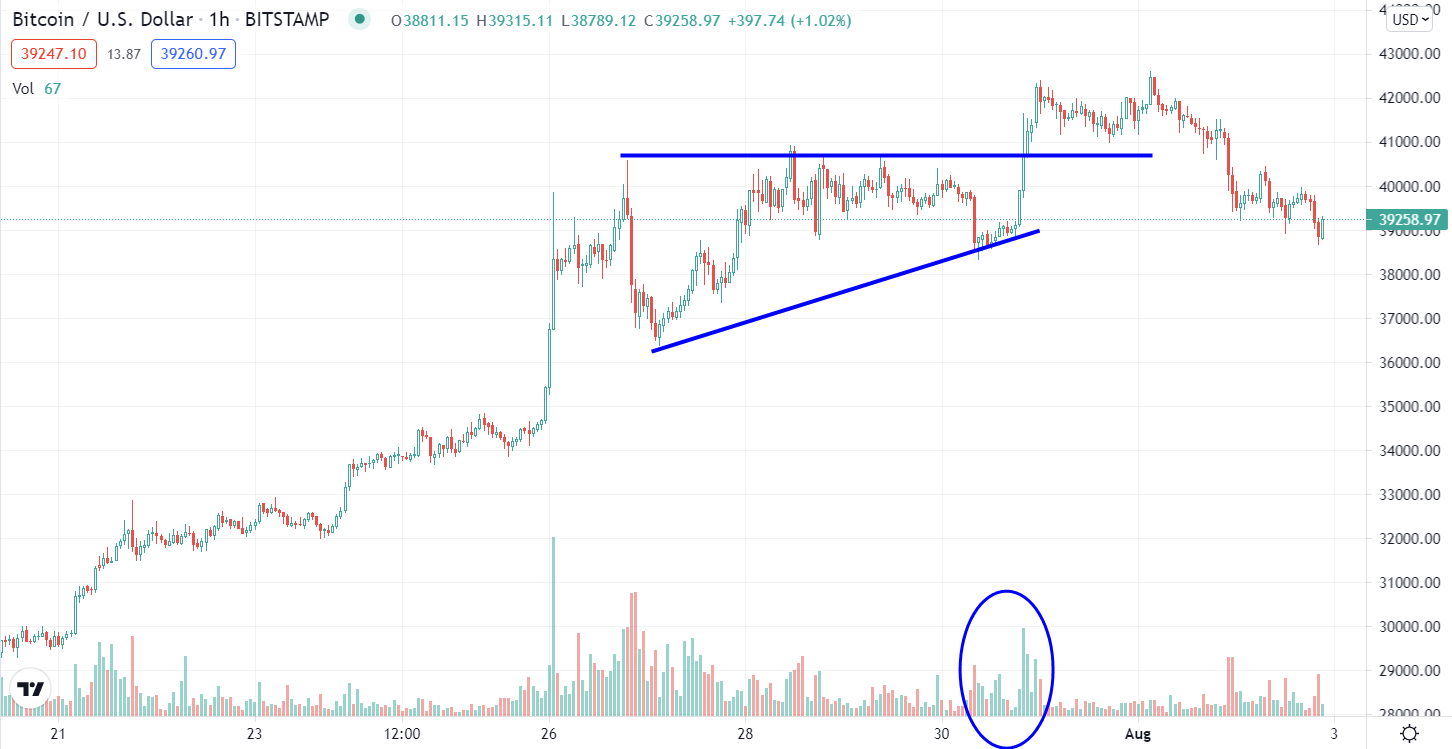 BTC/USD (60m), but came back down apparently due to the new infrastructure bill’s crypto taxation plan.
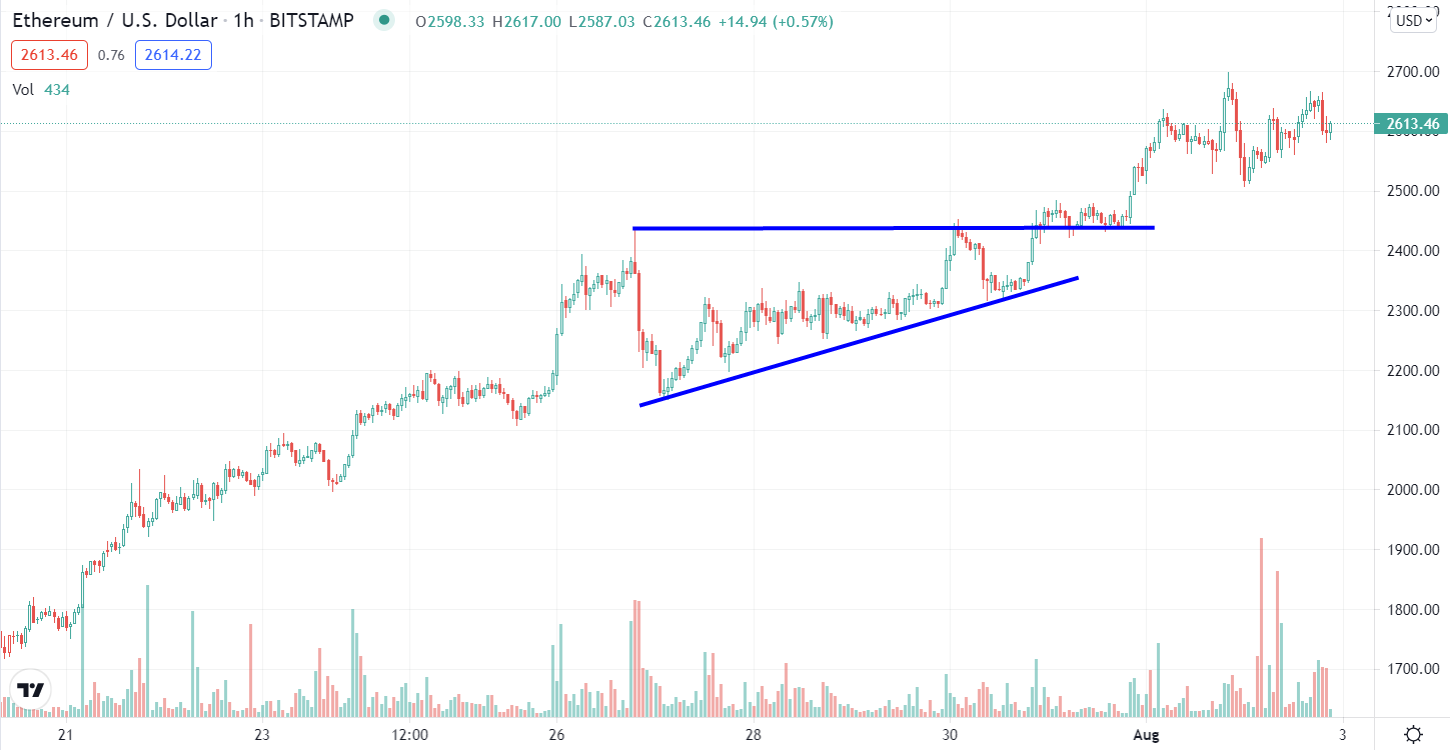 ETH/USD (Ethereum 60m, which I prefer and remain long) acted better than BTC, holding its breakout from a similar ascending triangle.
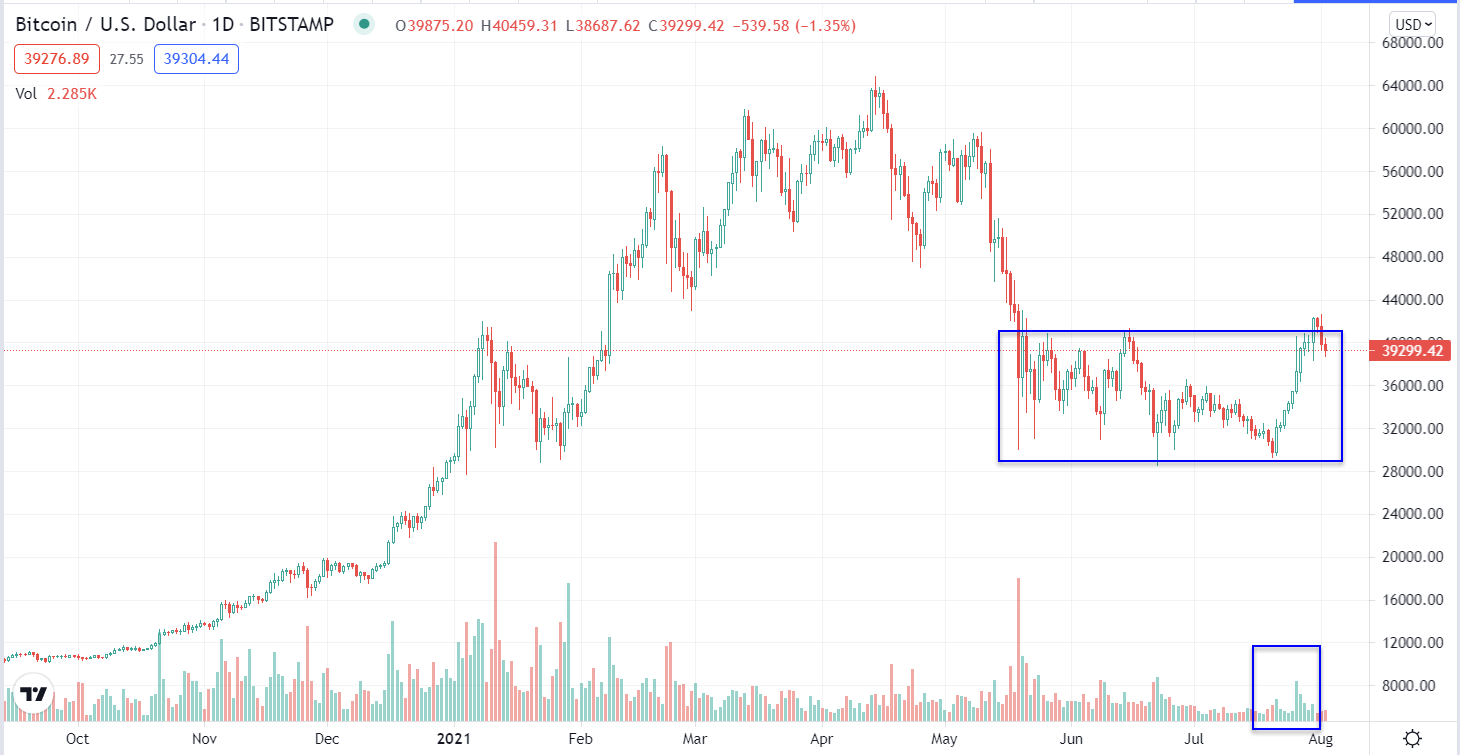 BTC/USD (daily) note where price was turned back.
Summary
Between the Delta covid varinat’s spread and slow-down in U.S. manufacturing data (and China where economic reports also suggest a slowdown from peak expansion), the market once again focussed on peak growth and that the economic recovery from the pandemic is losing momentum.
Yields are already signalling a negative impact as they broke below the July 19th rebound trend and July 19th closing lows. I’m keeping a close eye on the other macro signals that has been useful, such as AUD/USD, which continues trading in a bear flag, but got a little bounce today after China hinted at more stimulus to come amid a rise in COVID cases.
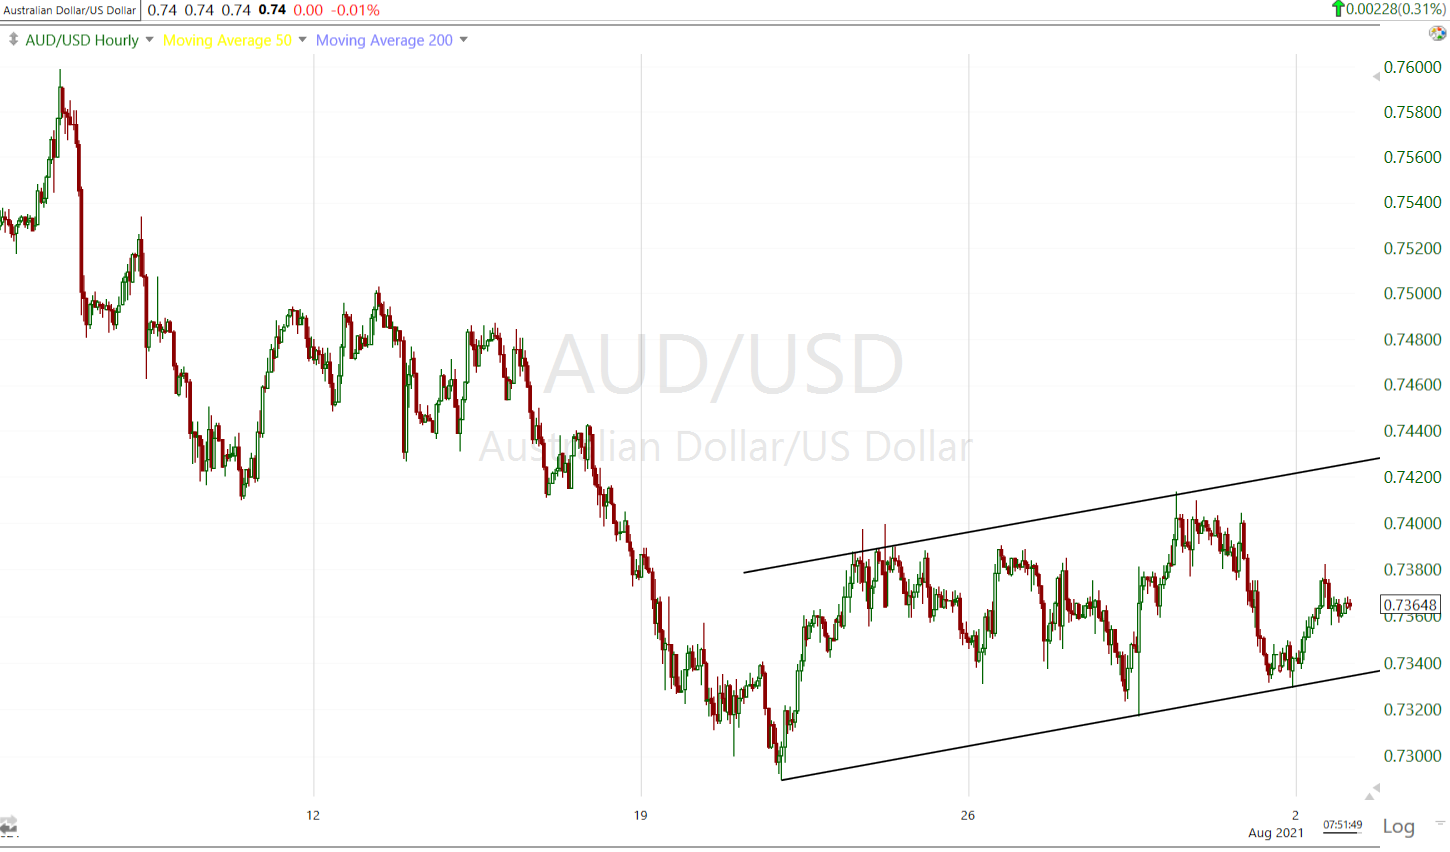 AUD/USD (60m) bear flag
The other thing I’m watching closely is credit. Today’s signals in credit have to be taken in context as many of the assets in my index went ex-dividend today, but showed weakness this afternoon after the discounting in the morning.
 SP-500 (5m) and my custom credit index with the effect of many assets going ex-dividend in yellow at the open, but afternoon weakness in red.
HYG is my favorite and is similar…
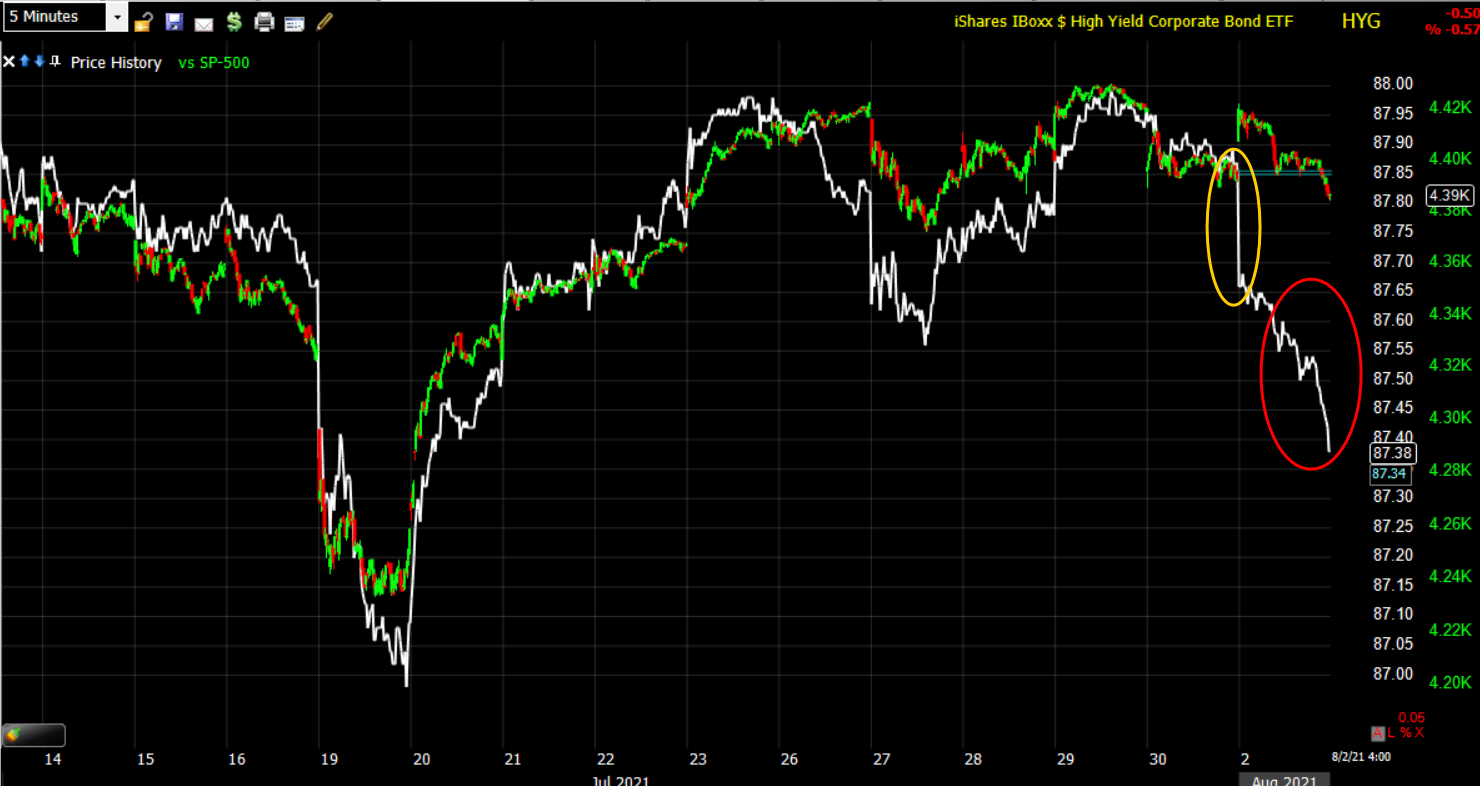 SP-500 (5m) with HYG going ex-divy at the open (yellow), but clear afternoon weakness (red).
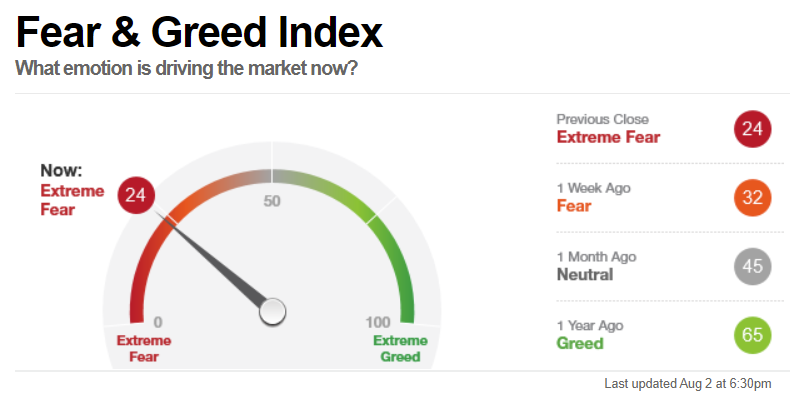
The one edge equities may have are the extremely pessimistic sentiment represented by the fear and greed index, which at extremes, tends to be a contrarian indicator.
Traders are awaiting key U.S. jobs data this week to gauge the recovery and monitoring the impact of price pressures sparked by pandemic-related disruption and bottlenecks.
Overnight
S&P futures are up +0.25% bouncing off session lows, but thus far in a small bearish flag. Other index futures are similar in tone tonight.
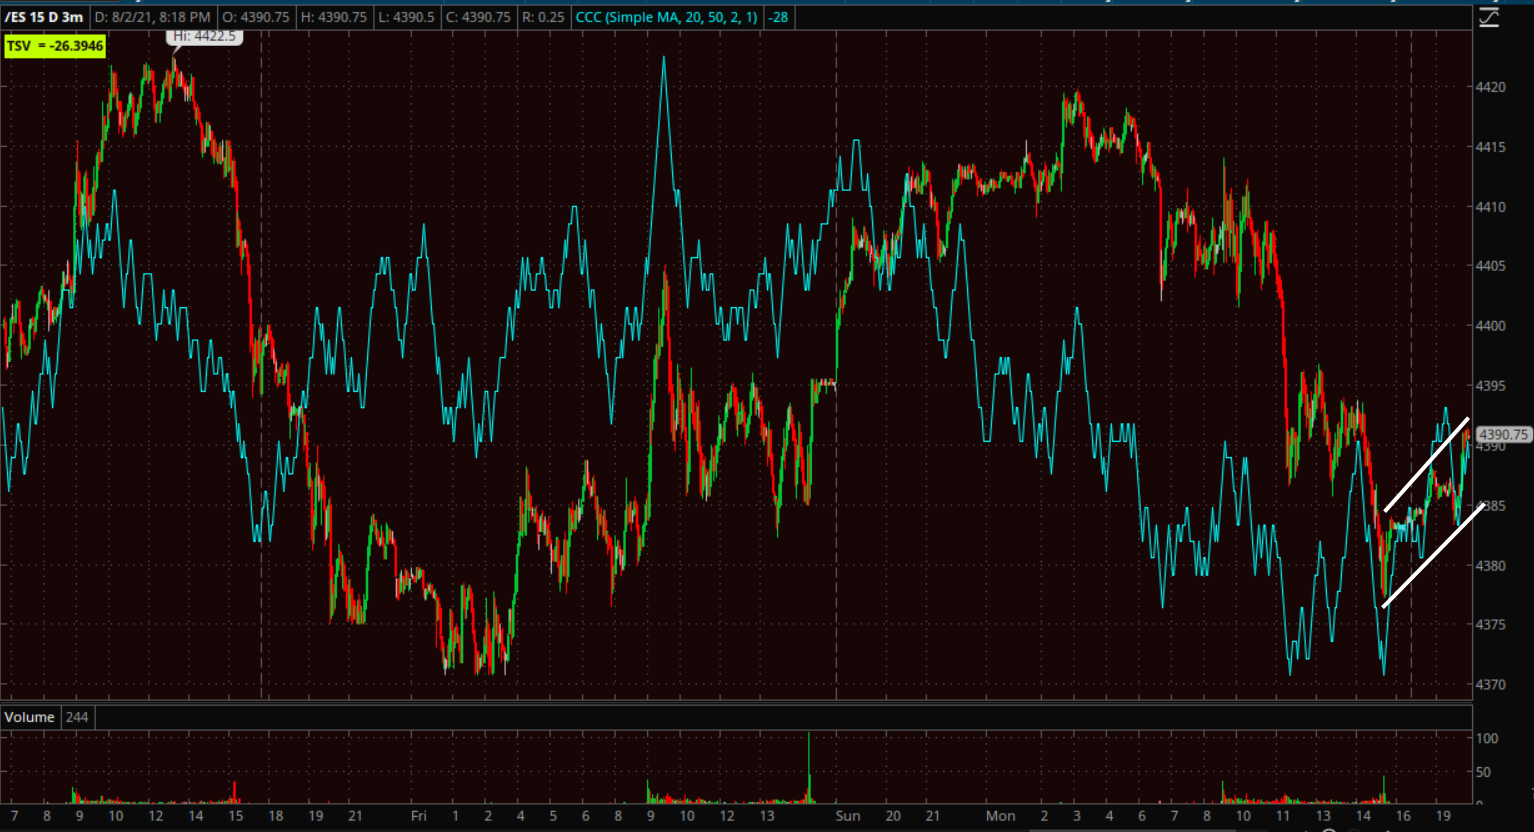 ES (3m) note the short-term 3C negative divergences at recent highs and the flag tonight (white trend lines).
VIX futures had positive 3C charts before the open…
 /VX (1m) but do appear to be facing selling pressure from session highs and into the overnight.
WTI Crude is up +0.5% off session lows, but like index futures, in what appears to be the start of a bear flag. I’d expect resistance around $72.50.
Safe-haven Yen futures still have a bullish stance heading into the overnight session.
In an almost mirror (opposite) reflection of S&P futures, long term U.S. Treasury futures are consolidating in a bull flag tonight, but 3C does not look as supportive as this morning in the A.M. Update.
Looking ahead, investors will receive Factory Orders for June on Tuesday.
Additionally this week….
- Earnings are due this week from Alibaba, BP, Toyota, Uber, Roku, Moderna, KKR
- Reserve Bank of Australia policy decision Tuesday
- Bank of England is expected to keep its benchmark interest rate and its bond-buying target unchanged Thursday
- Reserve Bank of India monetary policy decision, briefing Friday
- The U.S. jobs report on Friday