Stock Market Daily Wrap for July 21, 2020
There were quite a few themes today, some realted, some unrelated, some contrasting or contradictory, some repetitive and just treading water in earnings season. One theme was the rotation of rotation (repetivie). Yesterday the mega-caps lifted the NASDAQ to an all-time new high, while every other sector that didn’t contain mega-caps closed lower. Today was virtually the oppoosite. Yesterday Small Caps and Dow were weak, today they were the best performing. Yesterday the Momentum style factor gained and Value fell, today it was the opposite.
Lets take on the rotation to value and growth senstive cyclicals, from mega-cap momentum that first emerged early last week. I’m going to use the market neutral momentm style factor, which for our purposes can be seen as a proxy for mega-cap Technology when it rises, and the growth senstive cyclicals and small caps when it falls.
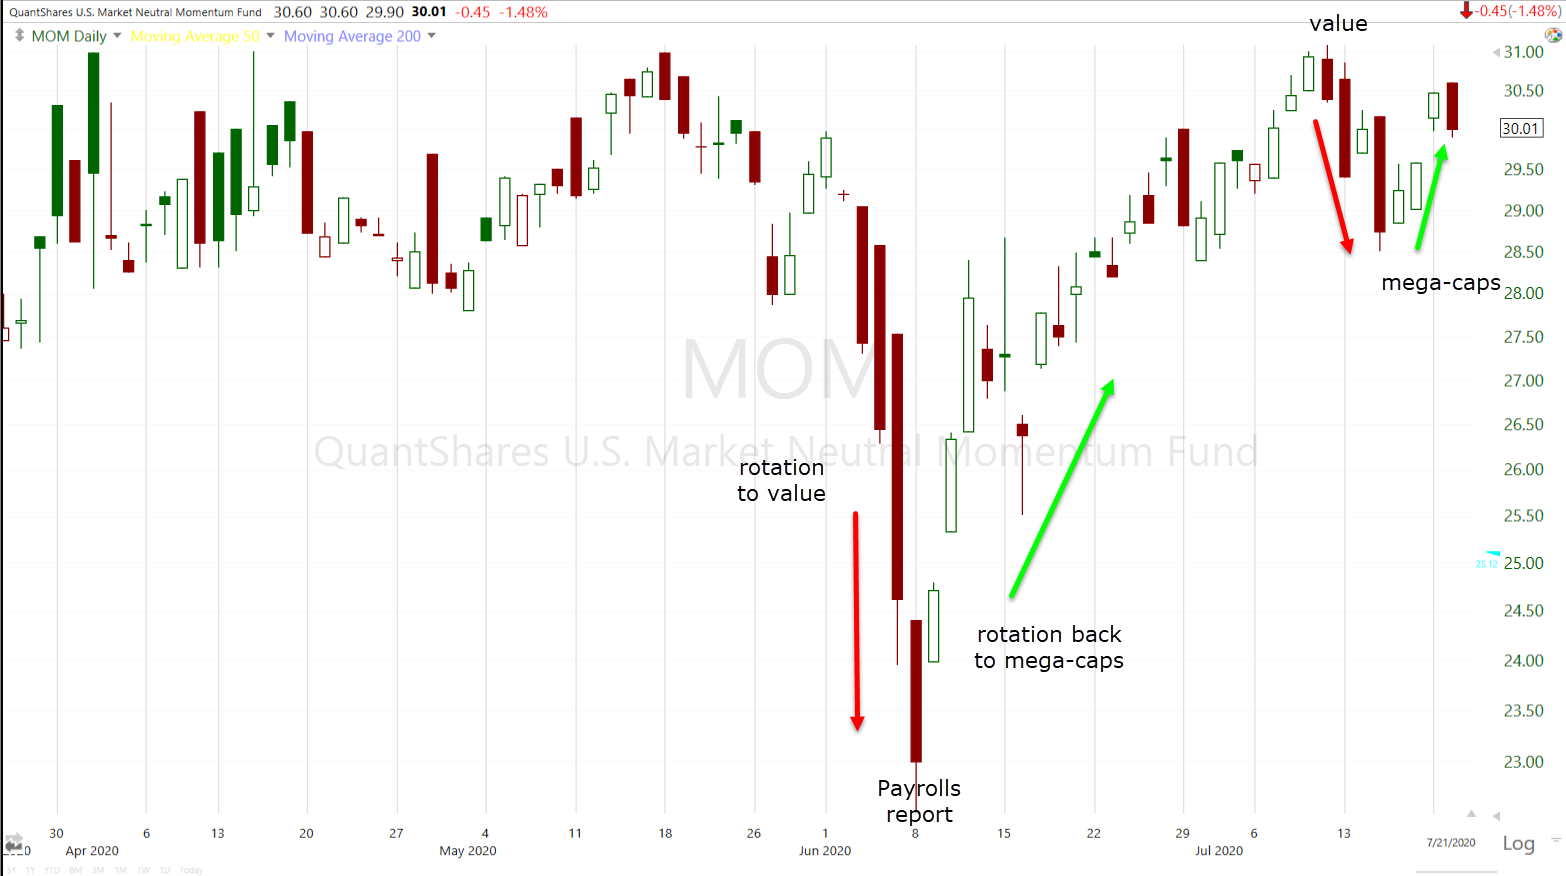
The momentum style factor (daily) has been the dominant theme for years, and was extremely dominant coming into 2020. You might recall that early in the year it was 5 or 6 mega-cap stocks that drove the entire market to new highs before the cash.
Even when the market crashed, they outperformed and the momentum style factor continued to rise as it performed far better than cyclicals/small caps/value. There was one brief rotation to the value factor from mid-May to early June confirmed by bonds, then it turned sharply after Payrolls and the mega-caps/momentum once again drove the market until last week. The rotation to value/cyclicas/small caps that started last week is not trending, it’s treading water. As I suspected last week, this rotation (a few days on a few days off) seems to be much more about reducing exposure to extreme valuations (risk management), than conviction in economic growth. Said another way, treading water and killing time to get through earnings season, not a newly emerging trend. You’ll see the same on the price charts below of sectors like Energy, Banks and Small Caps.
Mega-caps like Amazon saw follow through and were up in pre-market, but tumbled into the cash market with NASDAQ 100 futures putting in a negative 3C divegrence overnight and into the pre-market. I pointed out the change in tone in NASDAQ futures in the Early Update with this chart…
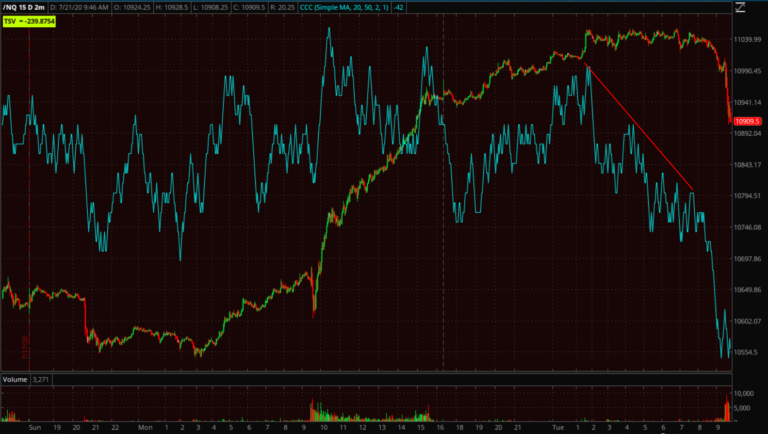
NASDAQ 100 futures (1m) and 3C negatively diverging form price after the NASDAQ’s new record closing high yesterday.
Further illustrating the tone change in Tech, IBM jumed up over +4.5% this morning after reporting earnings yesterday after the bell with sales beating forecasts. IBM fell from morning highs, giving back all gains to close down -0.33%.
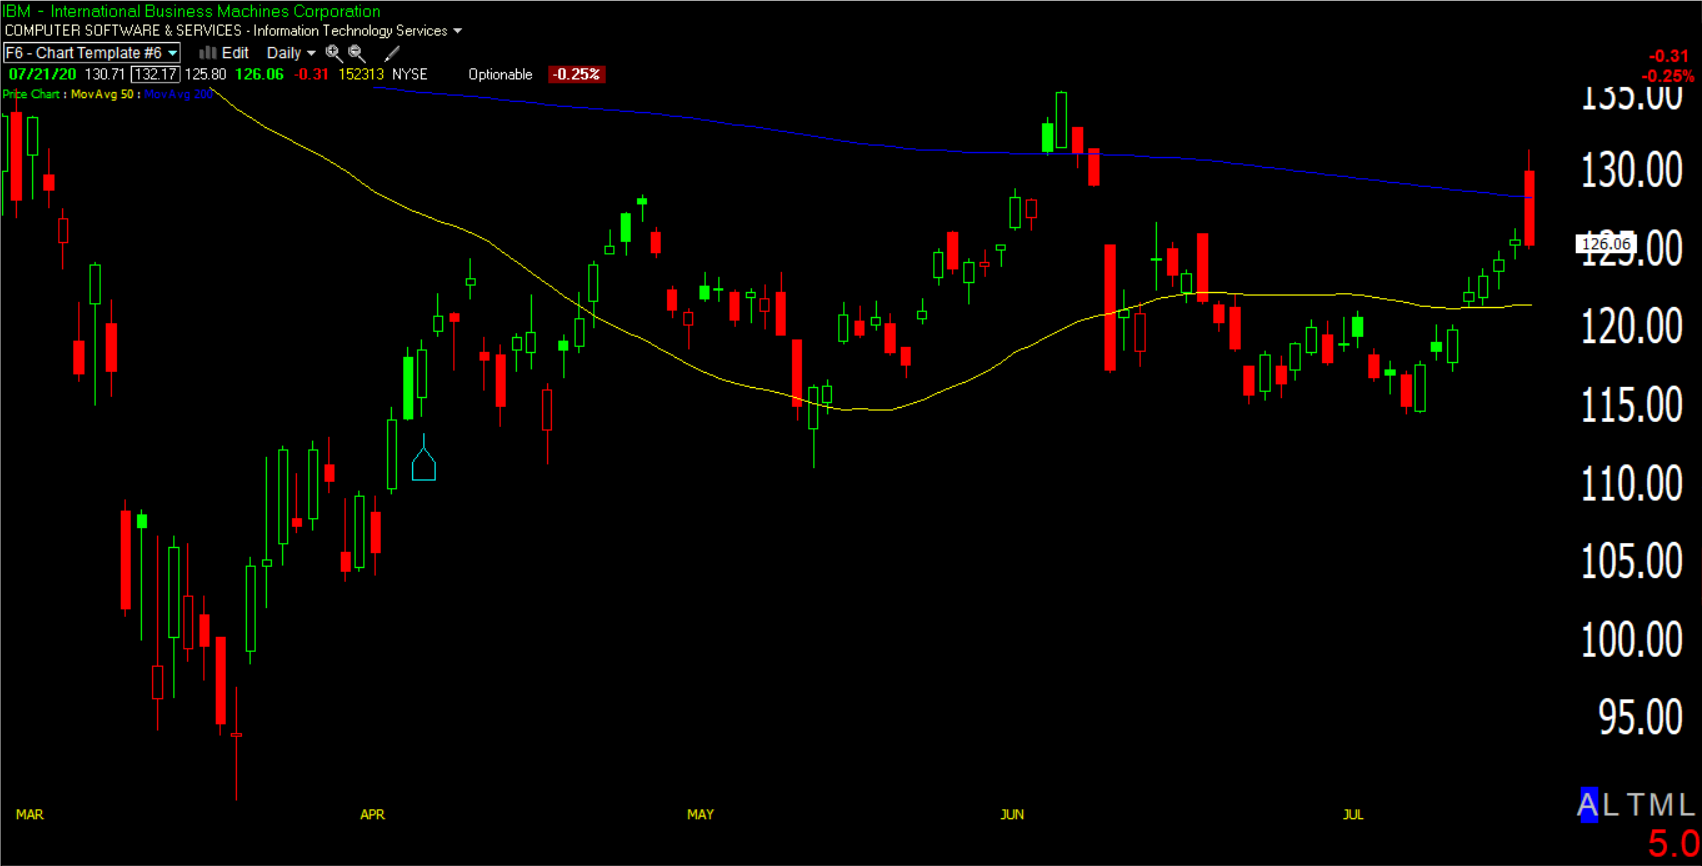 IBM (daily) gapped up above its 200-day (blue), then closed below and near the low of the day (bearish).
Outside of Technology, fellow Dow component Coca-Cola (KO +2.3%) also beat earnings estimates, but held its +2.3% gain.
Dollar weakness was largely driven by today’s successful conclusion of the EU summit where the stimulus package was finally approved after five days of discussions. The Dollar index tumbled below the June 10th low, which is usually a tailwind for stocks and certainly was for commodities.
In another conflicting set of signals, Commodity currencies like the Aussie rallied, yet so did safe-haven currencies like the Japanese Yen, in fact USD/JPY probed just below the $106.75 level I’ve been watching as a risk-off market signal.
I’ve been looking for WTI Crude to trade up to $42 since May, it finally hit the level this morning, the highest levels since March with Dollar weakness helping and presumably hopes that reflation will bloom thanks to Europe’s €750BN stimulus fund. WTI Crude closed below $42 after giving back some gains on a report that pointed to a strong rise in U.S. crude stockpiles.
Contrasting or even contradicting reflation hopes, Bonds did not confirm and the 10-year yield flirted with breaking down below the week-plus consolidation.
Gold and Silver continued their impressive rally. Gold hit my target area of the mid $1840’s and sits less than $100 away from its all time high from September 2011. Silver is at its highest level since 2014.
Averages
Small Caps were best, followed by Dow just as we saw last week when the rotation out of Tech and into value initially began. They were the weakest yesterday.
After a strong open for everything but NASDAQ, the averages drifted sideways for most of the day. Shortly after 3pm the Senate GOP leader, Mitch McConnell, was quoted as saying he does not expect the next stimulus bill to pass by next week. Or said another way, not before some stimulus measures, like the extra $600 a week in Federal unemployment insurance, expire. The S&P tumbled into the close, giving back most of its early gains of up to +0.8%.
S&P 500 ⇧ 0.17%
NASDAQ ⇩ -1.09 %
DOW JONES ⇧ 0.60 %
RUSSELL 2000 ⇧ 1.33 %
After the news the NASDAQ traded lower and closed near the low of the day. Small Caps and the Dow were less effected by the news, but gave back enough to close with Doji Star and Star candlesticks (respectively).
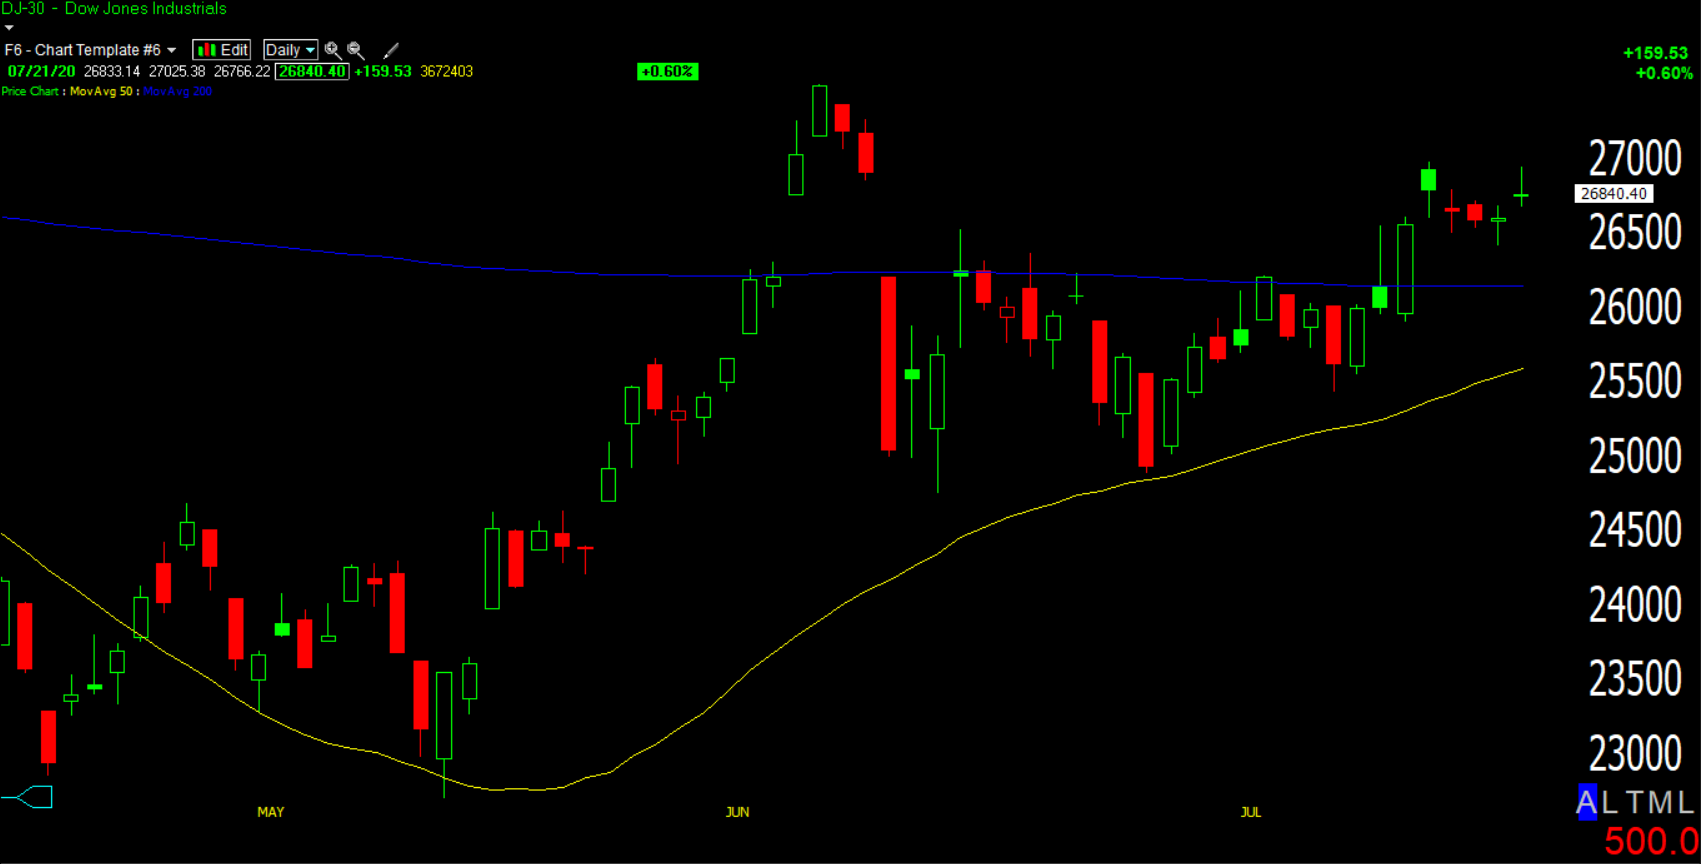 Dow (daily) closing with a Doji Star candlestick (loss of upside momentum). Notice how many small bodied candles we’ve seen over the last week since rotation out of Tech and NASDAQ began. The churning sideways over the last week with a bunch of small bodied price candles suggests this is the market killing time.
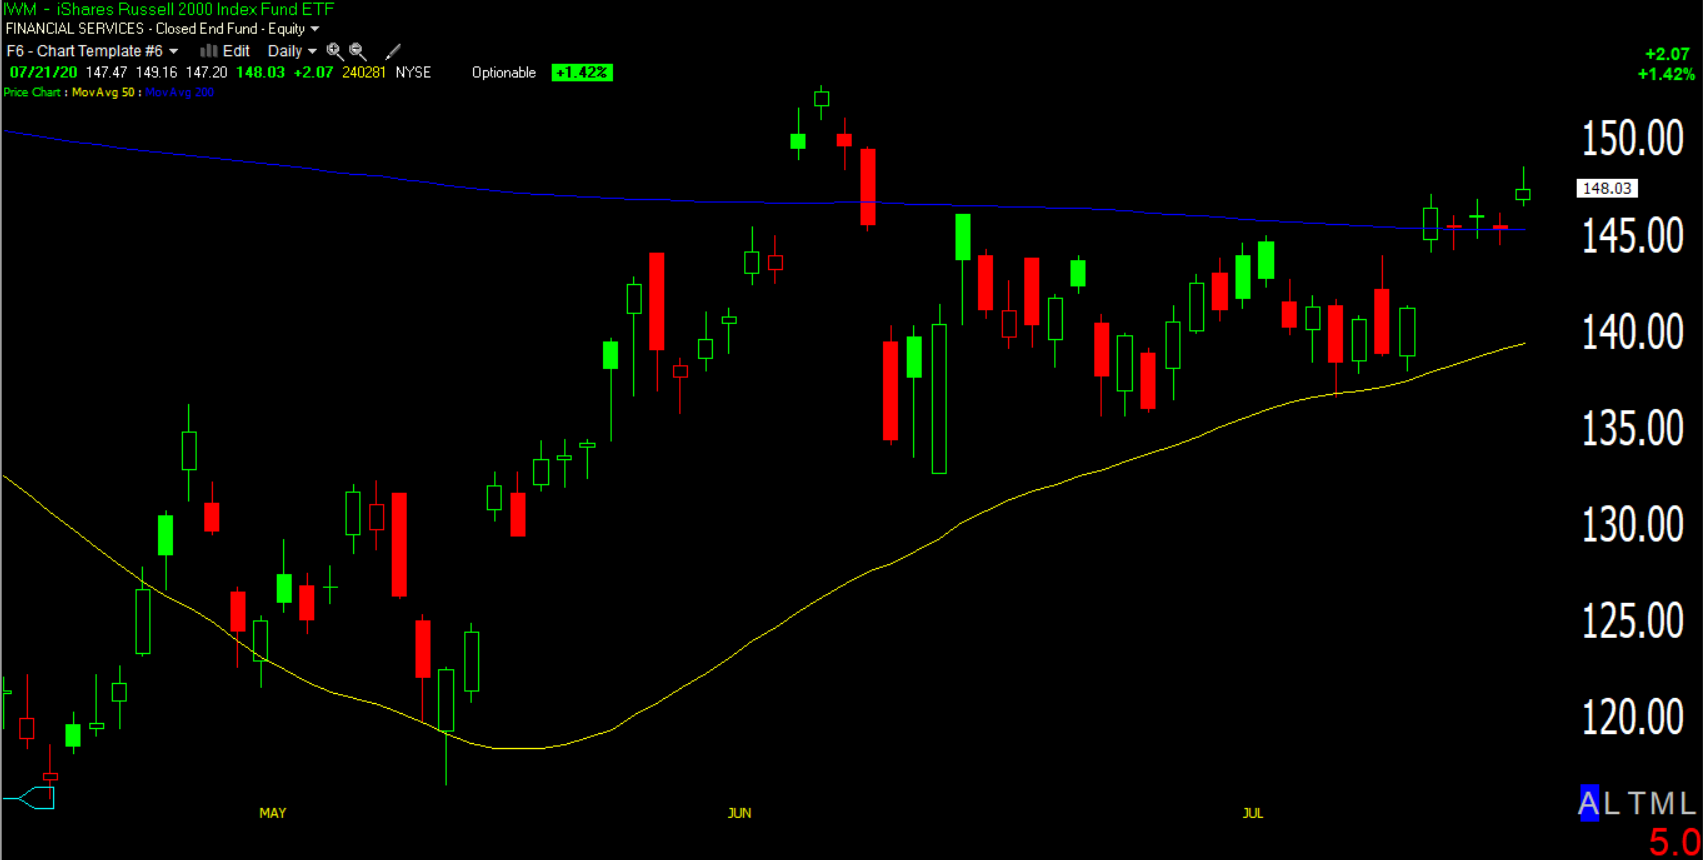 Small Cap/IWM (daily) put in a Star candlestick (loss of upside momentum), nearly a more bearish shooting star (in Japanese candlestick vernacular a Shooting Star represents trouble overhead). Notice too that since the rotation began early last week, boosting small caps above their 200-day moving average (blue), prices have more or less churnde sideways very close to the 200-day.
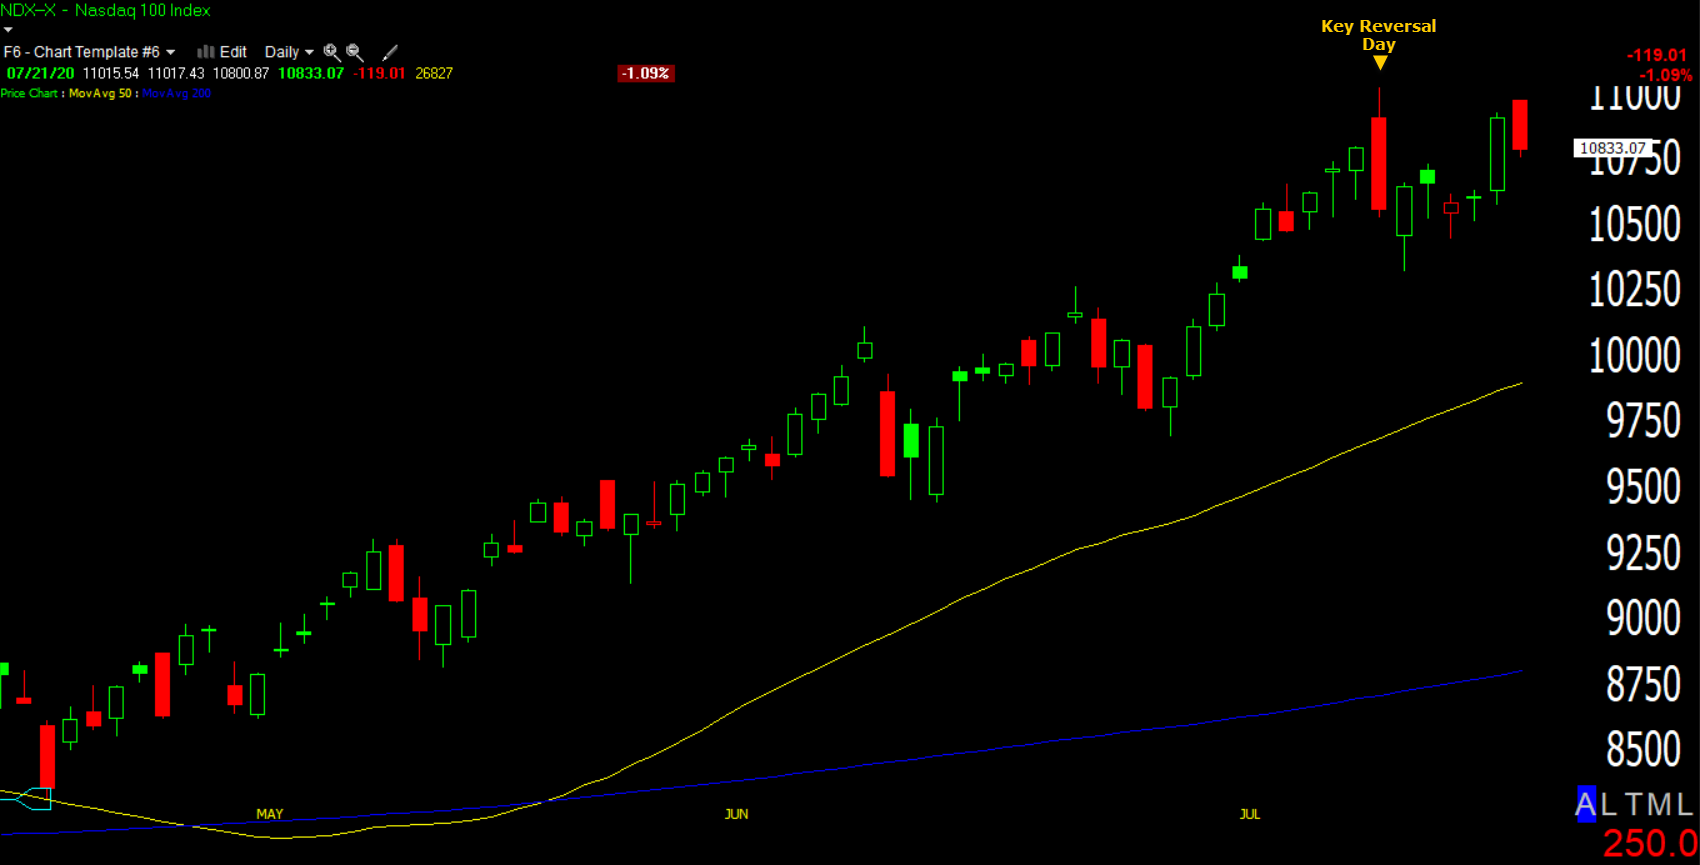 NASDAQ 100 (daily) made a new record close yesterday, but did not trade above last week’s Key Reversal Day. Today’s price candle is a bearish Dark Cloud Cover with a gap up and a close well into yesterday’s candle.
Lets take a closer look…
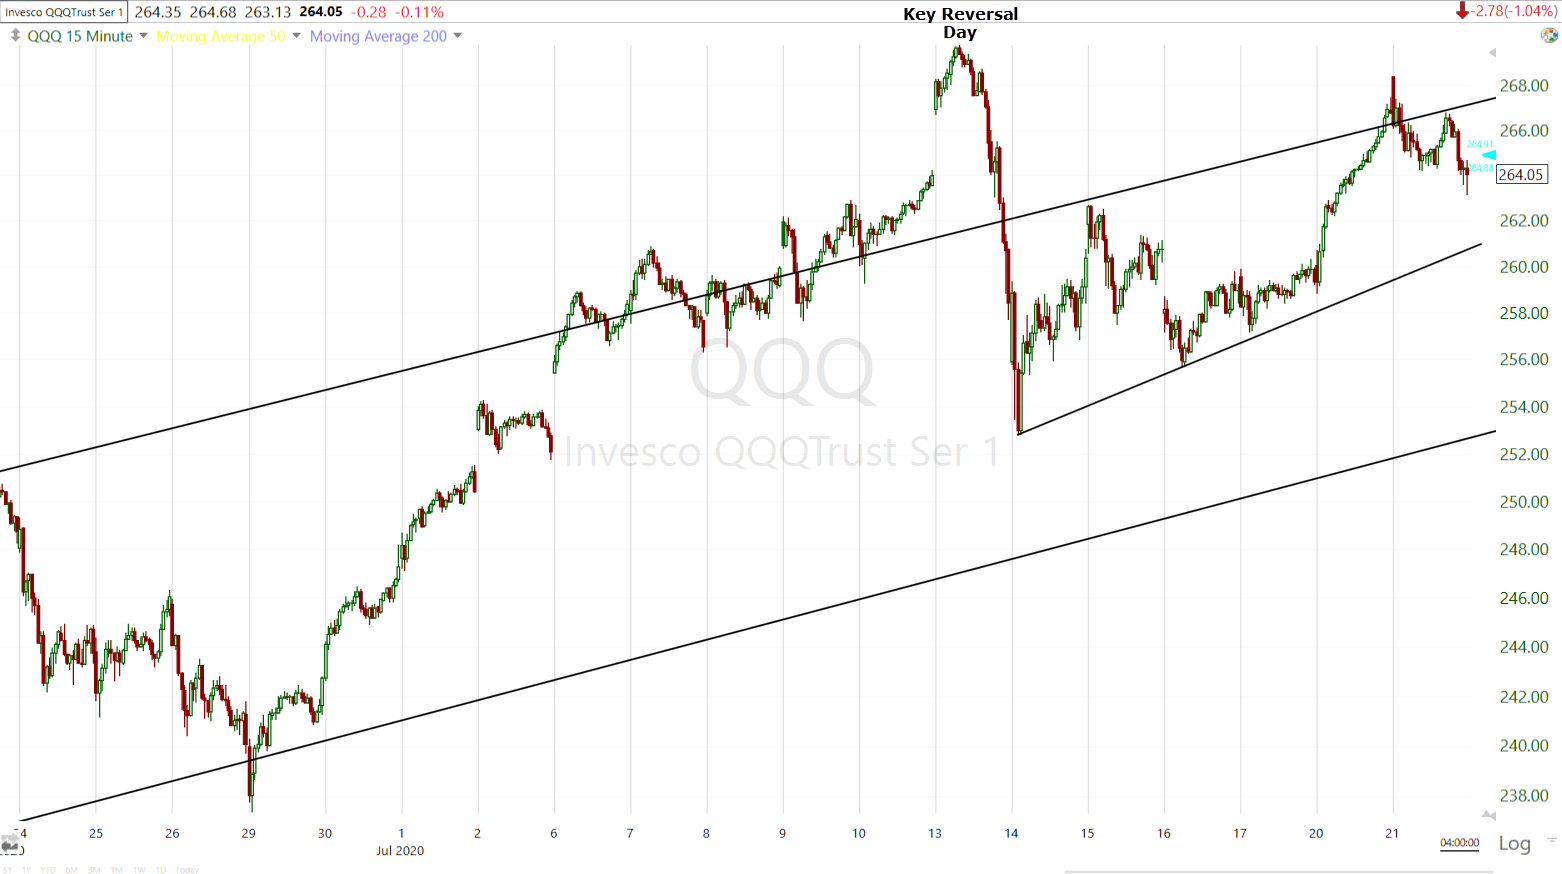 QQQ/NASDAQ 100 ETF (15m) notice prices ran into resitance at the key reversal day and the upper trend line of the QQQ’s channel from April. That’s where I shorted QQQ Monday (weekly puts). I’m looking for a downside target at the week-plus consolidation trend line around $262.
S&P sectors
Today’s sector performance is nearly the mirror opposite of yesterday’s when only 3 sectors closed green, all of them with mega-cap exposure (Technology Communications and Consuer Discretionary), while everything else closed red. Today the 3 mega-cap sectors underperformed with two closing lower, while the cyclical/value realated sectors outperformed with small caps. Energy was a notable standout on the upside as crude traded to its highest level since March. However, yields did not confirm the reflationary theme in Energy.
Materials ⇧ 0.87 %
Energy ⇧ 6.04 %
Financials ⇧ 1.97 %
Industrial ⇧ 1.32 %
Technology ⇩ -1.00 %
Consumer Staples ⇧ 0.87 %
Utilities ⇧ 0.45 %
Health Care ⇩ -0.07 %
Consumer Discretionary ⇧ 0.15 %
Real Estate ⇧ 0.03 %
Communications ⇩ -0.48 %
Despite the impressive outsized gain in the Energy sector…
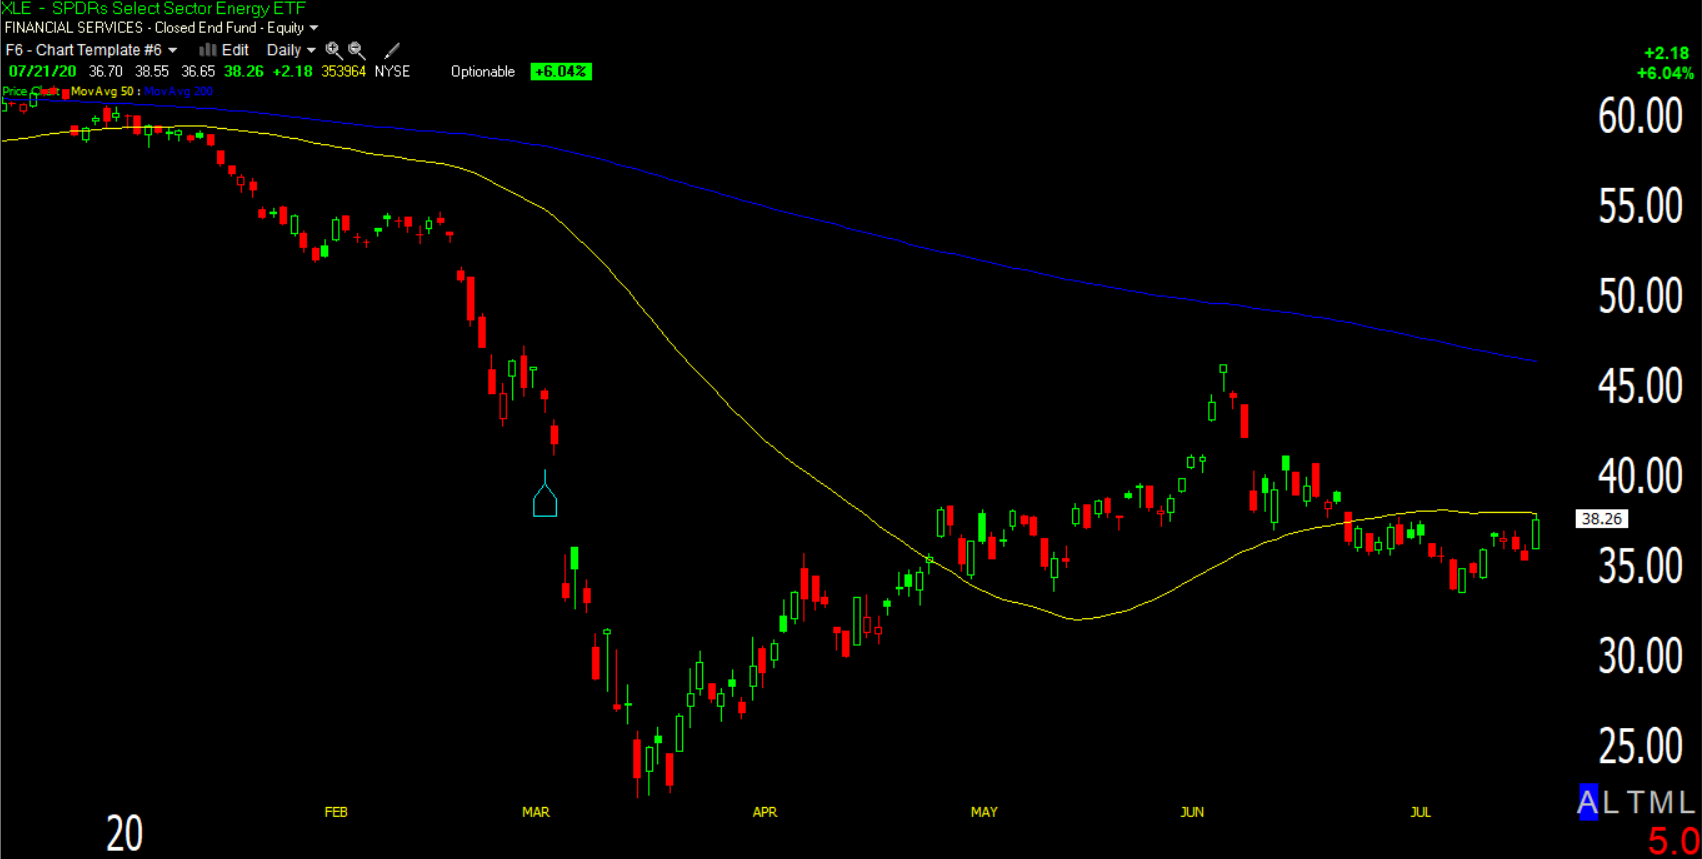 Energy setor (daily)- traded up to back-test its 50-day moving average from below where it found intraday resistance.
The Industrial sector has been part of the value rotation from last week and outperformed today..
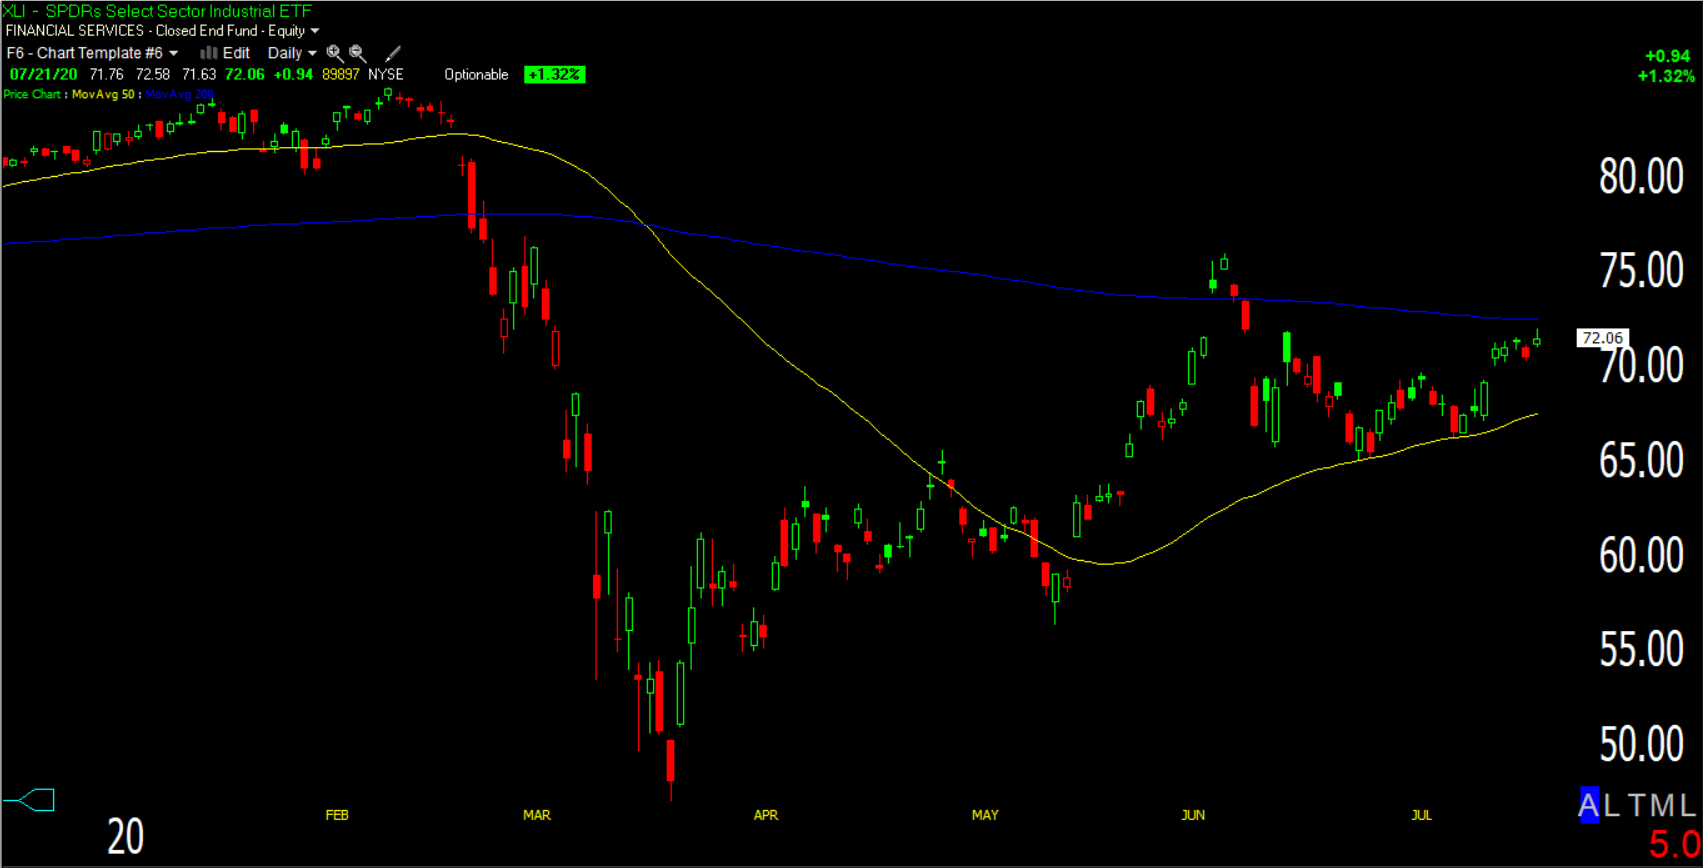 Industrial sector (daily) as noted a week ago after bouncing off the 50-day moving average (yellow), the blue 200-day moving average looks to be likely resistance.
Not surprisingly, Banks were bid with the cyclical/value stocks. The KBW index gained +3.9% and the smaller Regional Banks gained +5.75%. Both continue to trade along their 50-day moving averages as they have since early last week.
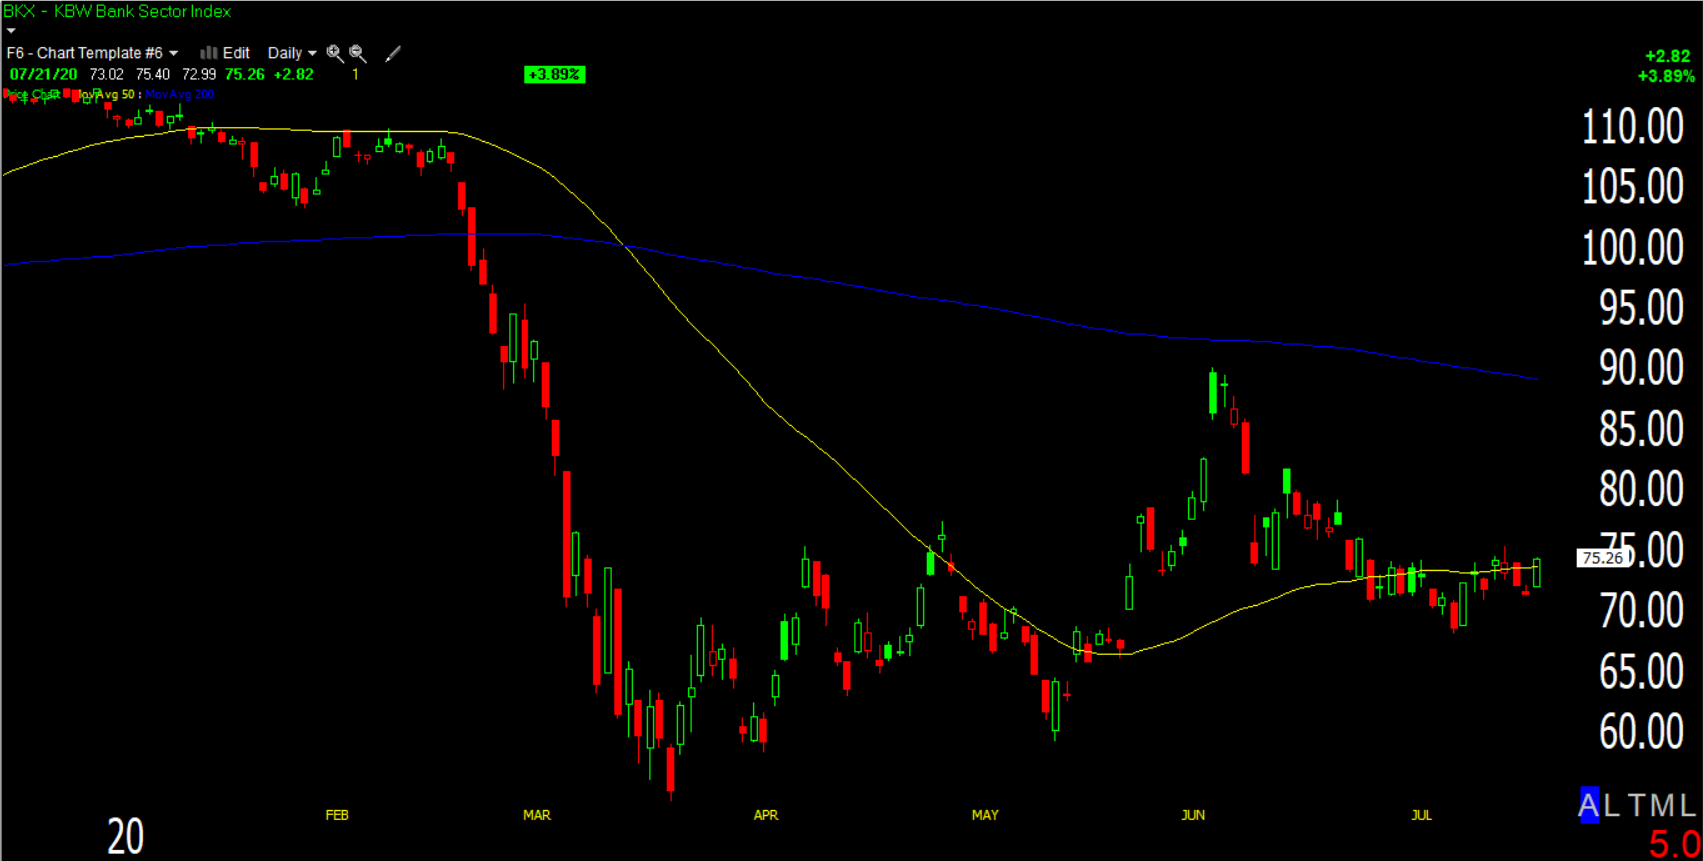
KBW Bank Index (daily).
The rotation to value/cylicals doesn’t look to be about a new emergent trend, but rather a risk management maneuver out of extremely highly valued stocks before they report earnings. The rotation keeps rotating, back and forth and looks a lot more like treading water and killing time than it looks like conviction in the economically sensitive and beaten up value stocks.
Volatility
Yesterday afternoon Volatility’s term structure started flattening, although not as sharply as the past two Monday’s. Each of the past two times came right before the market declined. Furthermore, NASDAQ’s volatility gauge showed realtive strength, indicating expectations for an increase in price volatility. This was what tipped the scale for me and I opened a QQQ short with weekly puts Monday afternoon. Sure enough NASDAQ/QQQ came down right from the open.
VXX started posting a leading positive 3C divergence yesterday, but VIX futures only improved margnially. Today VXX’s 3C continued leading price higher.
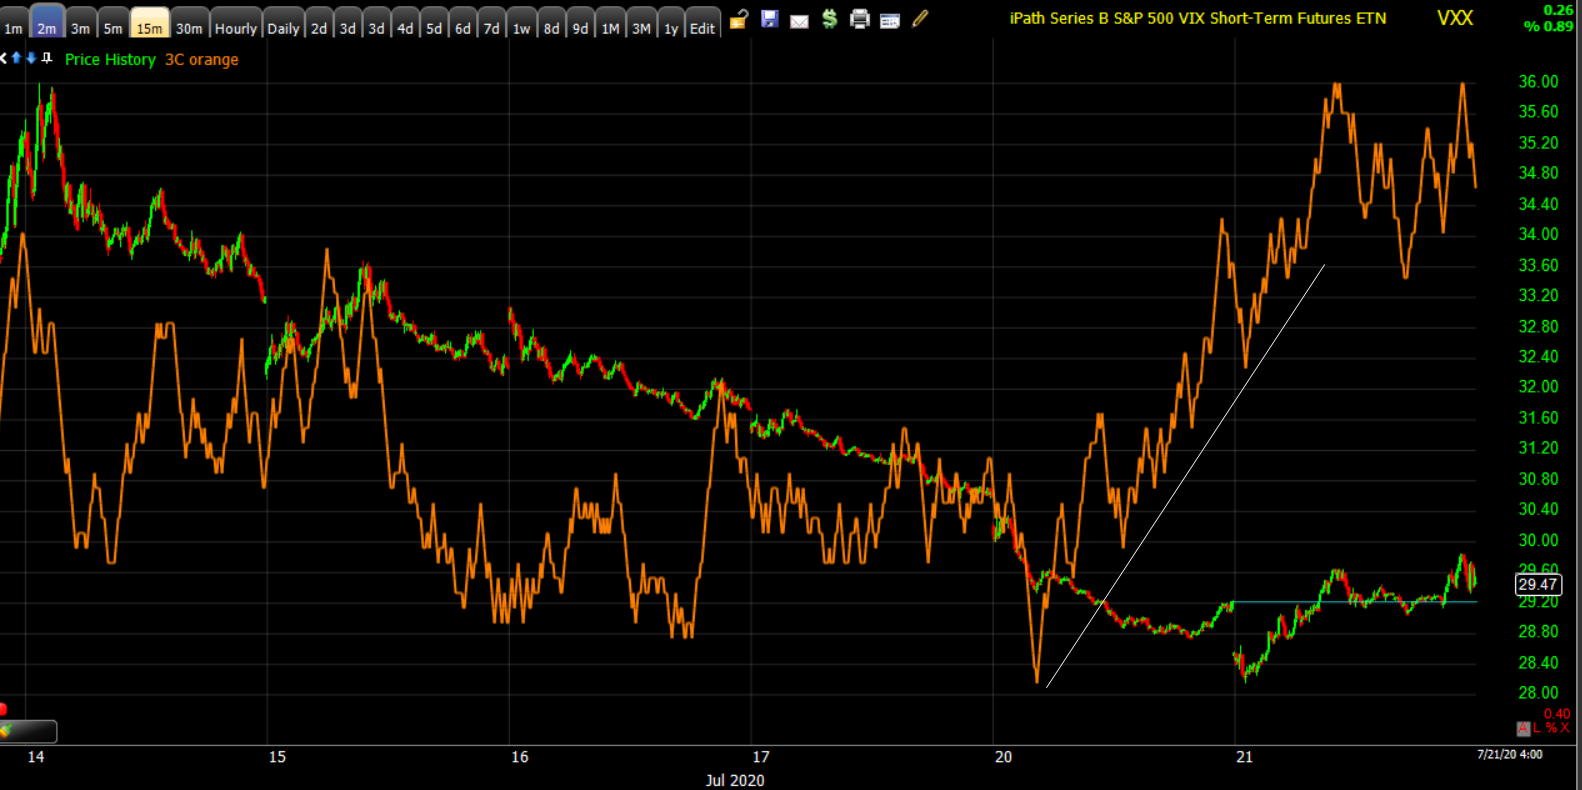 VXX (2m) leading positive
VIX futures saw some improvement on 3C, more than I’ve seen in more than a week, but still not enough to say with convition that a trend change is likely.
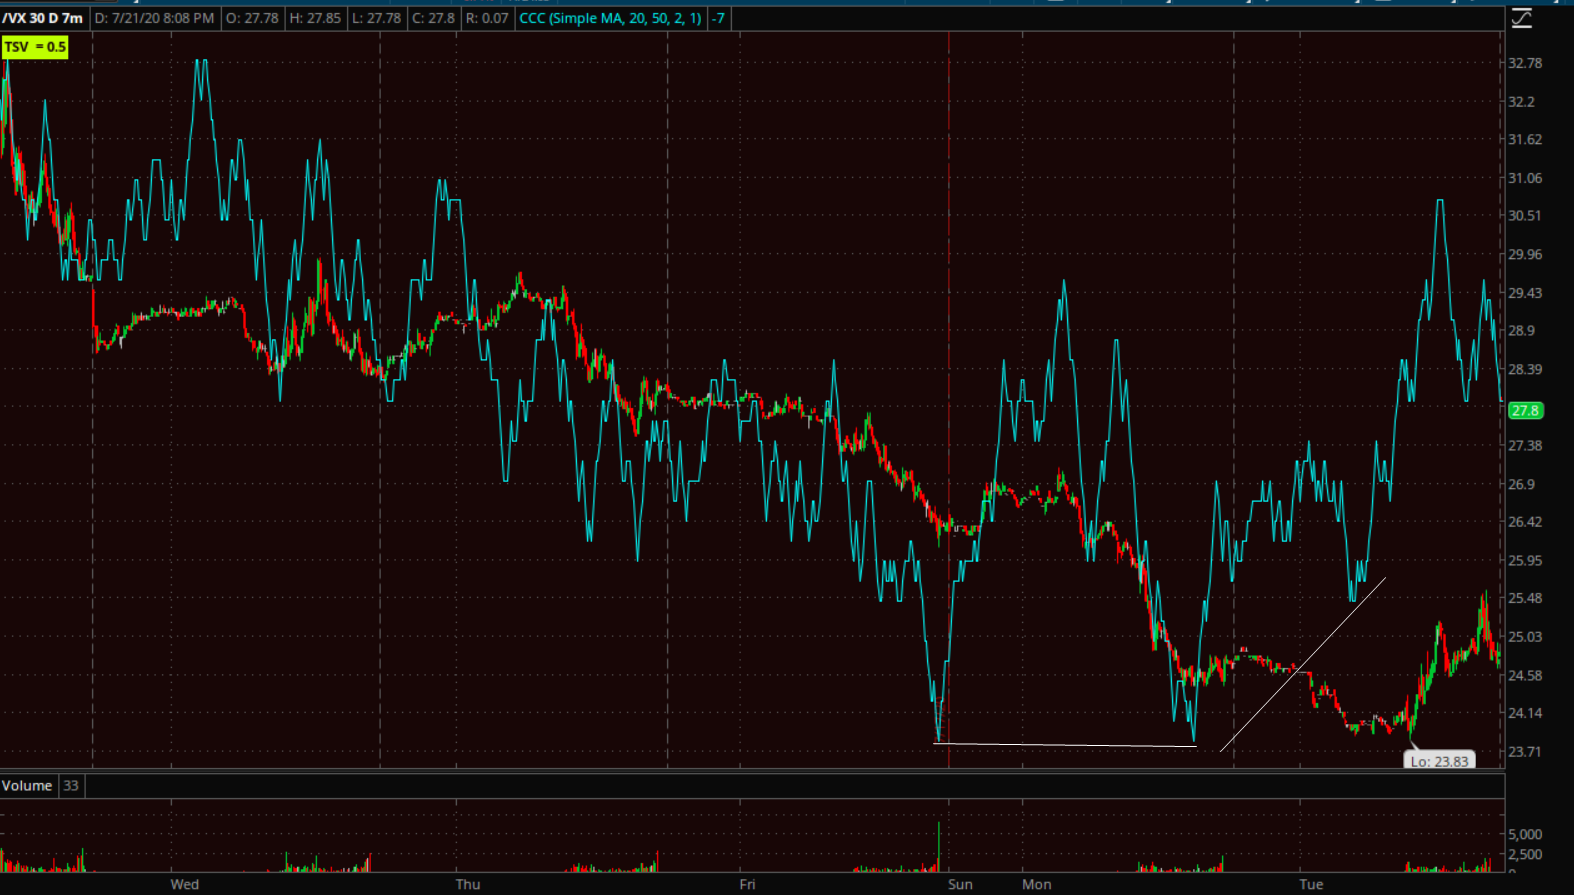
VIX futures (7m) with 3C putting in a realtive positive divergence yesterday and extending it today.
VIX showed minor relative price strength closing up +1.55% as S&P was still green. VIX futures/options roll over tomorrow. Over the past year or so these contract rolls have been minor inflection points for the market averages (up and down).
Internals
Internals were better today with many more stocks gaining, as compared to yesterday when just a handful of mega-caps advanced. NYSE Advancers (2249) outpaced Decliners (699) by better than a 3-to-1 ratio and on heavier volume of 898.3 mln shares, although still much lighter than average.
Although the NASDAQ closed down today, it’s breadth was better than yesterday when it closed at a record high. NASDAQ advancers were almost 2 to 1 over decliners, which just demonstates how concentrated and how much influence 5 or 6 mega-cap stocks have at the index level.
There is no Dominant price/volume relationship today and no 1-day overbought/oversold signals.
While internals were better today than yesterday, market breadth continues to deteriorate.
New NYSE 52 week lows were higher for the third day in a row.
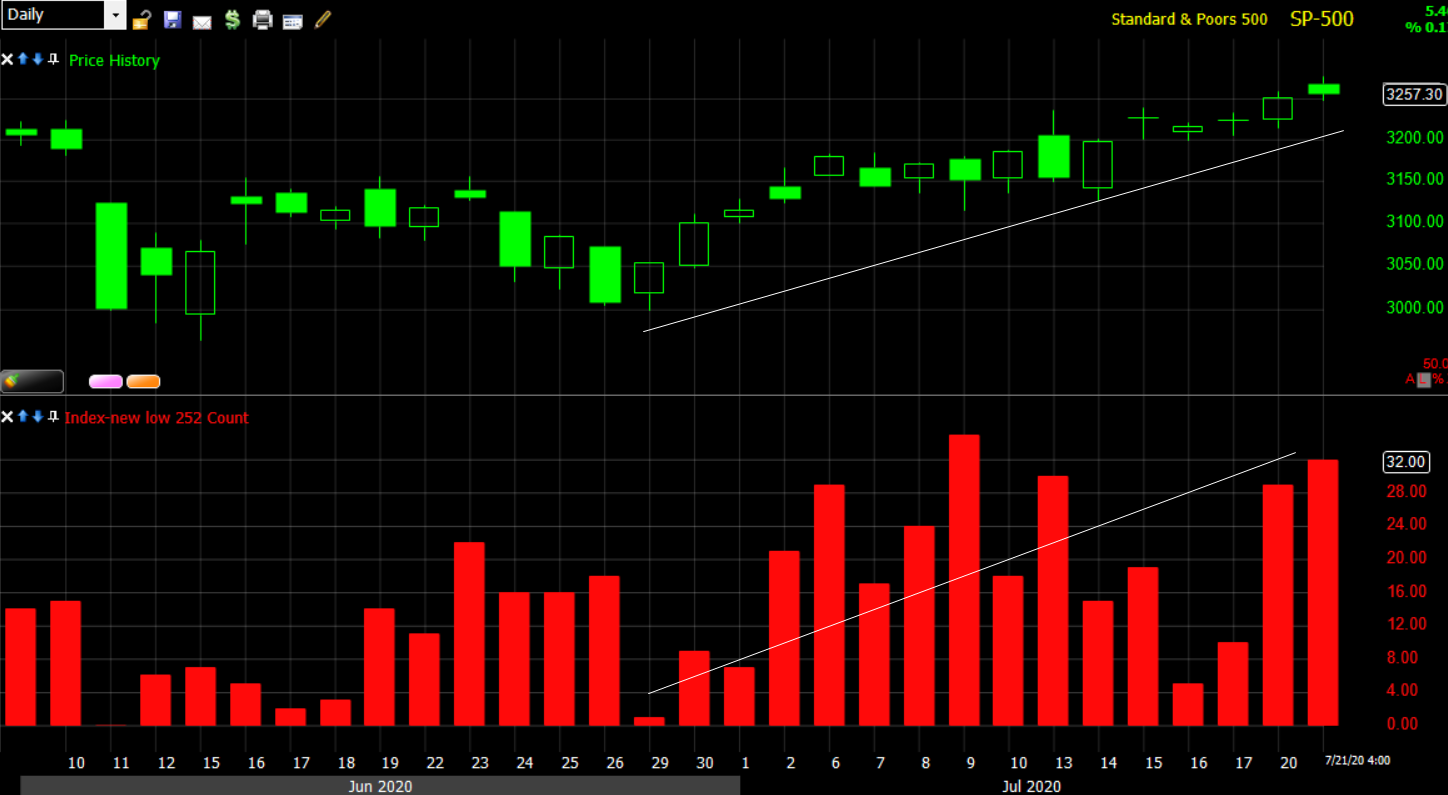
SP-500 (daily) and the count of NYSE New 52 Week Lows. The more troubling trend in breadth is the rise in new 52 week lows as the S&P has advanced over 8% off the late June low. This should never happen in a healthy market advance.
Treasuries
U.S. Treasuries finished the day higher, sending yields lower. The 2-year yield declined one basis point to 0.14%, and the 10-year yield declined one basis point to 0.61%. The 10-year briefly traded below its week-plus consoldiation-1) not confirming the reflationary like gains in Energy or banks, and 2) nearly sending a risk off signal.
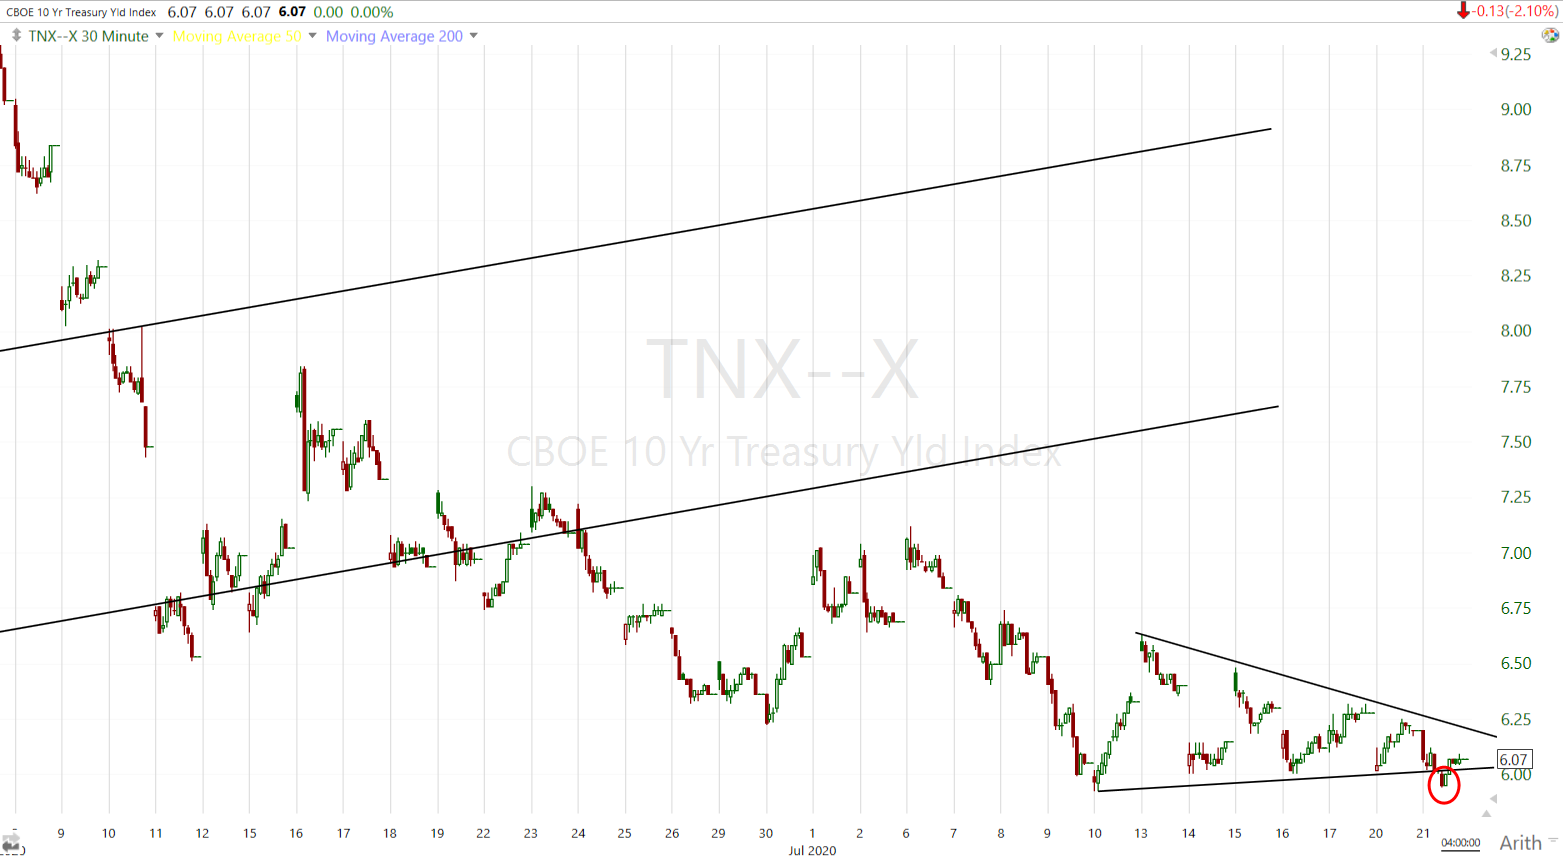 10-year yield (30m)
With banks gaining today, the bank short trade idea is still on my radar. The 10-year yield breaking below the consolidaiton would be one trigger. The yield curve flattening below its similar consolidation would be another. Ideally both would occur while Banks are up.
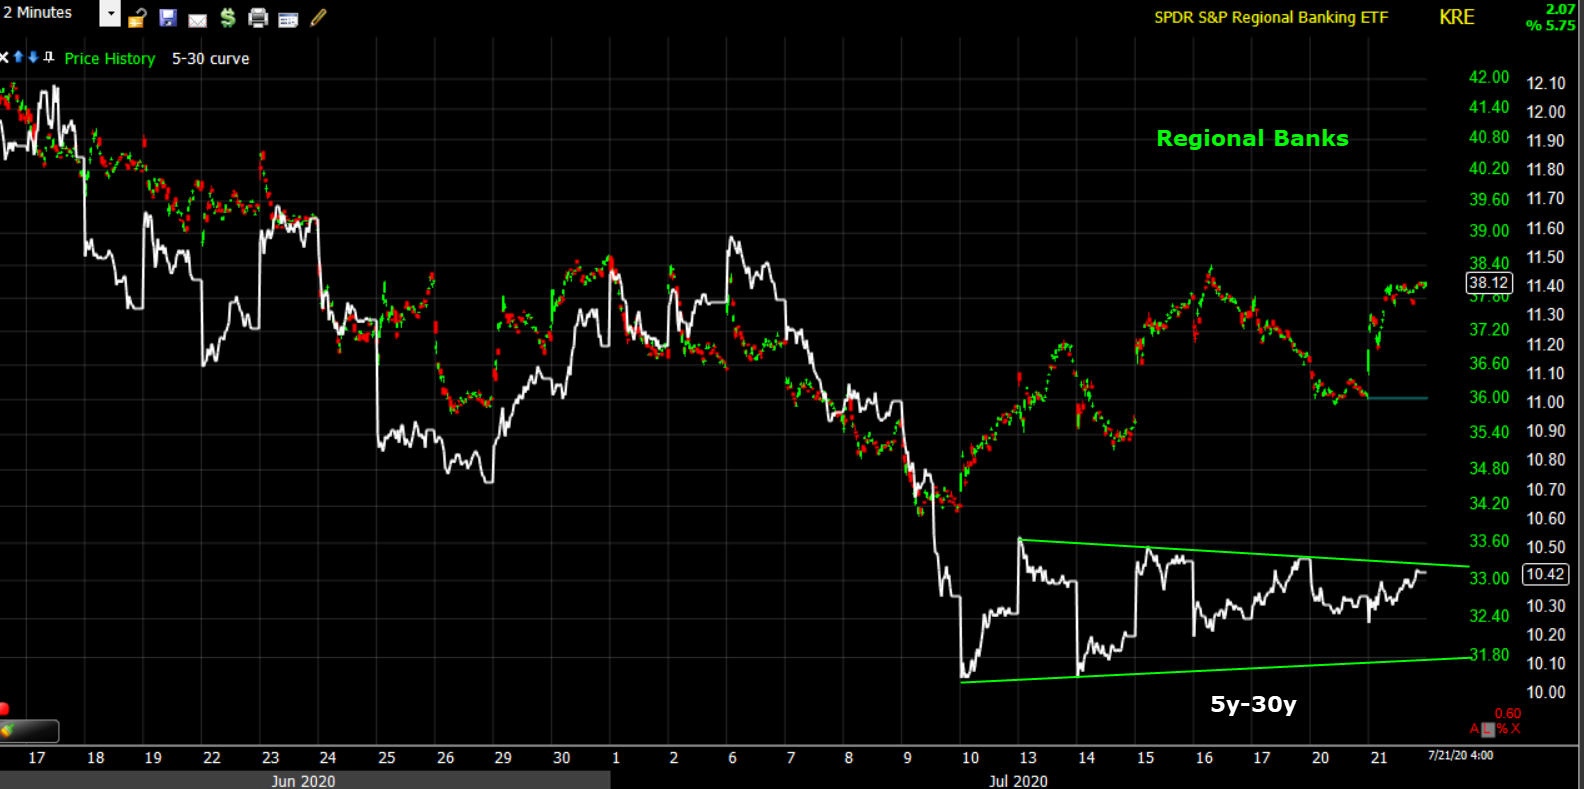
Regional Banks (2m) and the 5 year / 30-year spread. Yesterday banks started catching down toward the negatively divergent curve. Today banks were bid with other value and cyclical sectors, which i fine with me as it relates to the potential trade. I always want to sell strength, not chase prices lower.
Currencies and Commodities
The U.S. Dollar Index fell sharply by -0.7% to 95.20.
The Aussie gained (risk-on, positive for commodities), and the Yen gained (risk-off).
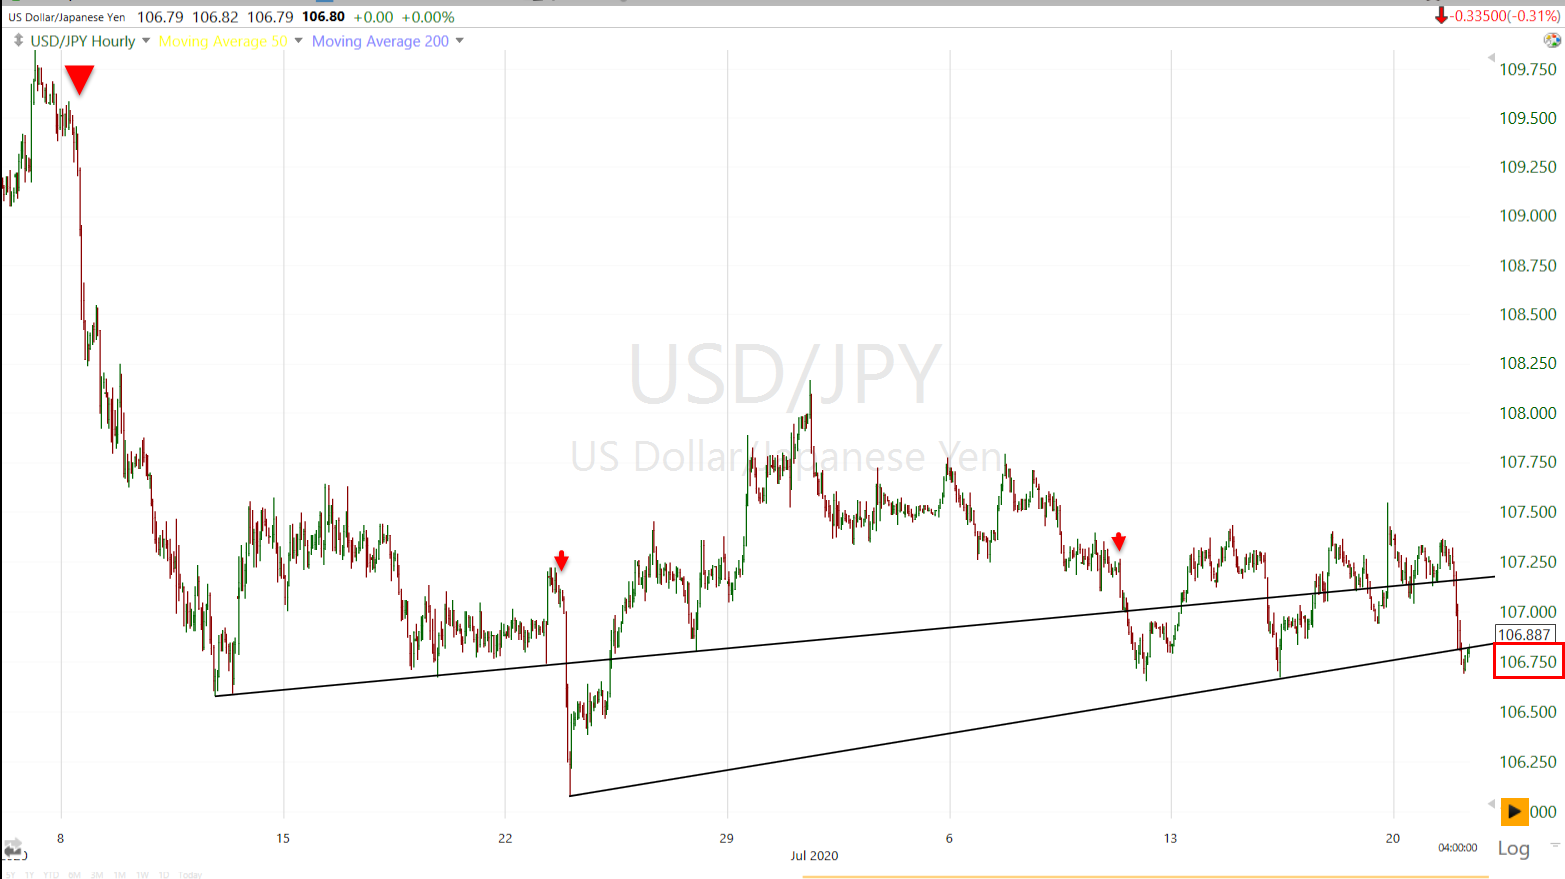
USD/JPY (60m) each of the red arrows was a risk-off signal that led the market lower by 1 to 3 days. The first (far left) came after the early June payrolls and led S&P -8% lower. The next led the S&P almost -5% lower over the next few days, and the one to the right was a day before the sharp Key Reversal Day in the NASDAQ. I’ve drawn in a new trend line that comes in around $106.75, which was breifly broken today.
WTI crude gained +2.3% to $41.76/bbl. , but couldn’t hold above $42. There’s a large zone of overhead supply right in the area. Crude has been lingering just below since early June and I’ve stayed away from trades in crude until it trades up to $42.
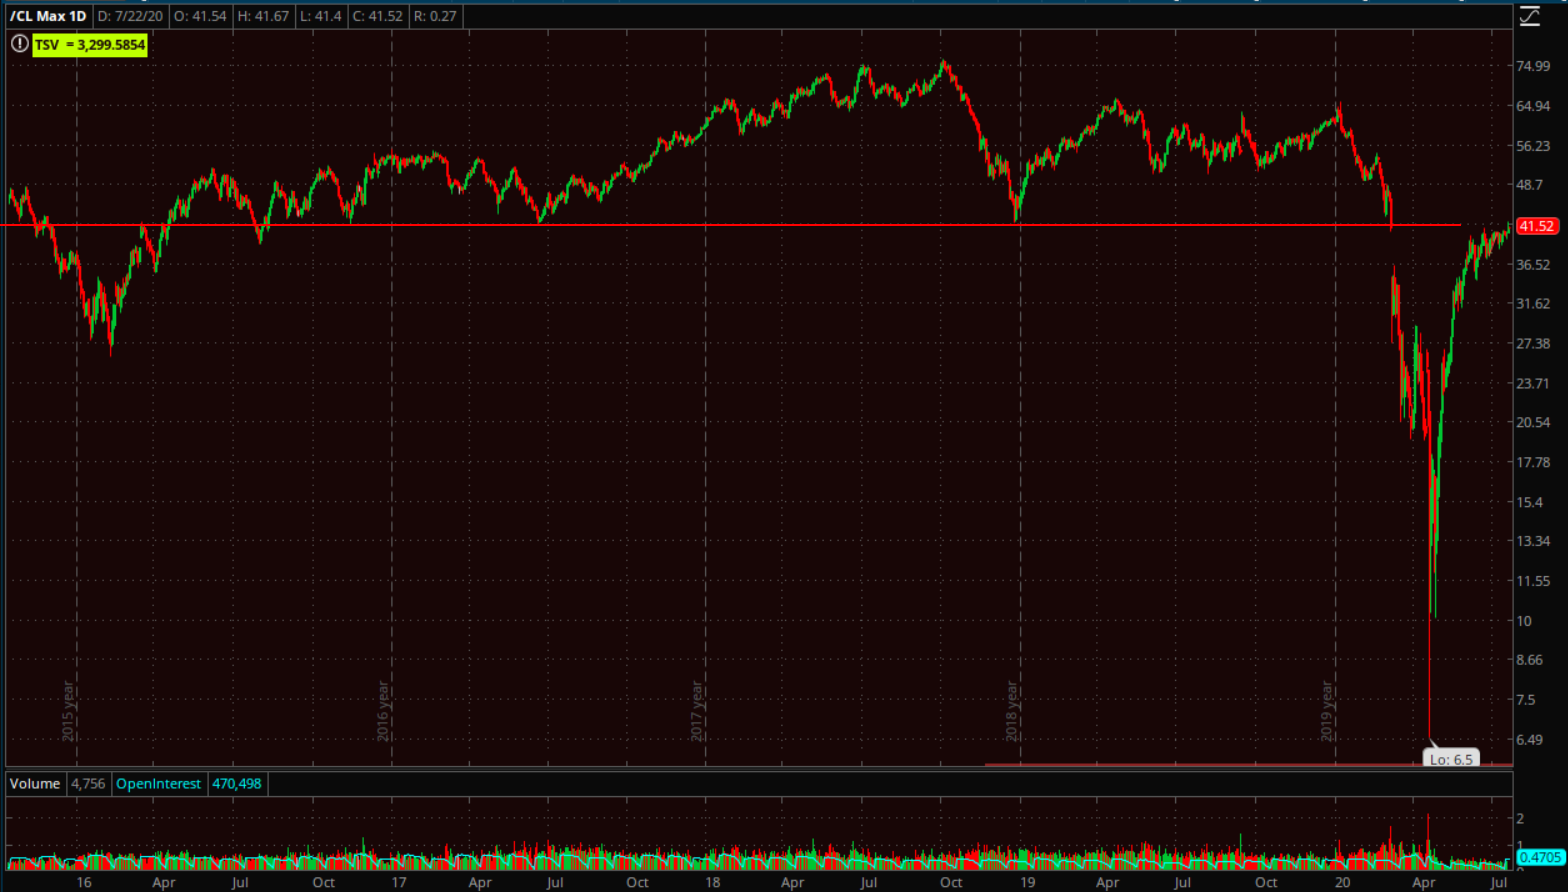
WTI Crude futures (daily) the red trend line is the $42 area. I’ve expected prices to trade up into the gap, but I also suspect the overhead supply will be resitance. At least now we’re filling the gap.
Gold futures settled $26.50 higher or +1.5% to $1,843.90/oz, helped in part by weakness in the greenback. I haven’t been able to get a great measured move target for gold, I’ve been expecting this leg to reach $1840-$1850, gold hit the midpoint today.
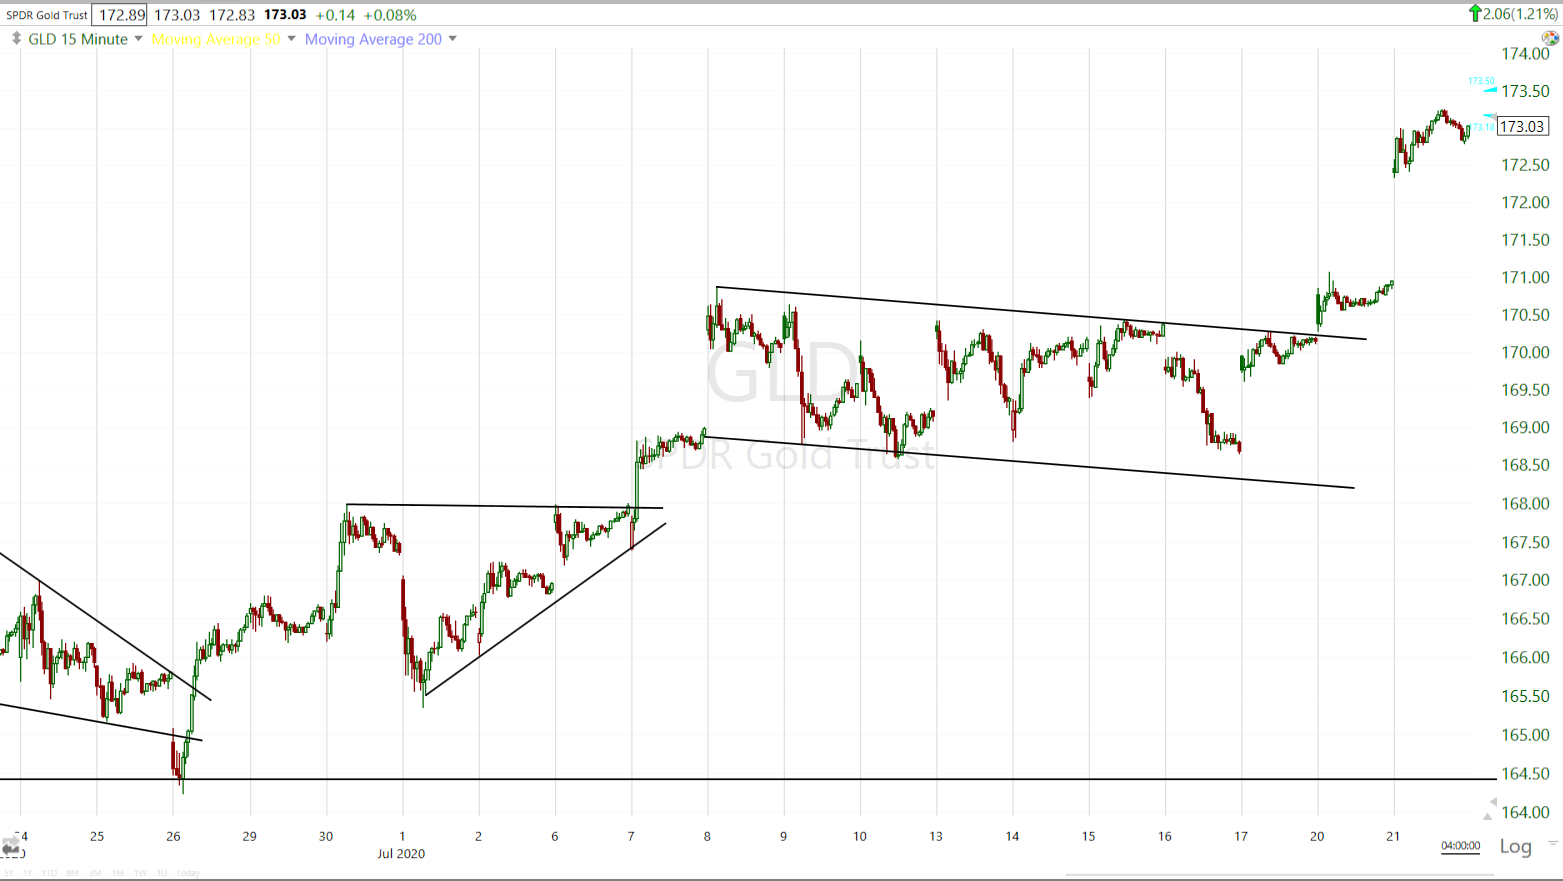 GLD (15m) gold miners led Gold’s breakout from the bullish flag. Today gold’s upside momentum caught up to miners leaving a big gap on GLD’s price chart. There was nothing wrong with the price action this afternoon so I left the GDX long position in place. The call options are August 21st so I have time to wait out a consolidaiton, but with nearly a 300% gain, if I see something I don’t like, or I think a consoldiaiton will be longer than a week or so, I’ll closeout the position and look to re-enter and extend the trade’s duration.
GDX/Gold miners (+1.3%) tagged the near-term upside target on the nose.
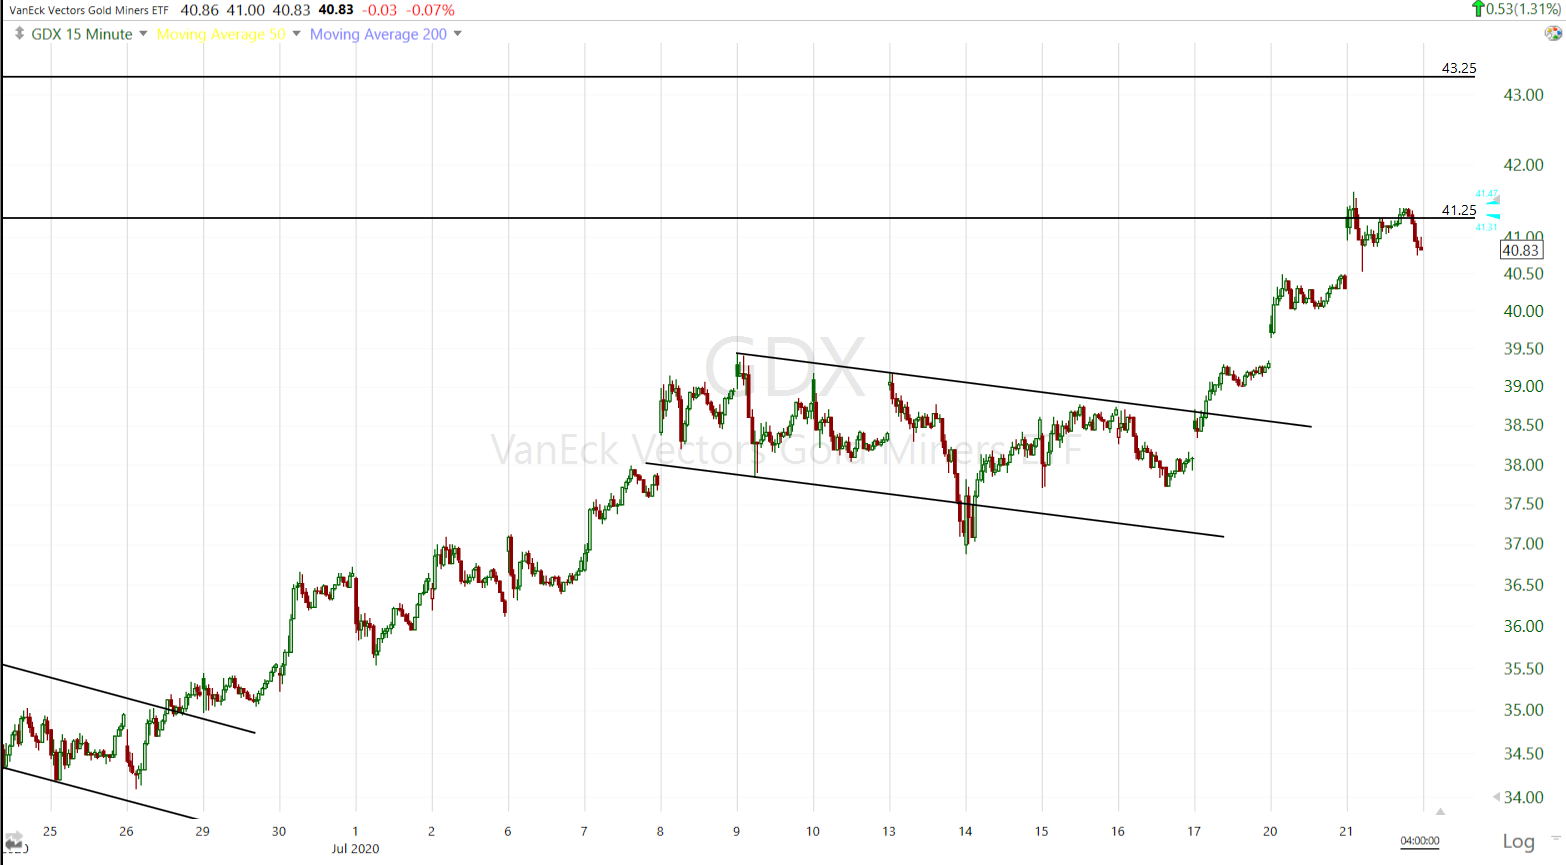
GDX (15m) hit the $41.25 near term target. The final leg’s target is around $43.25. I wouldn’t be surprised to see prices take a break here and consolidate before reaching that target.
GBTC (Grayscale Bitcoin Trust) had a pretty decent day too, up +4.8%.
Summary
I left the QQQ weekly puts in place, I’m looking for a move down to $261. The mega-cap Tech stocks start reporting earnings later this week.
In the meantime the rotation from last week into value/cyclicals seems more like treading water than conviction in the style factor, which would require economic growth. Early last week when the rotation first appeared, the bond market didn’t confirm and it is still not confirming.
There were quite a few contrasting signals today and some were very near levels that I consider to be important (i.e. the 10-year yield below 0.59% or USD/JPY below $106.75). I’m hoping that these signals will get on the same page and offer more clairty, either way.
Overnight
S&P futures are +0.2%. Both Dow and Russell 2000 futures are showing slightly better relative performance, and NASDAQ 100 futures slightly worse, like this morning. NASDAQ futures’ 3C is leading lower since the close into the overnight session, the rest are uneventful.
NASDAQ 100 futures (2m)
WTI Crude futures are down -1%.
Gold futures are up +1%.
Silver futures are ripping higher, adding another +6.5% tonight.
Treasury futures are pretty steady in a consolidation.
As for currency futures, the safe-haven Yen and Swiss Franc are looking pretty good so we’ll want to watch USD/JPY and the risk-off signal below $106.75.
There’s not much U.S. economic data this week. Wednesday we will receive a trio of housing data: Existing Home Sales for June, the FHFA Housing Price Index for July, and the weekly MBA Mortgage Applications Index. Also the EIA crude oil inventory report is due Wednesday.
U.S. weekly jobless claims come out on Thursday.
Quarterly earnings gather steam the rest of the week, with reports due from Microsoft, Blackstone Group, Roche, Intel, Unilever, Canadian Pacific, Tokyo Steel, Daimler, Hyundai and Mattel.