Stock Market Daily Wrap – I’m Concerned
****It’s been an interesting week. There are a few things in tonight’s daily member/subscriber post, the Daily Wrap, that have me concerned. I felt that if there was ever a time to share a subscriber post, it’s today. Make sure to read the “Treasury” section below.
If you are interested in checking out and subscribing to my analysis and forecasts, there’s less than a week left to subscribe at my 2008 rates and be grandfathered in at those rates, before we move to the new website, The Technical Take, which we’re all very excited about given the new features and Discord room for subscribers. Enjoy the post!
The stock market experienced some choppiness in the early going, but quickly found some upside momentum following yesterday’s afternoon bounce.
The market has been in desperate need of a pause in the advance of Treasury yields — particularly on the long end since last week’s FOMC — to get any upside traction in equity prices, which I came into the week looking for in terms of a tactical short entries related to the H&S tops that are fully formed and confirmed. Between the Fed, sharply rising Crude oil prices, and lord knows whatever else that’s reflected on the 10 and 30-year yield’s bullish price charts, we haven’t seen much of that this week until today.
What changed? Well it may be as simple as just a bounce in Treasuries, but the economic data, a dovish regional Fed President, and crude prices were helpful.
Germany’s Consumer Price Index (inflation) tumbled. GDP was revised modestly lower, but the big surprise was the downward revision to Personal Consumption, depicting a much weaker consumer. Personal Consumption fell to 0.8% far short of market consensus of 1.7%.
Then the latest data to show a slowing Real Estate market with Pending home sales falling sharply by -7.1% MoM in August, which was much worse than the -1.0% expected decline, which dragged sales down to -18.8% on a year over year basis.
Yesterday’s VIX also suggested something was changing (lower volatility usually equals higher stock prices) as VIX stalled above its 200-day with an inverted bearish hammer candlestick, which was also an inside day (typical of a reversal day) around the 200-day where VIX has struggled to gain any additional upside traction.
And then there’s sentiment getting a little too pessimistic near term. As mentioned earlier in the week, this is a blunt tool, but at sentiment extremes, it tends to be a high probability contrarian signal.
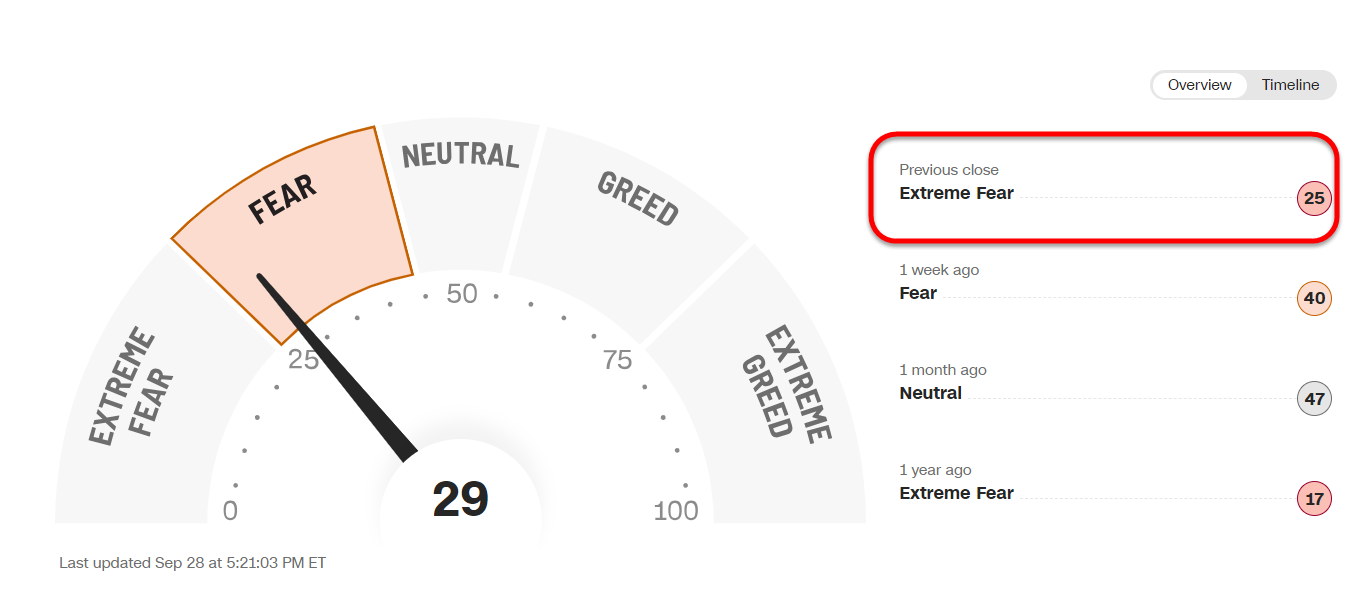 CNN Fear and Greed Index at Extreme Fear yesterday.
As I’ve been saying for a while, for the equity market and especially the influential mega-caps to gain a toe-hold and any upside, yields are going to have to come down and that’s EXACTLY what happened today.
 Remember that yields move inversely to Treasury prices.
In a rare dovish comment, Federal Reserve Bank of Chicago President Austan Goolsbee warned of the risk of the Fed making a policy error, that credit tightening is under way and recession is a possibility. “Believing too strongly in the inevitability of a large trade-off between inflation and unemployment comes with the serious risk of a near-term policy error,“ Goolsbee said.
Goolsbee’s remarks were a critique of the “traditionalist view” at the Fed that slowing inflation requires significant economic pain in the form of rising unemployment, slowed growth, and recession. This aligns well with what I’ve been saying for almost 2 years, that the Fed will induce an economic recession to defeat inflation.
Averages
Small Caps and NASDAQ-100 were the best performing averages of the day. Recall yesterday morning I noticed an unusual positive divergence in QQQ on 3C that I couldn’t explain? The only thing I could think of to explain it was what I said in yesterday’s Daily Wrap,
“perhaps tomorrow’s GDP print was leaked”
While the headline GDP print wouldn’t have raised too many eyebrows, the shocking detioration of the consumer (Personal Consumption data in the GDP revision), certainly would. This could be seen in the market’s initial reaction to the headline print, and then a worsening outlook (falling yields) as humans actually rad what was in the GDP revision – a dramatically weaker consumer than had been previously thought.
Dow Industrials were the laggard, but the Dow Transports (+1.1%) that tend to lead the DJIA, outperformed everything.
S&P-500 ⇧ 0.60 %
NASDAQ ⇧ 0.84 %
DOW JONES ⇧ 0.35 %
RUSSELL 2000 ⇧ 0.87 %
The averages didn’t change any short term price trends from down, but a few look like they’re putting in small bases for the kind of tactical bounce I came in to the week looking for around the broken H&S top neck lines.
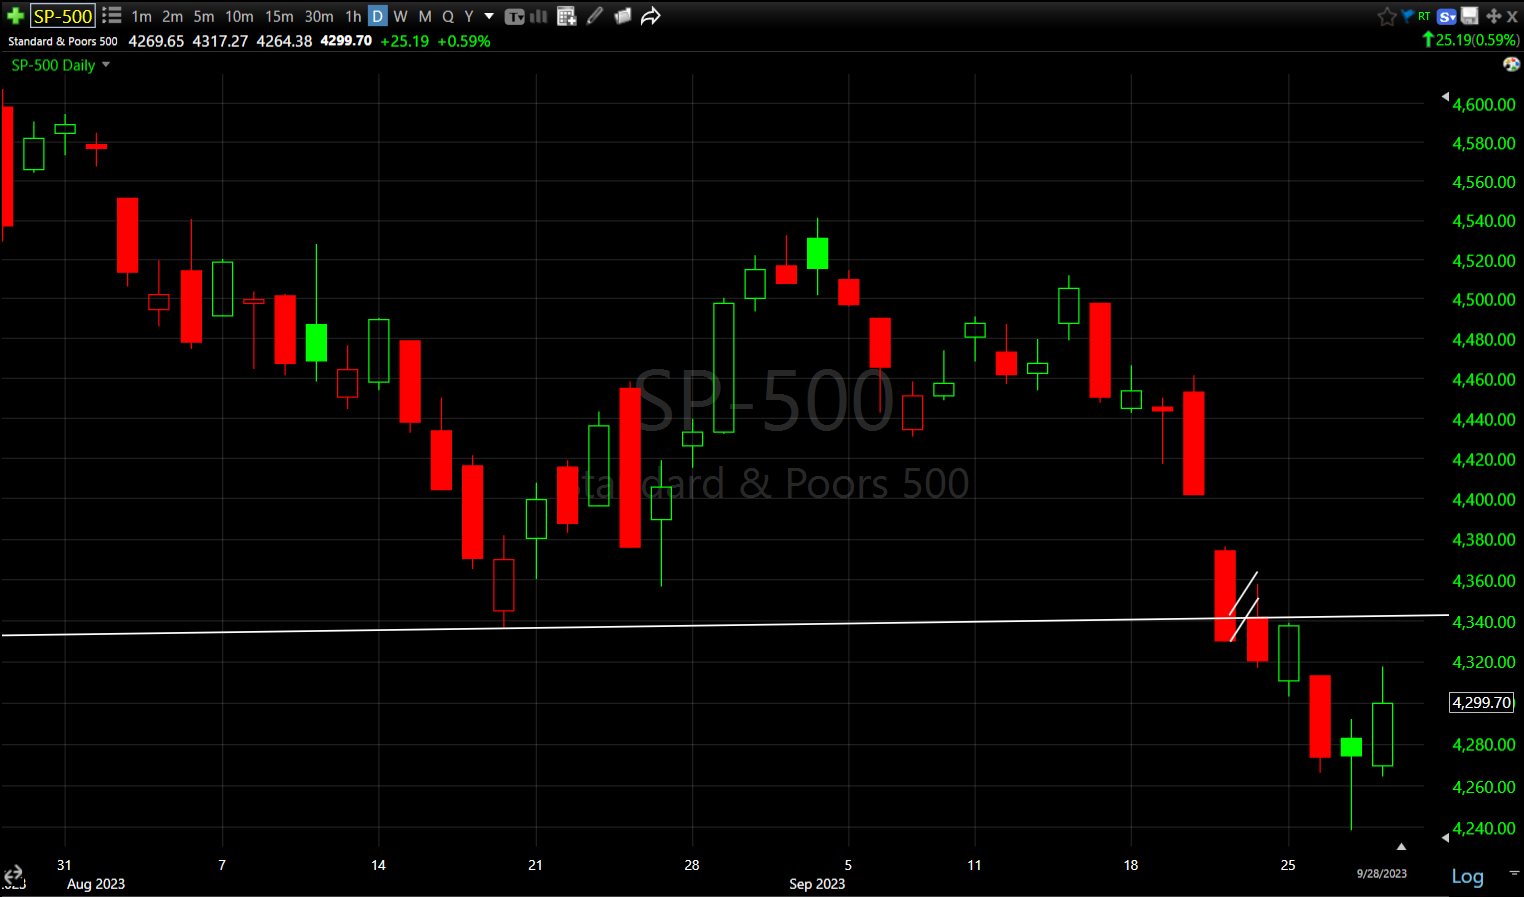
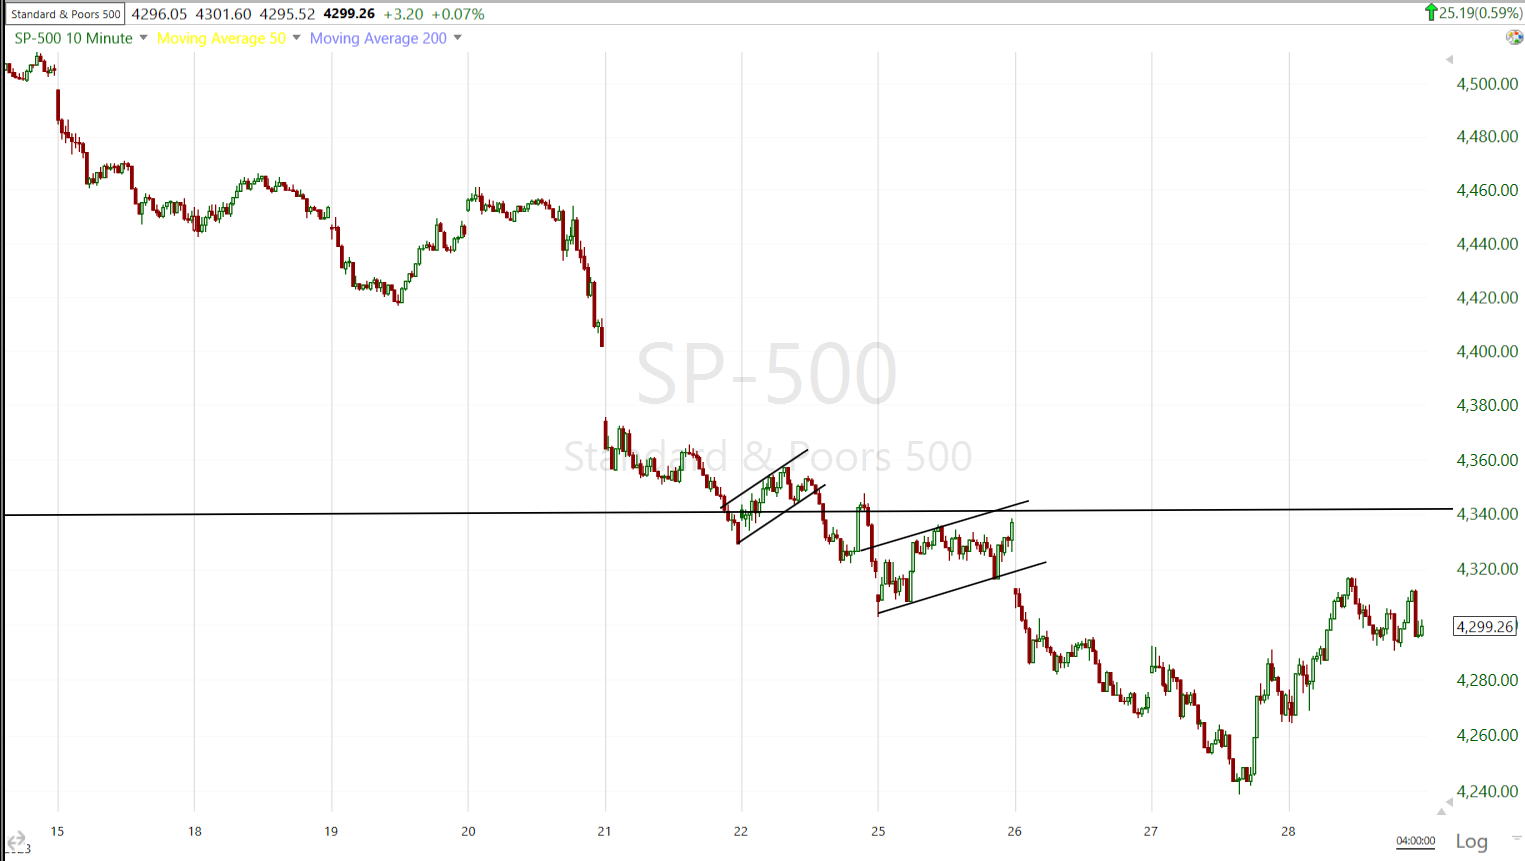 SP-500 (10m) closed a whisker short of $3400 and as you can see, hasn’t changed the short term down trend.
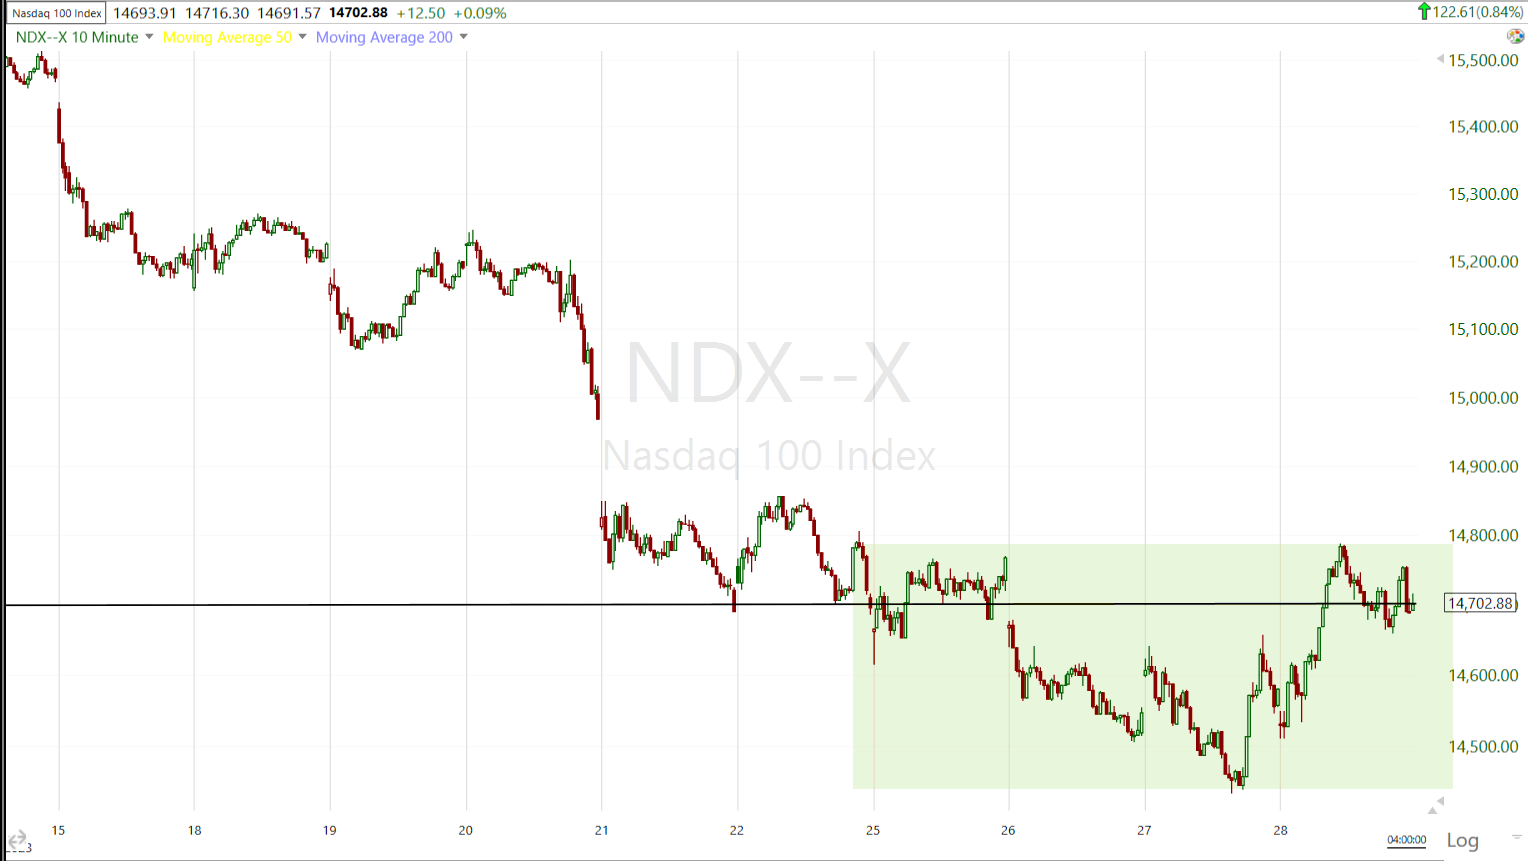 NASDAQ-100 (10m) though, looks a bit more like a short term base forming in the area of its neck line, which is where I’ve been saying for a month or so, “should act as a speed bump” for prices that were declining from the head and right shoulder of the Head and Shoulder tops.
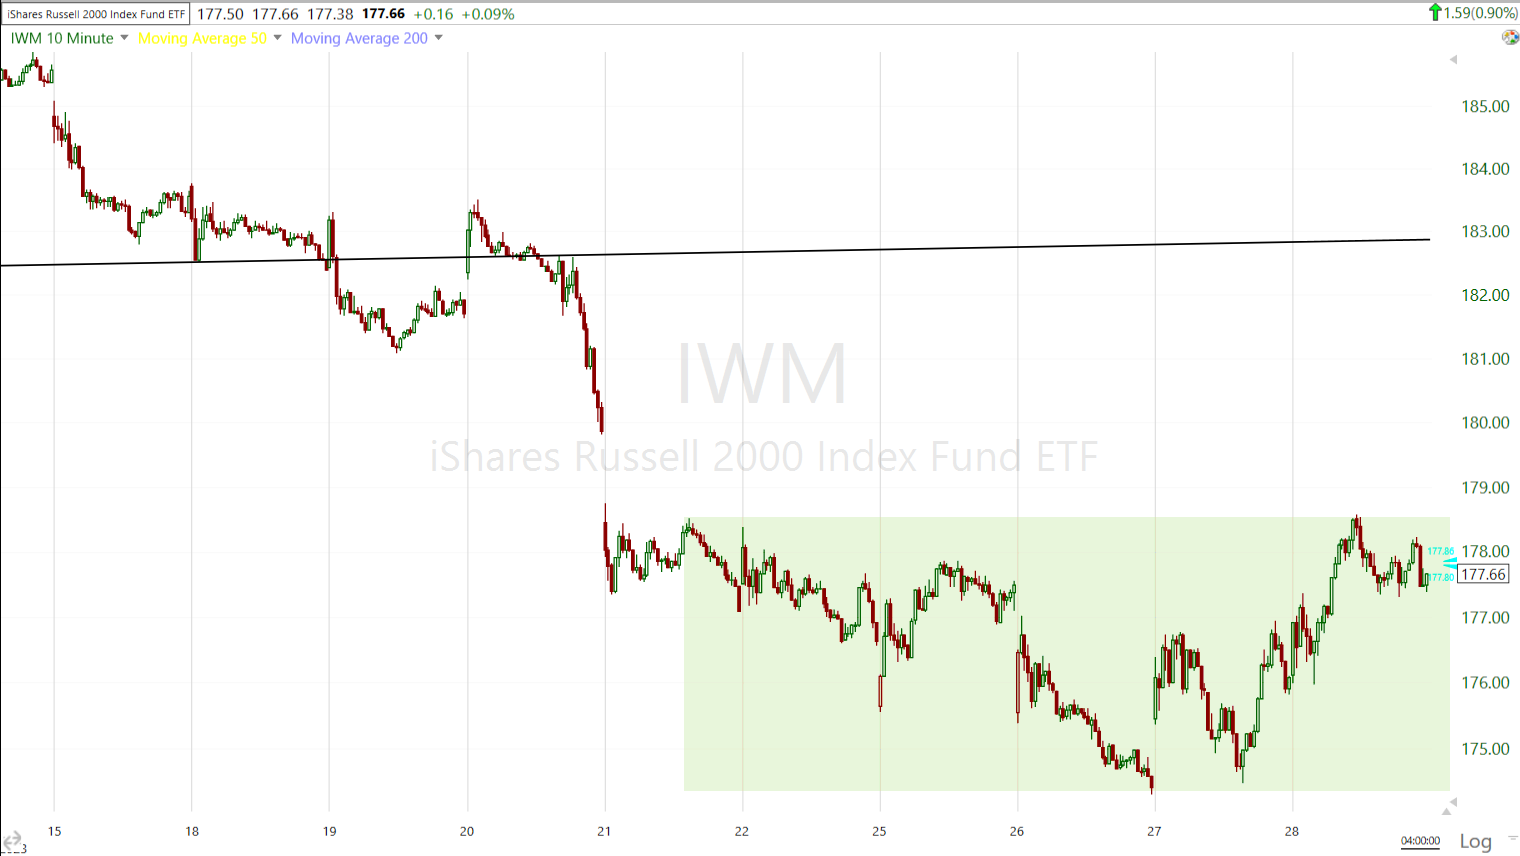 Small CAP IWM (10m), not coincidentally, the best performing on the day with the NASDAQ-100, has a similar small base-like pattern forming here, although it’s further below its neck line (above) than NASDAQ which is at it.
As written in the Afternoon Update,
“watch the close. If we get a close near session highs, which we are not at presently, then I’d look for more upside tomorrow. If off session highs, then a probability of the consolidations (bull flags intraday) extending and enlarging. Neither scenario hurts the tactical game playing so I’m not too concerned either way.”
 SP-500 (daily) we got a nice solid bullish reversal signal with yesterday’s Hammer candlestick, but today closed off session highs, which suggests to me a probability that some bullish flag consolidations seen in all of the averages this afternoon…
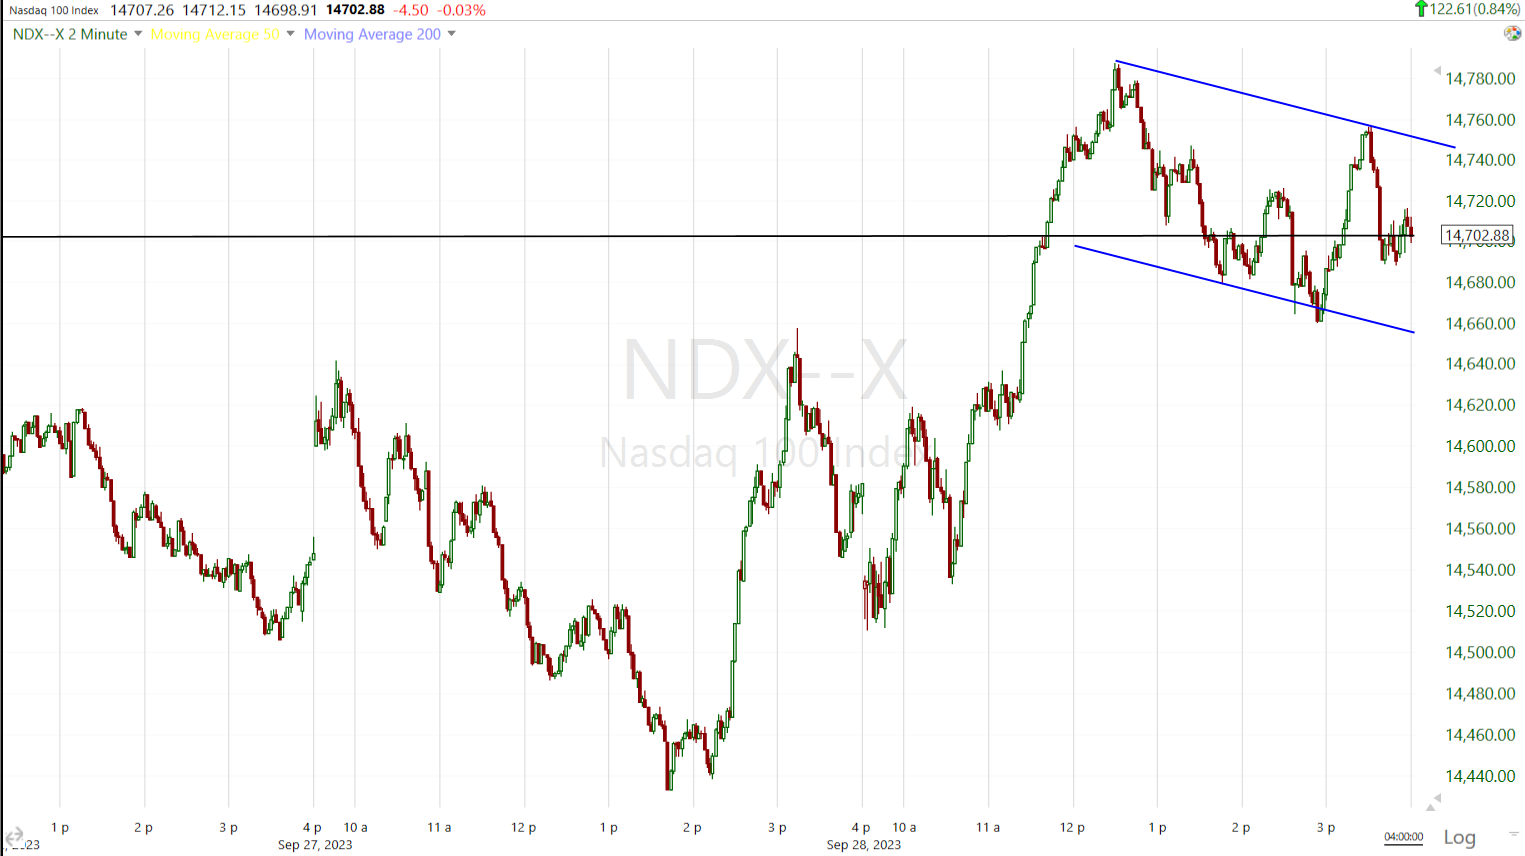
NASDAQ-100 (2m) closer view shows a bull flag starting to develop this afternoon
…that these bullish flags have a high probability of continuing into tomorrow and becoming larger.
The 3C charts today were less interesting than yesterday when QQQ put in an odd positive divgernece despite yields rising. this tells me that the bullish conviction here is still not very high, but as I often say, “A day is not a trend” and I do think that we’ll have to see some further evidence of yields coming down more in the near term to support a decent oversold bounce from here. That bounce is what I hope to see to use as a tactical short entry given the larger H&S top patterns in place and confirmed.
I didn’t see the short covering in my Most Shorted Index that I’ve seen the two prior mornings, but the shorts did step in and start covering from 11:30 a.m. to 12:30 p.m. and as their covering ended, the market averages entered bullish intraday consolidations.
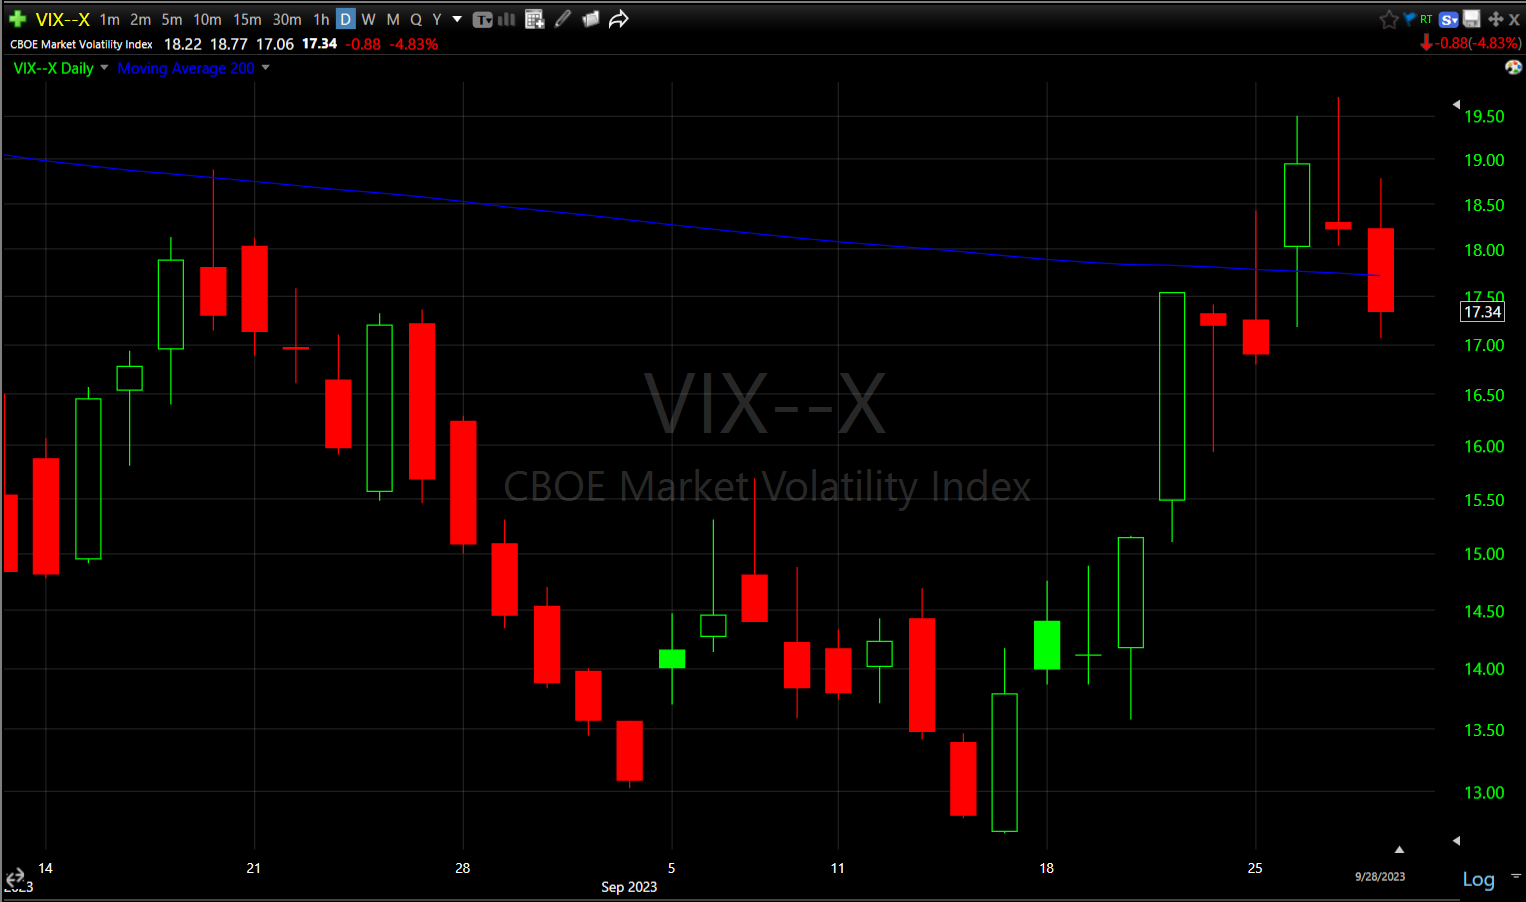 VIX (daily) -4.85% and displaying some modest relative weakness this afternoon as the major averages went in to bullish flag consolidations intraday. That doesn’t tell us much except that VIX is not contradicting the afternoon bullish leaning price consolidations.
The Absolut Breadth Index ended lower at 31.
S&P sectors
10 of 11 sectors closed higher, which is typical of a rebound from oversold conditions. Sector bias remained mixed with the mega-cap heavy Communications and Consumer Discretionary sectors at the top of the leaderboard, along with the lightly weighted, cyclical Materials sector, and the bond proxy Real Estate sector. Once again, the counter-cyclical Utilities sector was at the bottom of the leaderboard which smells like some clear quarter end window dressing and rebalancing with Friday being the end of the quarter.
Some mega caps had been trading down in the early going, limiting index performance. Apple (AAPL +0.2%) and Microsoft (MSFT +0.3%) were among the influential laggards, down -1.7% and -1.1%, respectively, at their lows of the day. They would rebound as would other mega cap stocks as yields continued lower. The Mega Caps(MGK +0.6%) traded in line with the S&P Equal Weight Index (+0.65%).
However, for the second day, Semiconductors (SOX Index +1.77%) put in massive outperformance over the Tech sector which they tend to lead. In fact, the Semis, which already broke the neck line of a complex H&S top, are trading just above the neck line as of today’s close, potentially setting up that weak rally above the neck line at the end of a completed H&S that’s so appealing as a short entry (see chart of SOX below).
Another of the recent major laggards that also broke a H&S top’s neck line, the Retail sector (+1.85%) outperformed today in what is clearly an oversold rebound because the GDP report today certainly wasn’t behind the relative strength in the group.
Regional Banks (+1%) did fairly well too. I’ll have more to say on them in the Treasury section below.
Materials ⇧ 1.08 %
Energy ⇧ 0.11 %
Financials ⇧ 0.72 %
Industrial ⇧ 0.42 %
Technology ⇧ 0.71 %
Consumer Staples ⇧ 0.31 %
Utilities ⇩ -2.16 %
Health Care ⇧ 0.48 %
Consumer Discretionary ⇧ 1.12 %
Real Estate ⇧ 1.04 %
Communications ⇧ 1.10 %
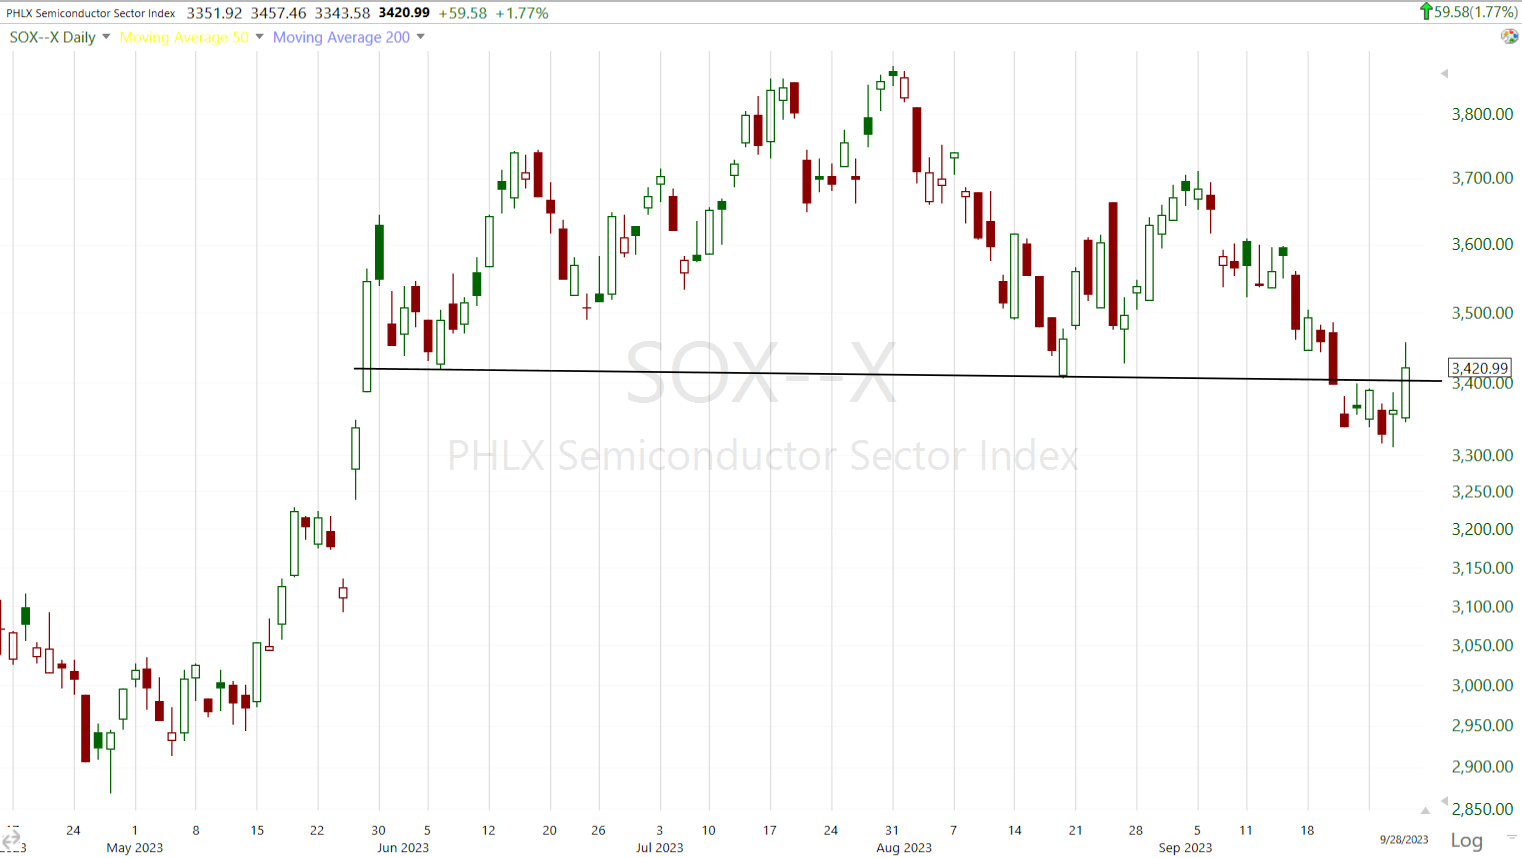 SOX (daily). Among the semiconductors SOX Index, Micron (MU -4.4%) was the only component to close in the red, trading down after its earnings report.
Internals
Market breadth showed advancers (1937) outpacing decliners (900) by a better than 2-to-1 margin at the NYSE and by a roughly 13-to-8 margin at the NASDAQ Composite. Volume at the NYSE came in slightly lower at 907 mln shares.
The Dominant price/volume relationship of the component stocks making up each of the major averages was definitely dominant at Close Up/Volume Down, which is the most suspect relationship and not surprising at all considering we’re getting a little correction/consolidation after H&S neck lines have broken in all of the major averages.
S&P sectors and NYSE internals both leaned strong, but the dominant price/volume relationship tells us that strength wasn’t so strong and leaves the market with 1-day overbought internals. That doesn’t necessarily mean that markets fall tomorrow, but it’s perfectly consistent with the idea in the Afternoon Update that the afternoon flag consolidations continue into tomorrow.
We’re finally out of the extreme deep oversold breadth oscillators levels that have hit levels of below 1 to 3 numerous times this week, and ended at 22, today which is still moderately oversold (scale 0 to 100).
Some breadth indicators showed modest progress as we move into the end of the week/month/quarter, but none are jumping off the charts with strong bullish signals.
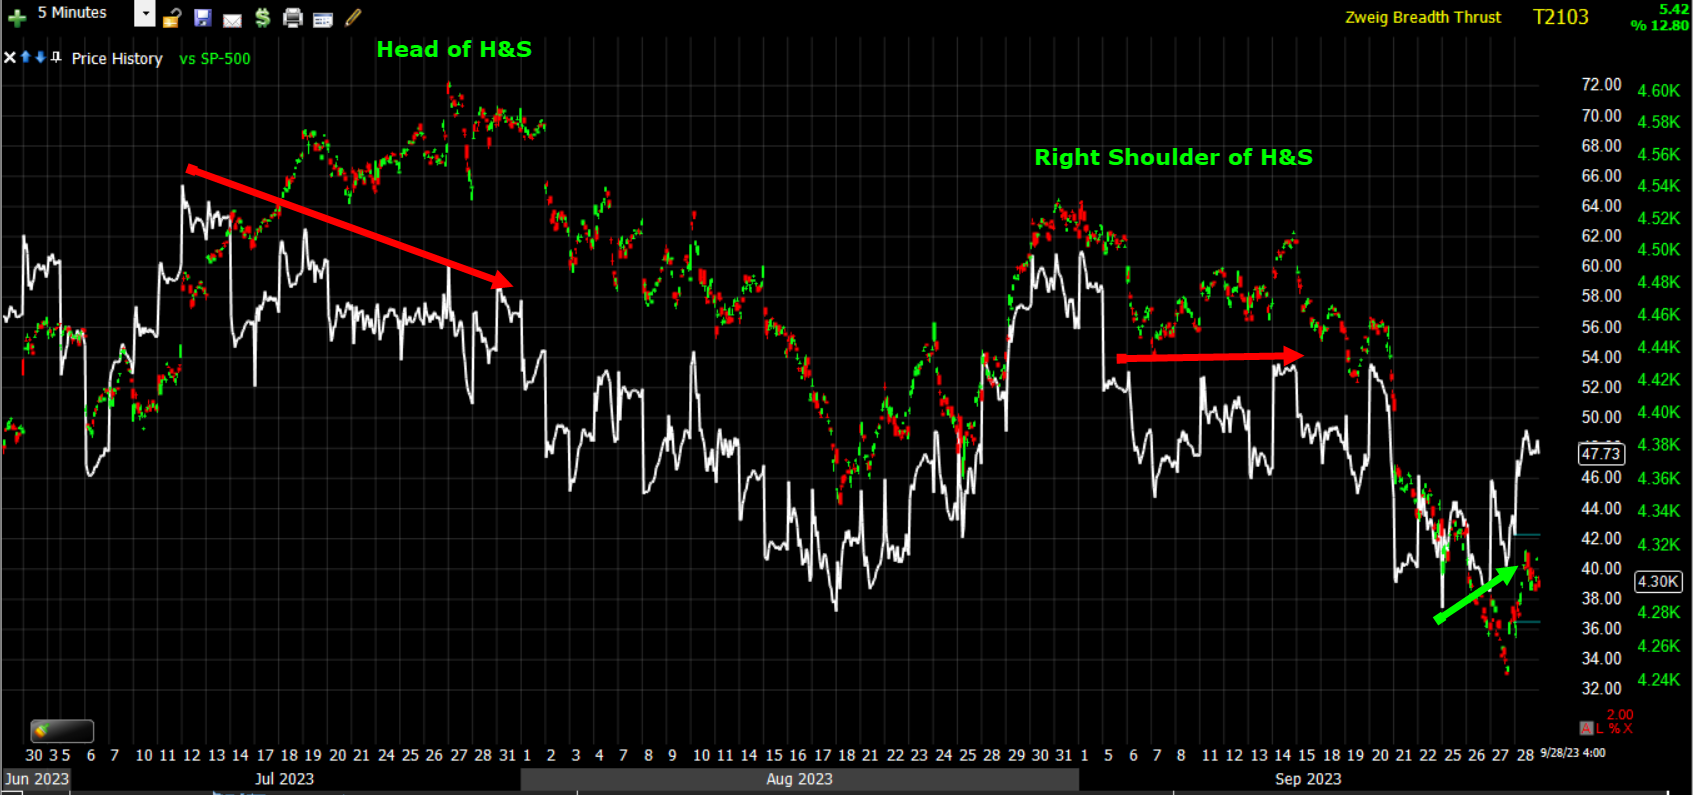 SPX (5m) and ZBT with the big picture showing market breadth detioration notably as the H&S is formed. To the far right we have a very modest bounce signal as I’d expect in the price environment we find ourselves in.
A closer look…
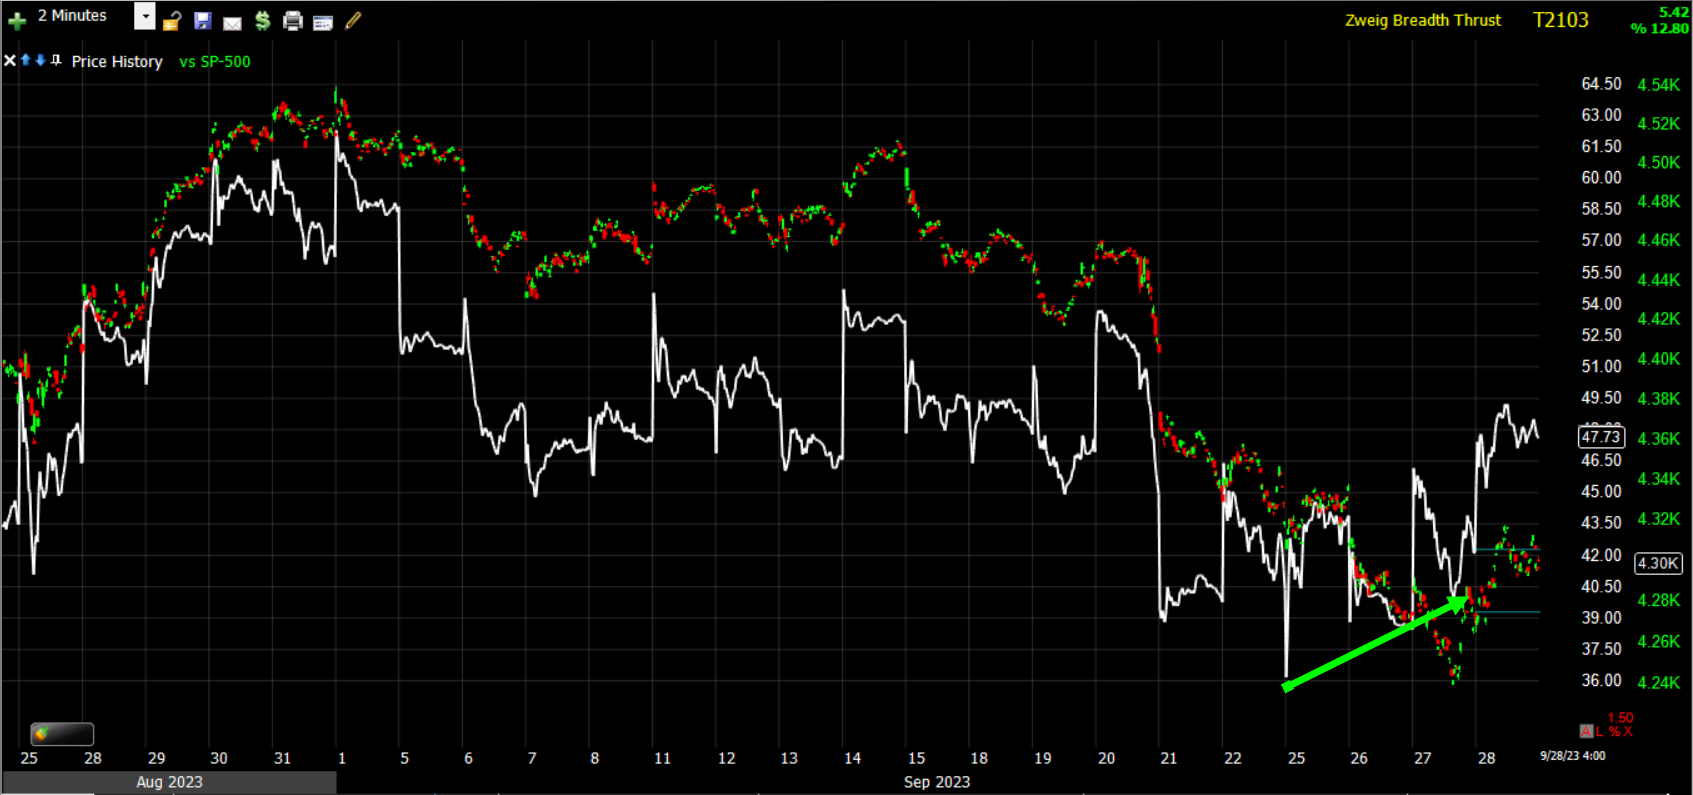 SPX (2m) and ZBT with a very modest positive divergence into this week’s low. This doesn’t scream, “Bullish”, it screams exactly what I’ve been expecting to see this week (and now heading into next week), the H&S neck lines acting as speed bumps slowing price down before an sharper impulsive break down, and hopefully a decent enough bearish bounce to use as tactical short sale entries considering the bearish strategic picture that has developed since June first started flashing bearish changes in character.
Treasuries
The 10-yr yield fell to 4.59% in overnight action before spiking to 4.68% following this morning’s initial jobless claims which was the one data point that came in strong, and revised Q2 GDP reports. It settled the session at 4.60%, down three basis points from yesterday.
The Fed-sensitive 2-yr yield also saw some volatility before settling at 5.08%, which is five basis points below yesterday’s settlement.
The curve continues to steepen since last week’s FOMC. The 2s-30s moved to its least inverted since May (steepening for the 5th day in the last 6).
On the yield curve front, you know this week I’ve been looking for signs that yields, particularly at the long end of the curve that have been surging higher since last week’s Fed, start to fade and come down allowing the market averages to bounce a little. For what it’s worth, the short end of the Treasury curve looks like it’s bottoming (2-year), meaning the Fed-sensitive 2-year yield looks like it may be topping, at least for now. That suggests the market doesn’t think the Fed is going to do much more on rates this year, although Powell and the SEP suggested 1 more rate hike.
These next two charts aren’t the sensitive shorter term timeframes I’ve been watching for tactical trade positioning purposes, but longer term trend timeframes in 3C and prices.
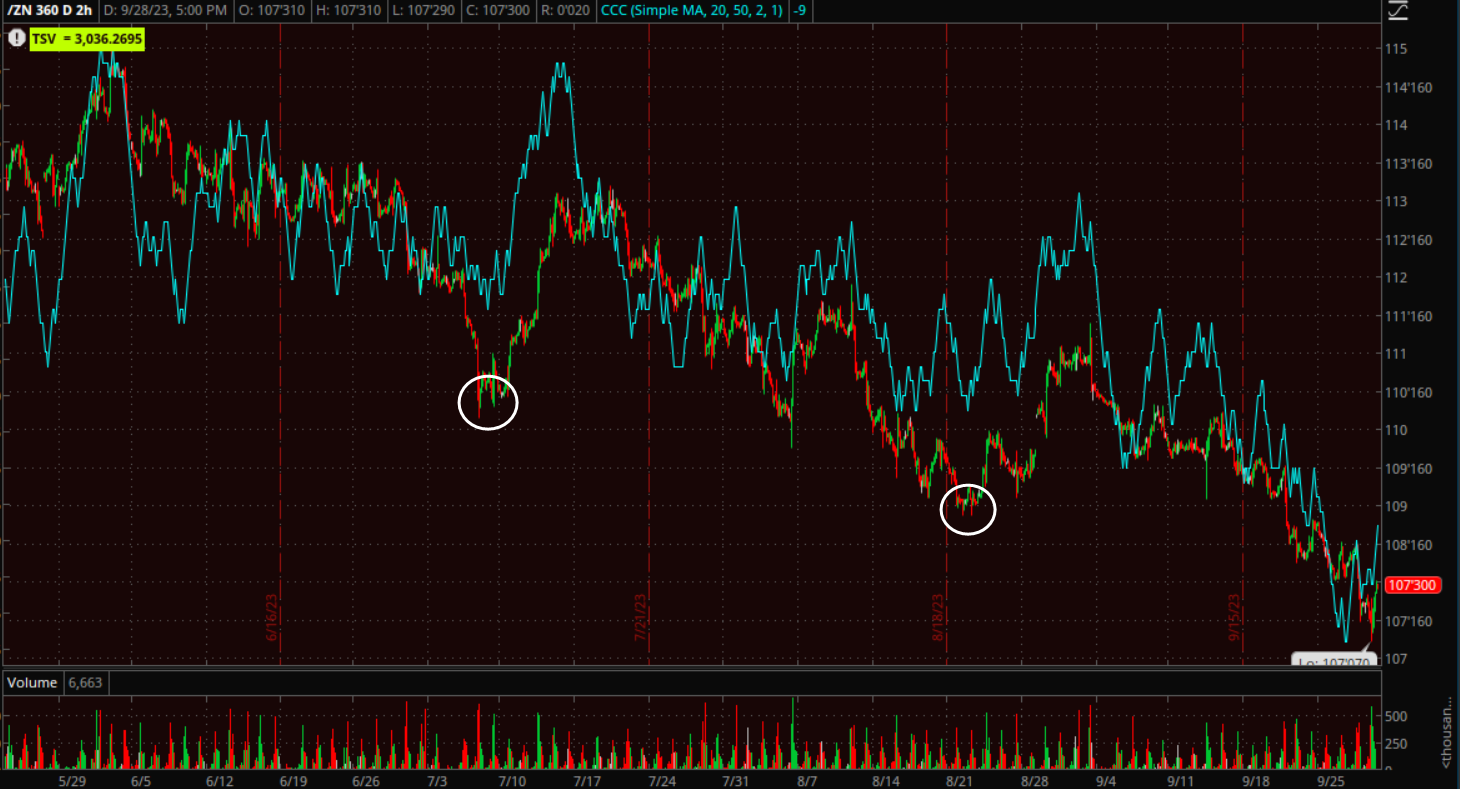
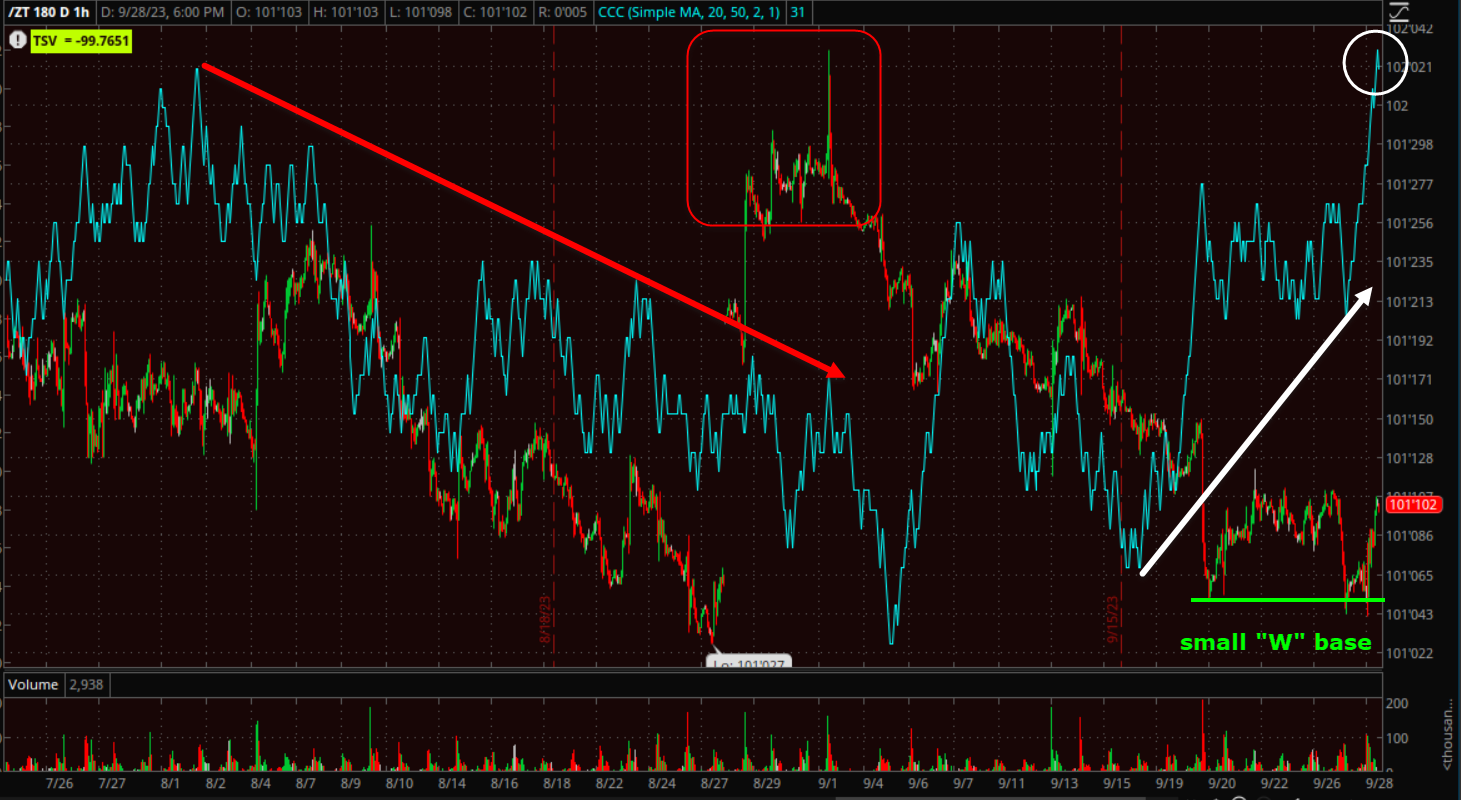 2-year US Treasury Futures (60m) – notice the negative divgernece in 3C (red) at September 1st price highs (yield lows), which was followed by more downside in Treasuries (higher in yield). Now we have a pretty remarkable positive 3C divgernece (white) and something of a “W” as well (you may recall the Dow’s October 2022 “W” base that kicked of the equity rally that ended 2022’s bear market, and lasted right into June of this year for the stock market. I mention that just to illustrate that the concepts, whether 3C or price patterns, are the same applied to stocks, bonds, cryptocurrencies, or the price of rice. The divergence isn’t just positive (white arrow), but the much stronger leading positive (white circle). This suggests to me that the bond market thinks the Fed is done hiking rates.
However, it’s a different picture when we look at the longer end – 10-year and longer tenors.
 10-year UST futures (2H) with a couple of minor relative positive divergences (white circles) that led to modest bounces. However to the far right, no divergence at all. 3C is confirming lower prices. That suggests to me that the bond market does not think the rise in long term yields is over, and that makes perfect sense to me in a way. First, we know that an inverted yield curve is an extremely high probability predictor of a U.S. economic recession and the curves inverted last year between June and October (depending on the spread). However, the imminent sign of recession is when the curve starts to steepen dramatically after inversion.
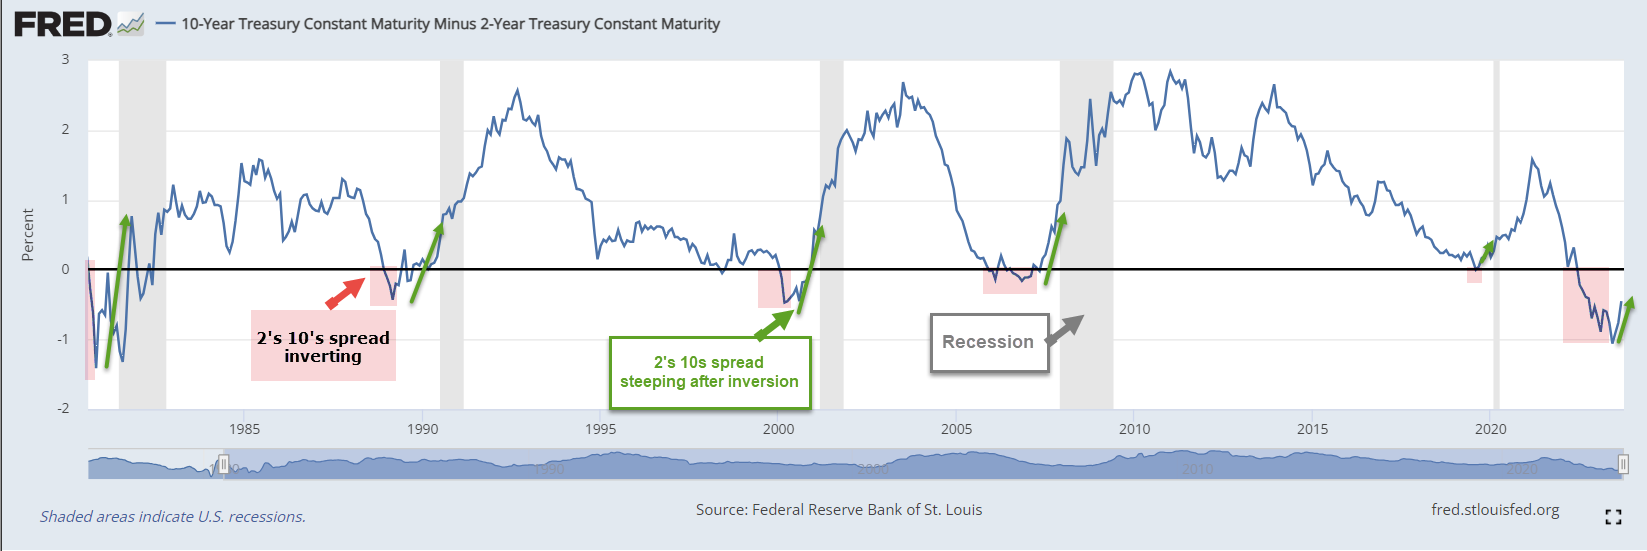
In every case, the 2s-10s yield curve/spread inverts (shaded red), then steepens sharply (green arrow) just as the economy moves into recession (gray shading).
These two charts (2y and 10y) suggest that we have more yield curve steepening ahead.
Just for consistency, here’s the 2-year Treasury futures’ 3C chart on the same timeframe…
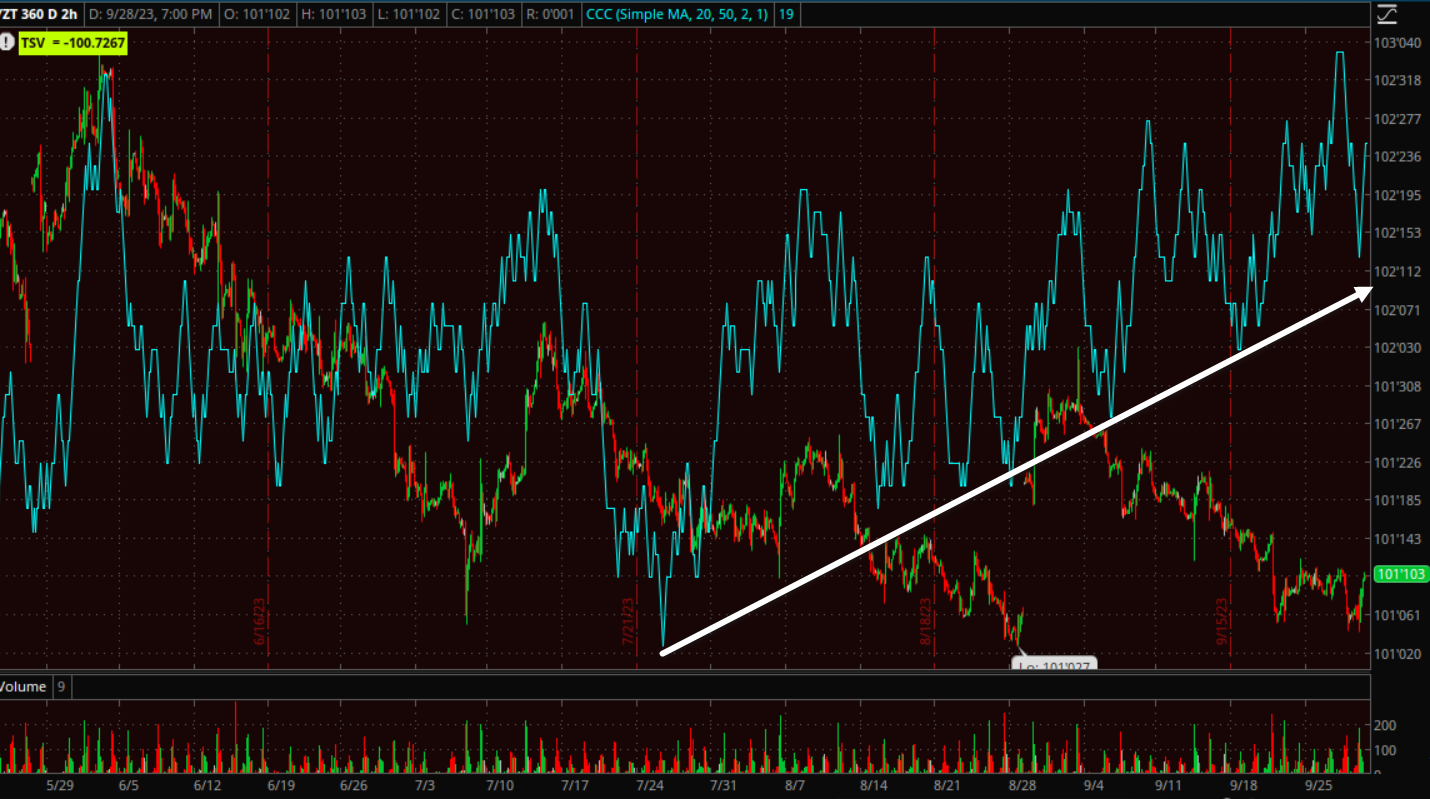 2-year US Treasury Futures (2H) the divergence isn’t as sharp, but that’s because this is a longer/stronger timeframe. It’s still clearly very positively divergent.
The huge bullish flag on the 10-year yield and bullish ascending triangle on the 30-year suggest the same… yields at the long end have more upside to go.
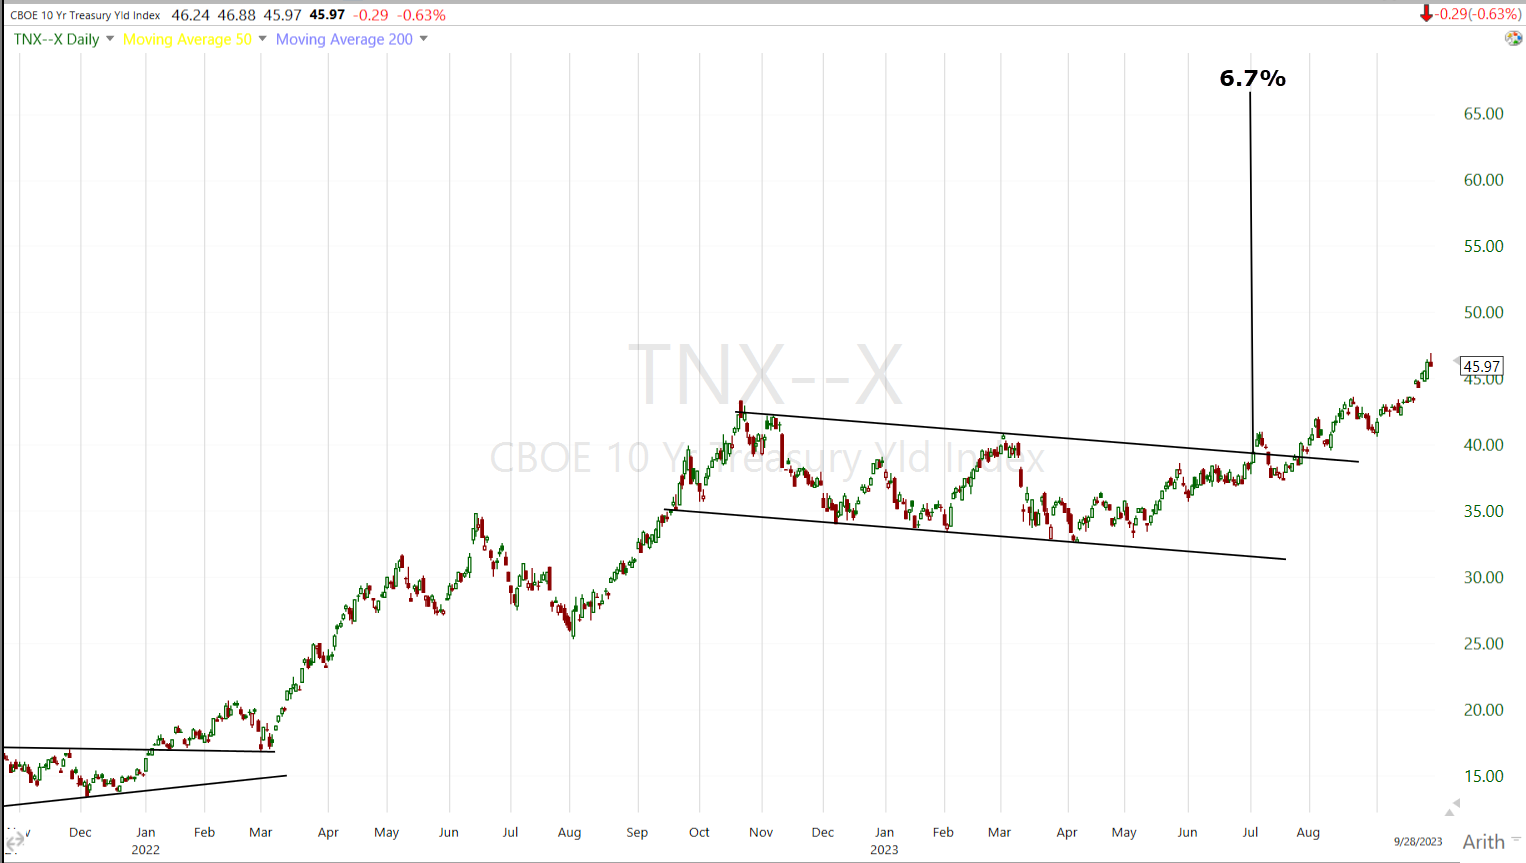 10-year yield (daily) with a bull flag that has a measured move to 6.68% (6.7%). I covered this earlier in the week, but still found it hard to believe that the 10-year yield had that much more upside to go.
Then Tuesday I was nearly shocked to hear JP Morgan’s CEO, Jamie Dimon say essentially the same thing I had covered just the night before,
” JPMorgan Chase CEO Jamie said that the world may not be ready for interest rates to reach 7%, according to the Times of India.”
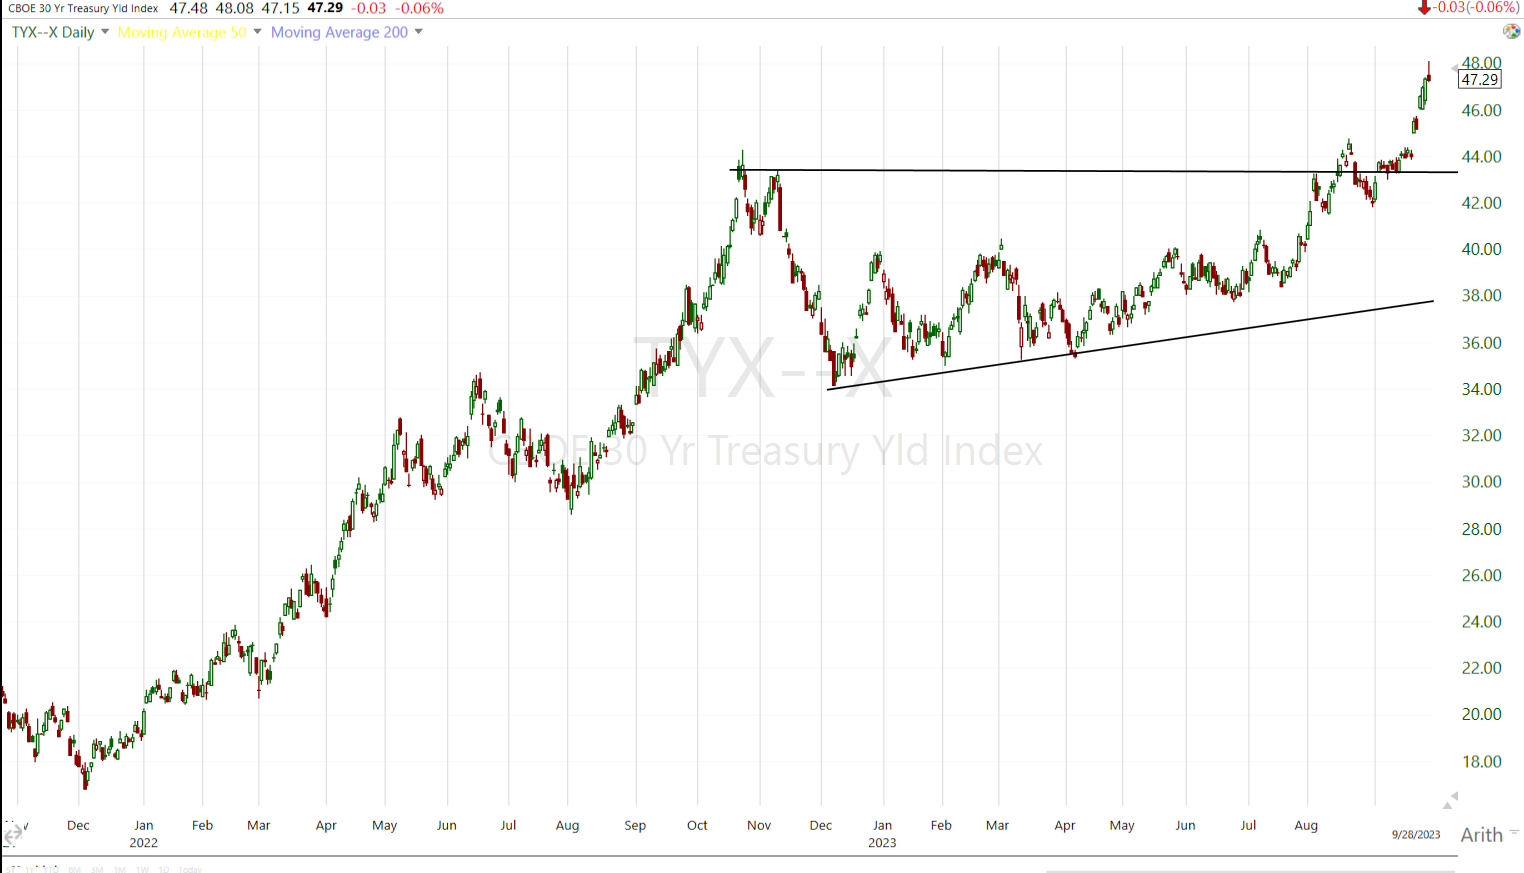 30-year yield (daily) bullish ascending triangle that’s already broken out to the upside, suggesting a measured move target of 6.5% for the 30-year yield!
In my coverage of the topic Monday I used the 2018 example of a bullish 10-year yield chart pattern that was set to break out, but at the time I had no idea what the actual catalyst would be. Then on October 3rd, 2018, in an interview, the Fed’s Powell (as the Fed was in a modest rate hiking cycle) said that he didn’t “Know where the neutral rate was, but it is higher”. The very next day the S&P started what became a -20% sell-off from October 4th to Christmas Eve of 2018. The only thing that stopped the 10-year yield from reaching its measured move was then President Trump calling a meeting of the plunge protection team on Christmas Eve after the S&P crashed -20%. This was just 2 weeks after the Fed hiked rates again by 25 basis points, sending the market even lower. It was clear to the market that this meeting of the PPT was Trump telling Powell that the Fed is DONE hiking rates, and that as true. The Fed didn’t hike again in that cycle and in 2019 they started cutting rates and buying assets to expand their balance sheet.
To be clear, 6.5% to 7% long term yields would be downright apocalyptic for an equity market that has grown accustomed to an extremely low Fed Funds Rate over the last 2 decades, that was at ZERO just February of last year, and spent 7 years (2008-2015) at the ZERO bound the entire time. Stocks/corporations, small businesses and certainly consumers, aren’t robust enough to survive anything approaching those levels. This is why I presented the charts Monday night, but couldn’t imagine them actually getting there. And why I was so shocked to hear Jamie Dimon say nearly the exact same thing the very next morning.
To be completely transparent, I don’t want to believe that 6.5% to 7% long term yields are possible if not probable, because I know what the fallout would be. I’m not concerned about the equity market fall out because there’s great money to be made as stocks fall much faster and harder than they rise and I’m not timid about shorting stocks, but rather what the fall out would mean for the economy, or more specifically the average every day hard working American that’s not financially literate enough to navigate, or profit from such a scenario. Few are. I’m terrified for friends and family at the thought of yields hitting those levels. But, am I surprised after decades of reckless Fed policy? No. I’m not.
I already touched on it last night, given additional curve steepening, I wouldn’t want to own the regional banks over a the long haul at this point, but the curve steepening since the FOMC last week, should give them a leg up on a bounce as a steeper curve improves their net-margin interest income. The Regional Banks seem to be ore sensitive to the curve than the bigger banks.
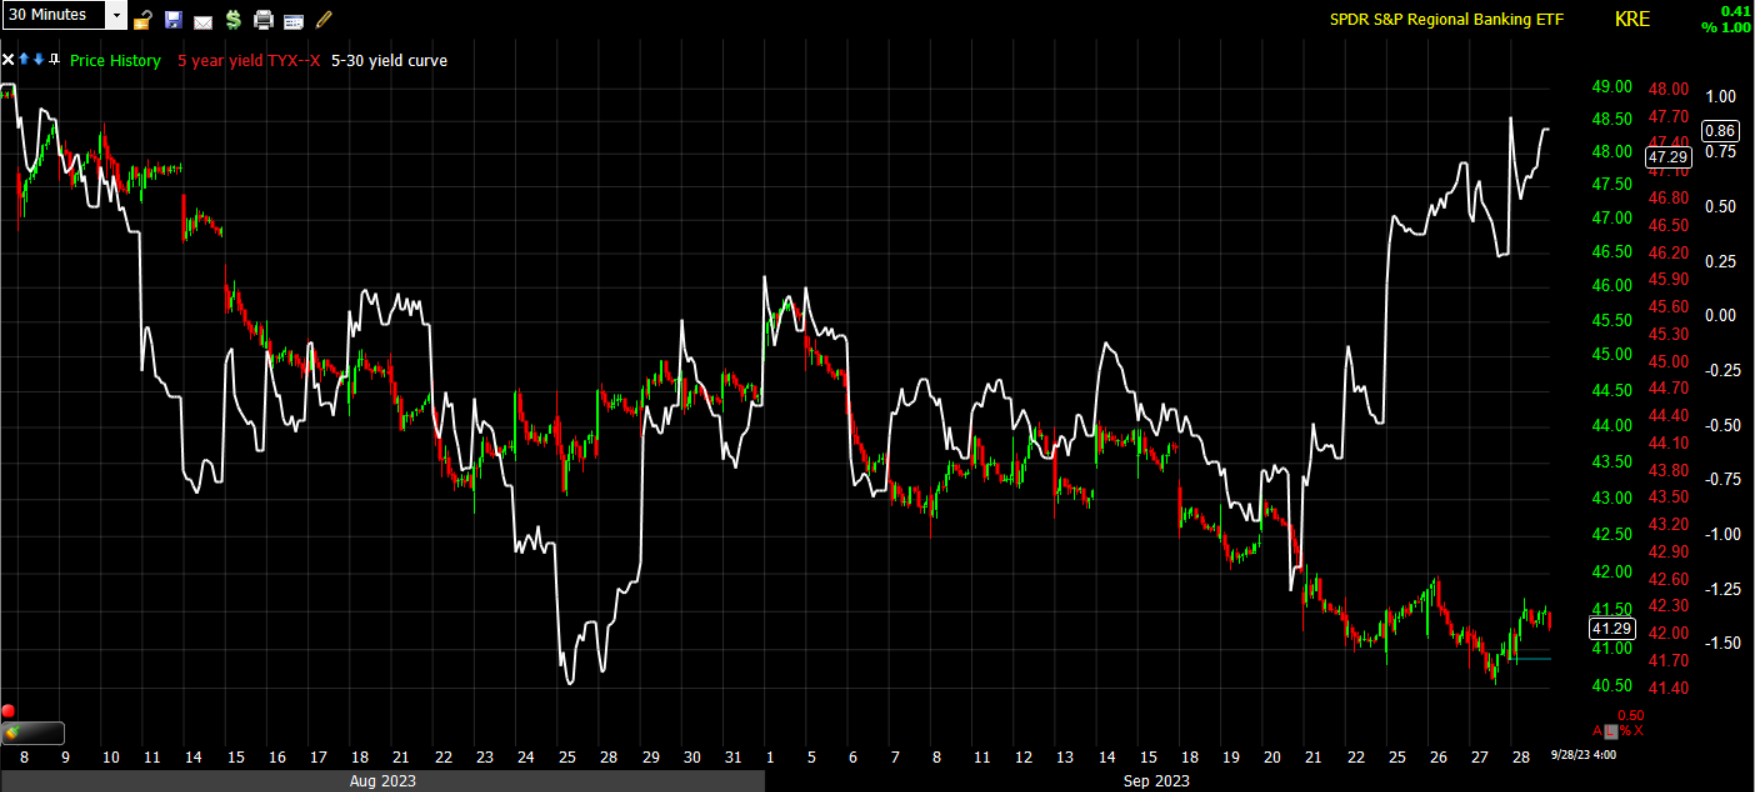 Regional Banks (30m) and the 5s-30s yield spread. If you’re not excited about the idea of Regional Banks, then Small Cap Russell 2000 (IWM) is another alternative as the Regionals and Small Caps rarely move in different directions.
More broadly, I’ve been talking about the lagged effect of monetary policy hitting the economy hard in the second half of the year (Q3 and Q4). We’re seeing that pop up more frequently in the economic data, and housing as we saw this morning. Just look at the national average for a 30-year mortgage!
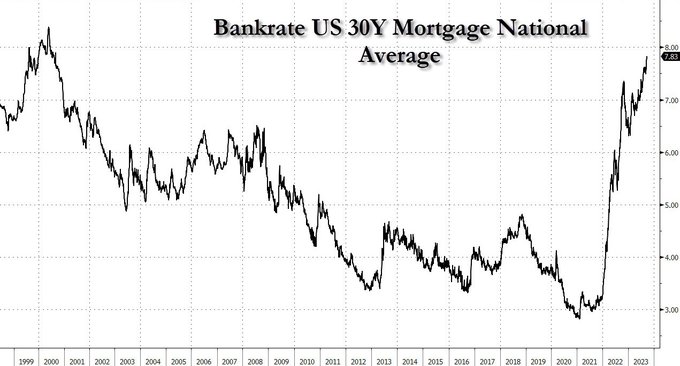
Source: Bankrate
Currencies and Commodities
The U.S. Dollar Index slipped lower about -0.4%, in lock step with Treasury yields due to the less than stellar economic data.
No doubt helping the equity market via lower yields, WTI crude oil futures gave up some ground today after a big move higher yesterday, settling down -2.5% to $91.57/bbl. Natural gas futures rose +1.2% to $2.95/mmbtu.
Gold did not get the same juice from lower yields and U.S. Dollar that stocks did. Gold futures settled lower by -0.7% to $1,878.60/oz.
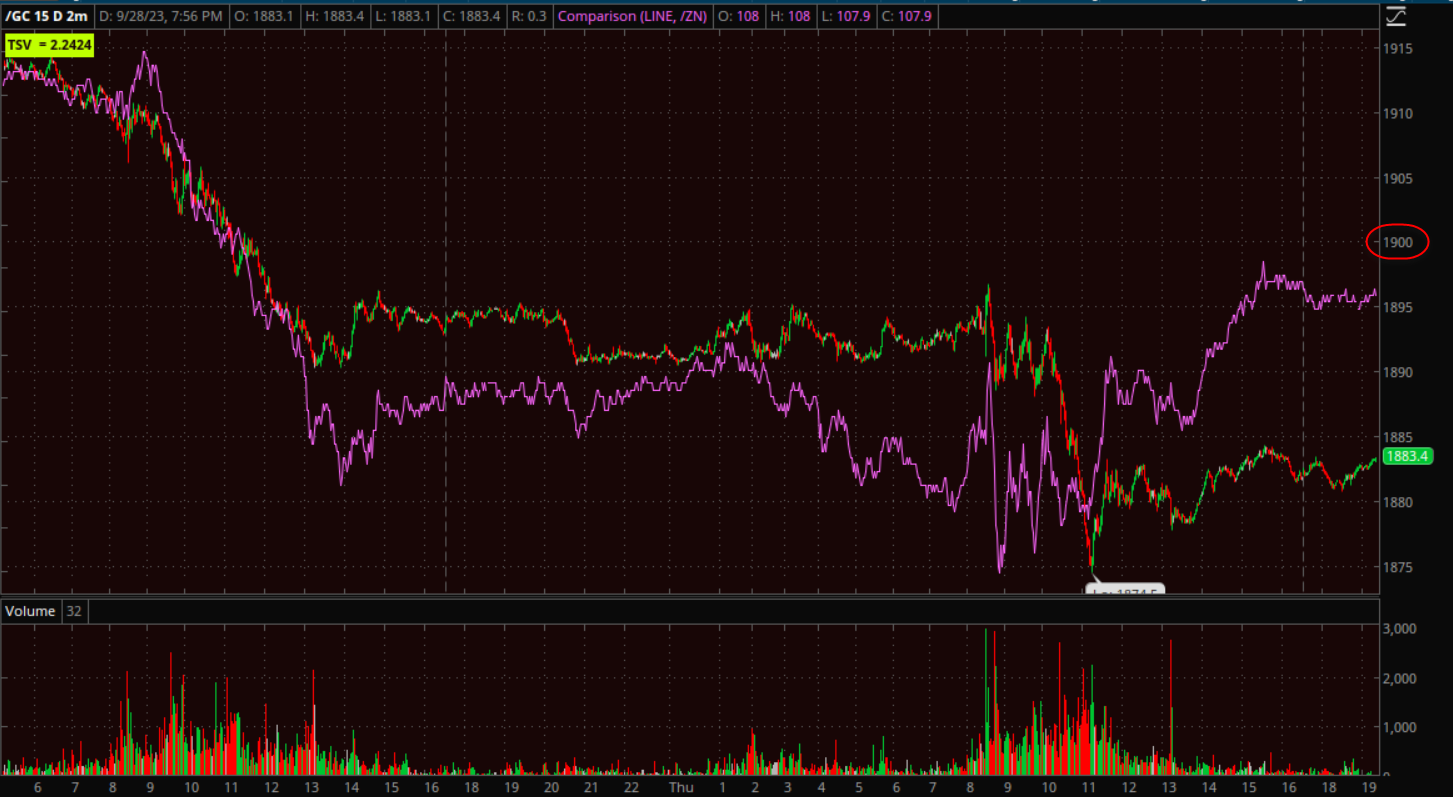 Gold futures (2m) and 10-year UST futures. I suspect on of 3 factors played a role – the most obvious to me is stop-loss selling (perhaps CTA, Vol. Control or other trend following systems) continued dumping gold on the break of $1900. There’s a chance that after 3.5 weeks of selling in stocks, investors had more appetite for risk assets than a typical safe-haven, or there’s quarter-end dynamics in play such as window dressing. If yields continue to come down, I’d expect gold to make a run for a test of $1900 above fairly soon, and in fact there’s some evidence of that on 3C charts today.
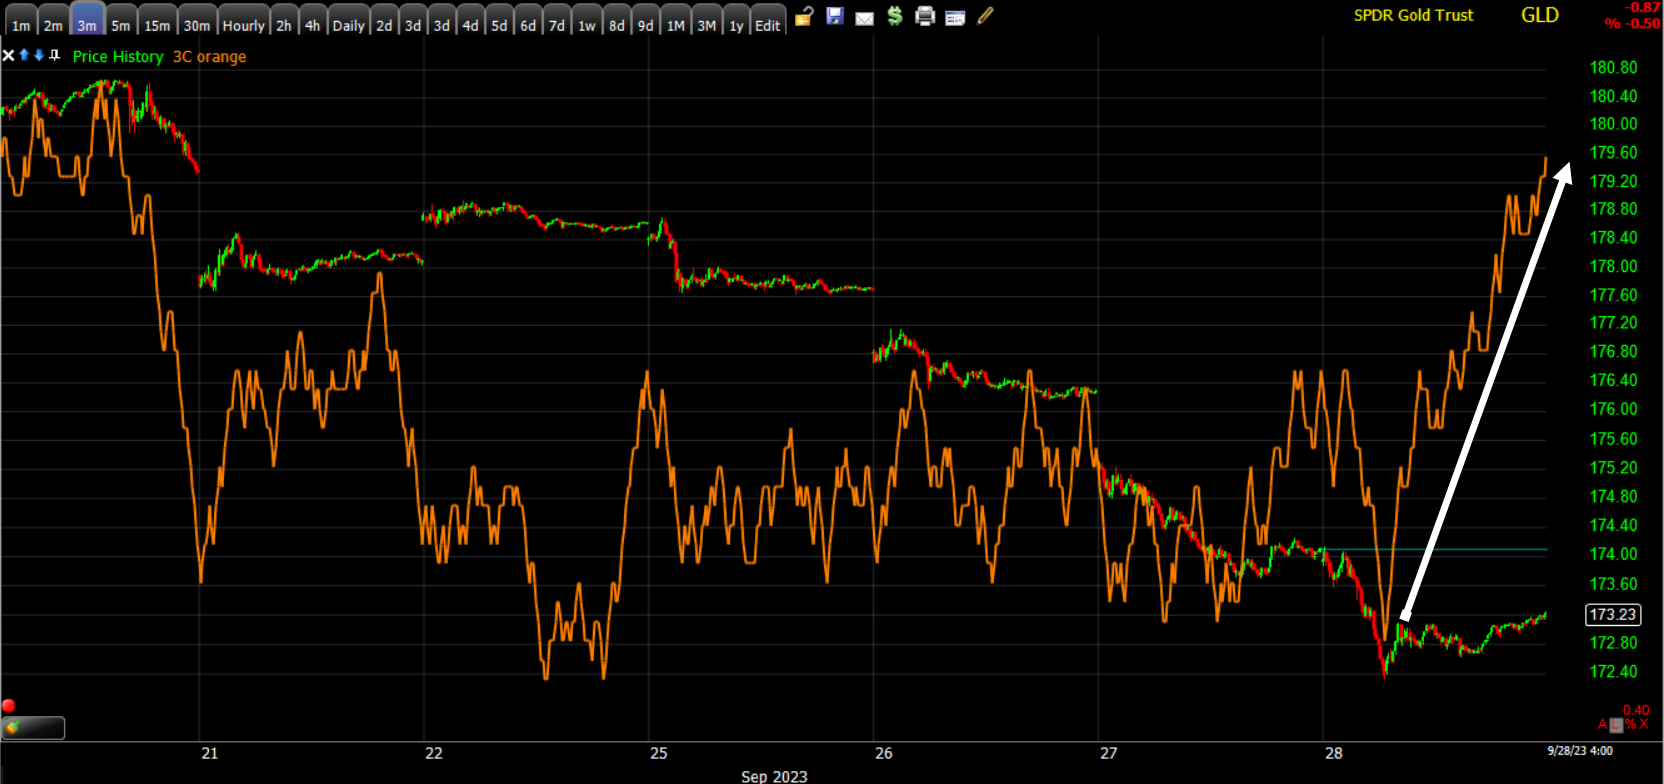 GLD /GOLD ETF (1m)
And…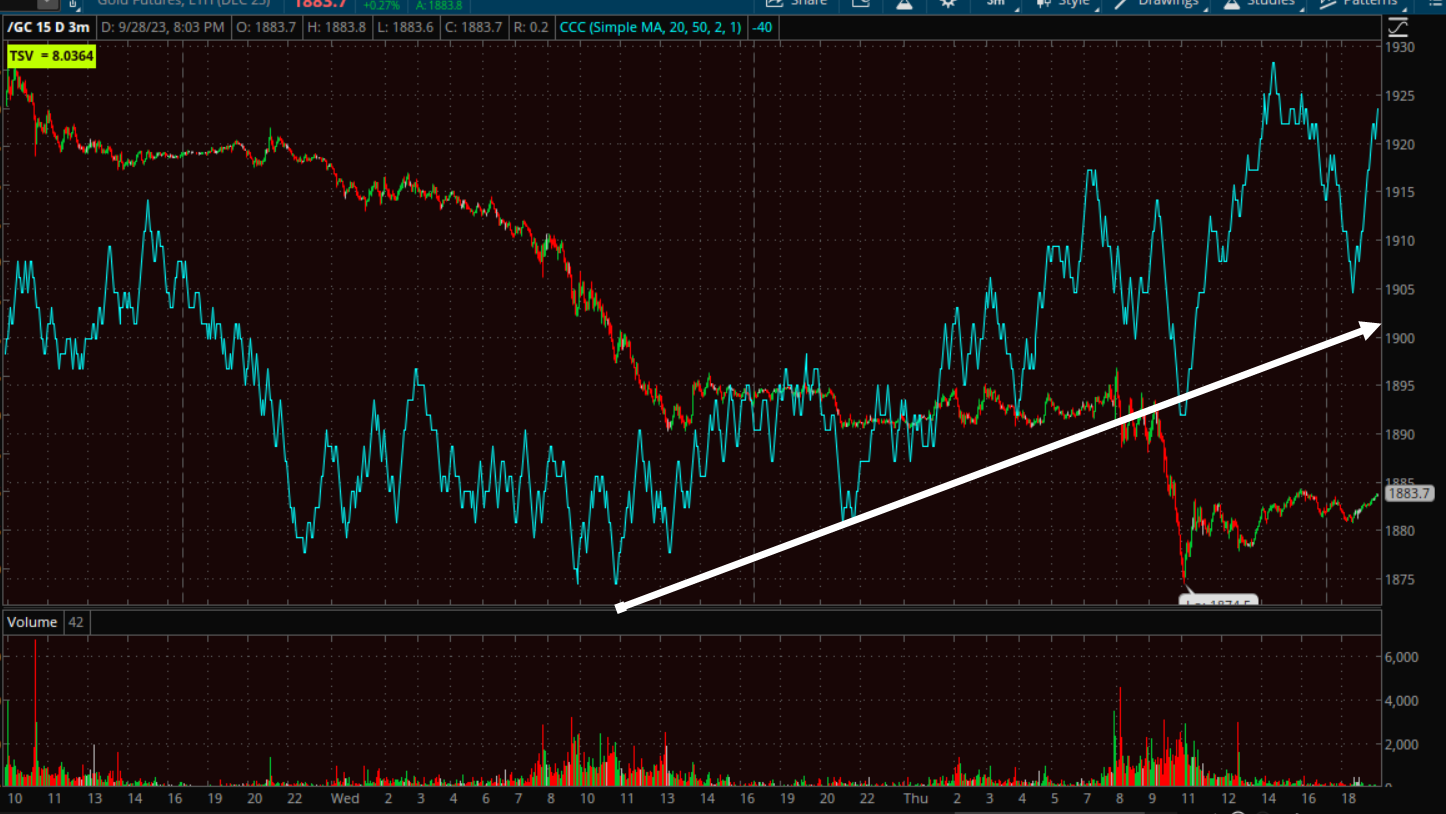 Gold futures (3m).
However, the near term price action is still bearish so I’d probably wait it out tomorrow/end of the quarter and then see if there’s still evidence of buyers stepping up efforts.
The long Uranium idea from a subscriber (Mario Y.) that I featured in Tuesday’s Daily Wrap, with the idea of buying a pull back to $26.75…
“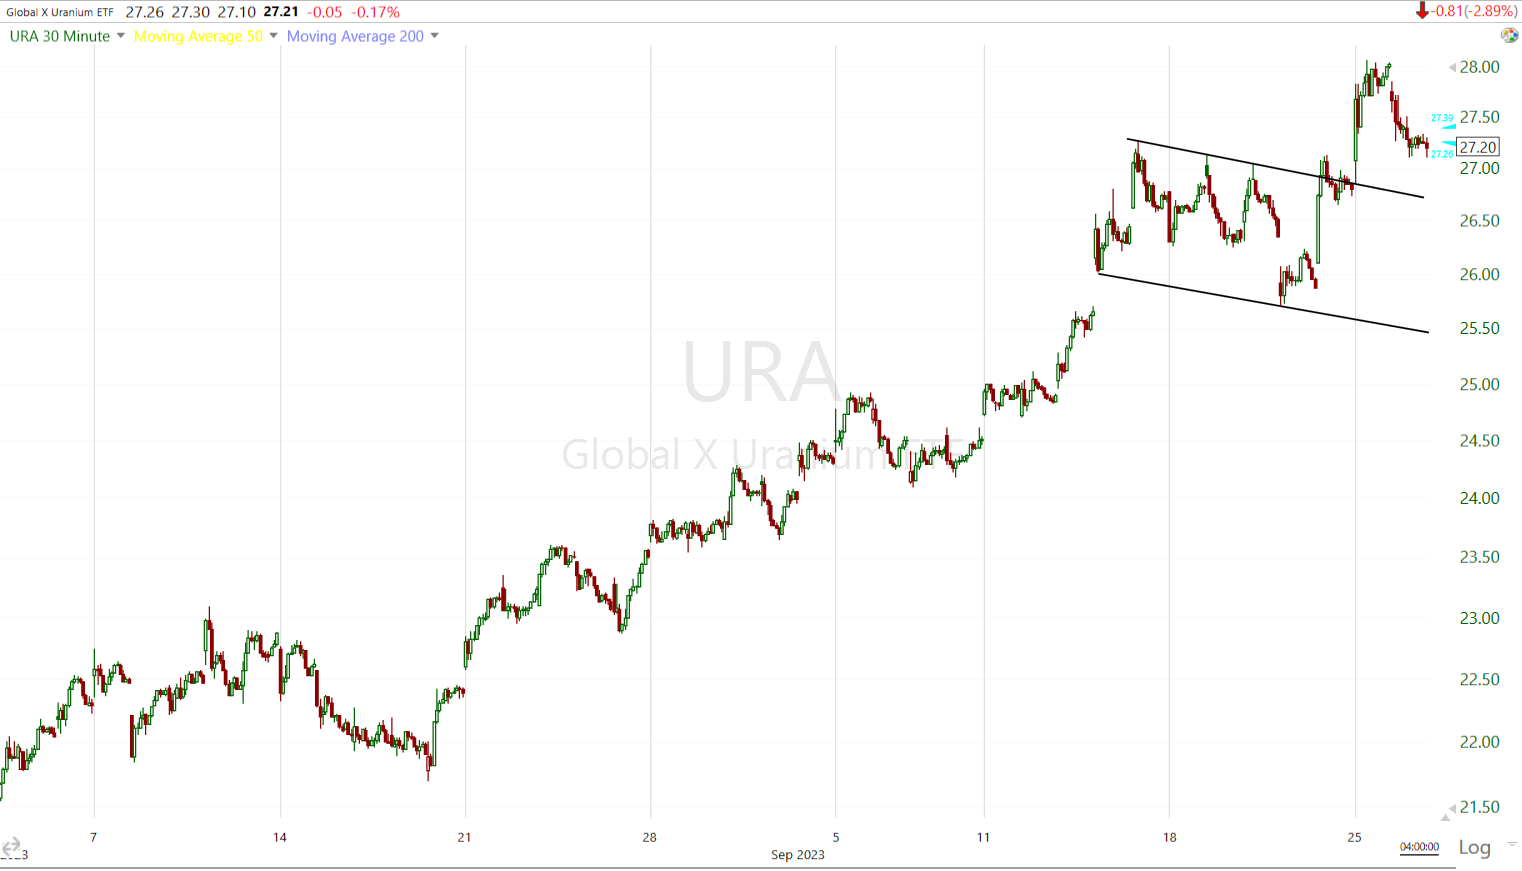 URA (30m) with a bull flag consolidation at resistance, and a breakout starting. I like the looks of these charts a lot. I think a pull back to the upper end of the bull flag around $26.75 for URA would make for an excellent long trade entry. “
…added another +3.3% today to gains.
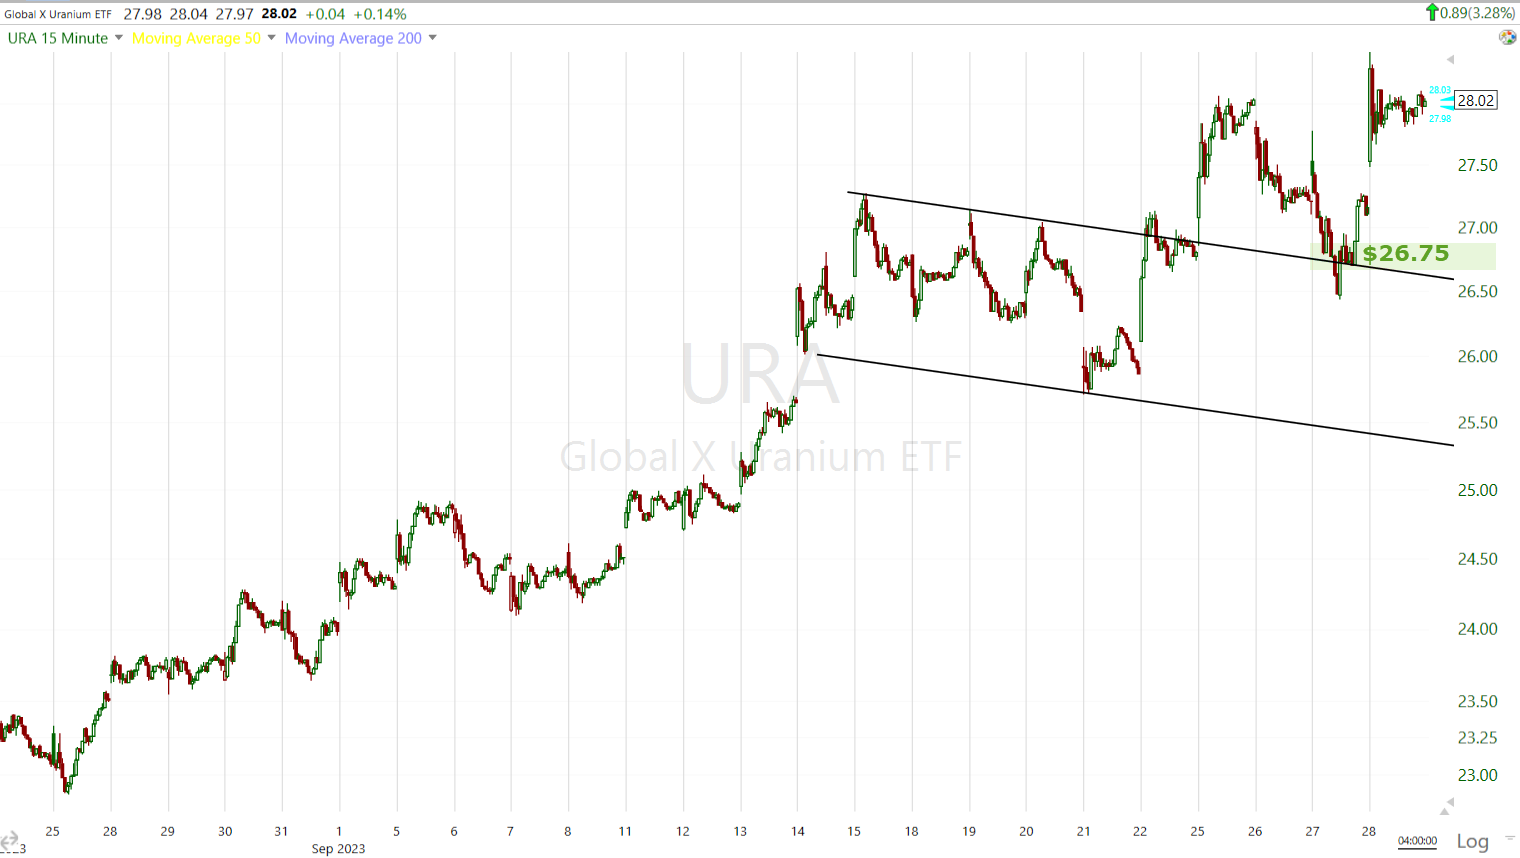 URA (15m) – I know some of you missed the $26.75 entry and like the idea (Thank Mario Y.). There’s still a substantial zone of resistance from April 2022 right here so we may see some pulling bac/consolidating, maybe filling this morning’s gap up and that could offer another opportunity. Price ended the day (intradya) with a bullish consolidation. There’s so much potential upside here that I wouldn’t be too worried to use a little patience and pick your entry, or as they say, “There’s a bus every 15 minutes”.
Bitcoin jumped back above $27k, partly due to improved risk sentiment, partly due to the lower U.S. Dollar (virtually one and the same with risk sentiment now).
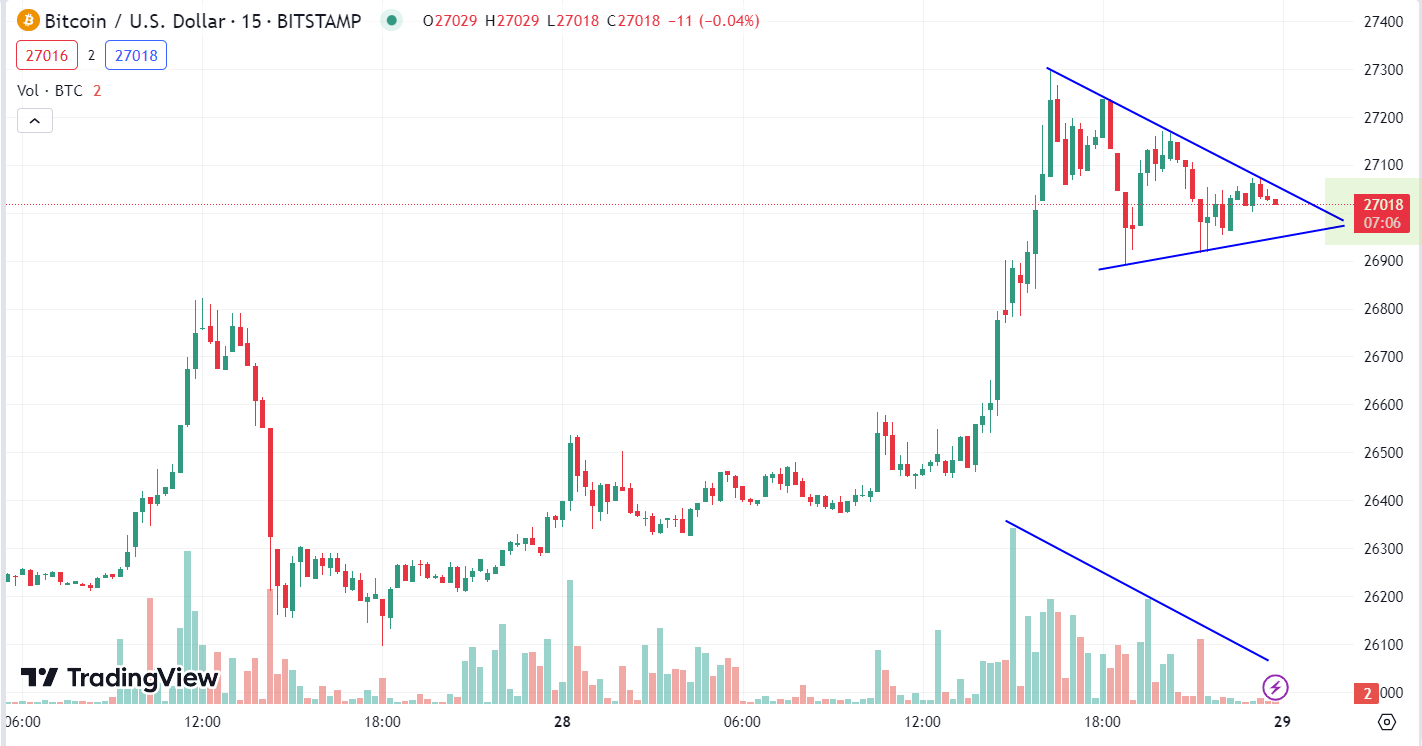 BTC/USD (15m) notice there’s a bullish consolidation (triangle) like the major averages this afternoon and volume is diminishing in to the consolidation as it should. Also the apex of the triangle consolidation is right there at $27,000.
Summary
Tomorrow is not only month and quarter’s end, but we get some interesting data given today’s GDP like Personal Income/Spending, as well as inflation data with the PCE, and sentiment data.
As always, 1-day is not a trend, but I think probabilities favor the bullish flags from this afternoon’s intraday trade, extending into tomorrow and that may set up better positioning in to next week for tactical short trade entries. That’s what I’ve been looking for most of this week, but we’ll almost certainly need to see yields come down more. I don’t see the equity market doing anything big on the upside without the 10-year yield at least trading below the psychologically important 4.50% level.
If we do get some better market tone in the next few days and in to next week, I’ll be watching the 3C charts for conviction, how far a potential move can go (I posted some measured moves for all of the major averages based on this afternoon’s bullish consolidations in the Afternoon Update).
What I’m seeing on Treasury yield price charts, and Treasury futures’ 3C charts, is probably the most alarming set of charts I’ve seen this year. You know where I’ve stood on the market rally ending as we move in to the second half of the year, and a recession likely starting the first half of next year. My view has been that with yield curves the most inverted in 40-years, the soft landing narrative of market bulls (not even the Fed will stand behind this narrative any longer) was silly and there was no way that we wouldn’t see 1) a recession and 2) probably a recession that’s worse than average. But after looking at the charts of long term yields, for the first time I’m truly disturbed. It’s not the market that has me concerned. I see nothing but huge opportunity there for those willing to grasp it. I’m concerned for the nation, for my friends and family. Some of you have been subscribers to my analysis for over a decade. I don’t think any of you have ever heard me say something like that, and I was around and doing this in 2008.
Overnight
S&P futures are down -0.2%, but still well within the context of the afternoon price consolidations. VIX’s 3C chart is a bit stronger than normal so it appears traders are a bit nervous and why wouldn’t they be considering the recent market trend and a day of modest gains? Their lack of conviction on the bullish side is still evident on 3C charts.
The U.S. Dollar Index is down -0.1%
WTI Crude Oil futures are up a modest +0.15% in a bearish consolidation of today’s losses.
Gold futures are up +0.2%
Bitcoin futures are down -0.15%, but continue this afternoon’s bullish consolidation.
TSY yields are nearly flat tonight.
Looking ahead to Friday, the economic calendar features:
- 8:30 ET: August Personal Income (prior 0.2%), Personal Spending (prior 0.8%), PCE Prices (prior 0.2%), Core PCE Prices (prior 0.2%), advance goods trade balance (prior -$91.2 bln), advance Retail Inventories (prior 0.3%), and advance Wholesale Inventories (prior -0.1%)
- 9:45 ET: September Chicago PMI (prior 48.7)
- 10:00 ET: Final September University of Michigan Consumer Sentiment (prior 67.7)