Stock Market Daily Wrap – May 10, 2021
The day started out with futures reflecting an investor preference for large-cap Dow and cyclical stocks, while large-cap Tech was under pressure before the open.
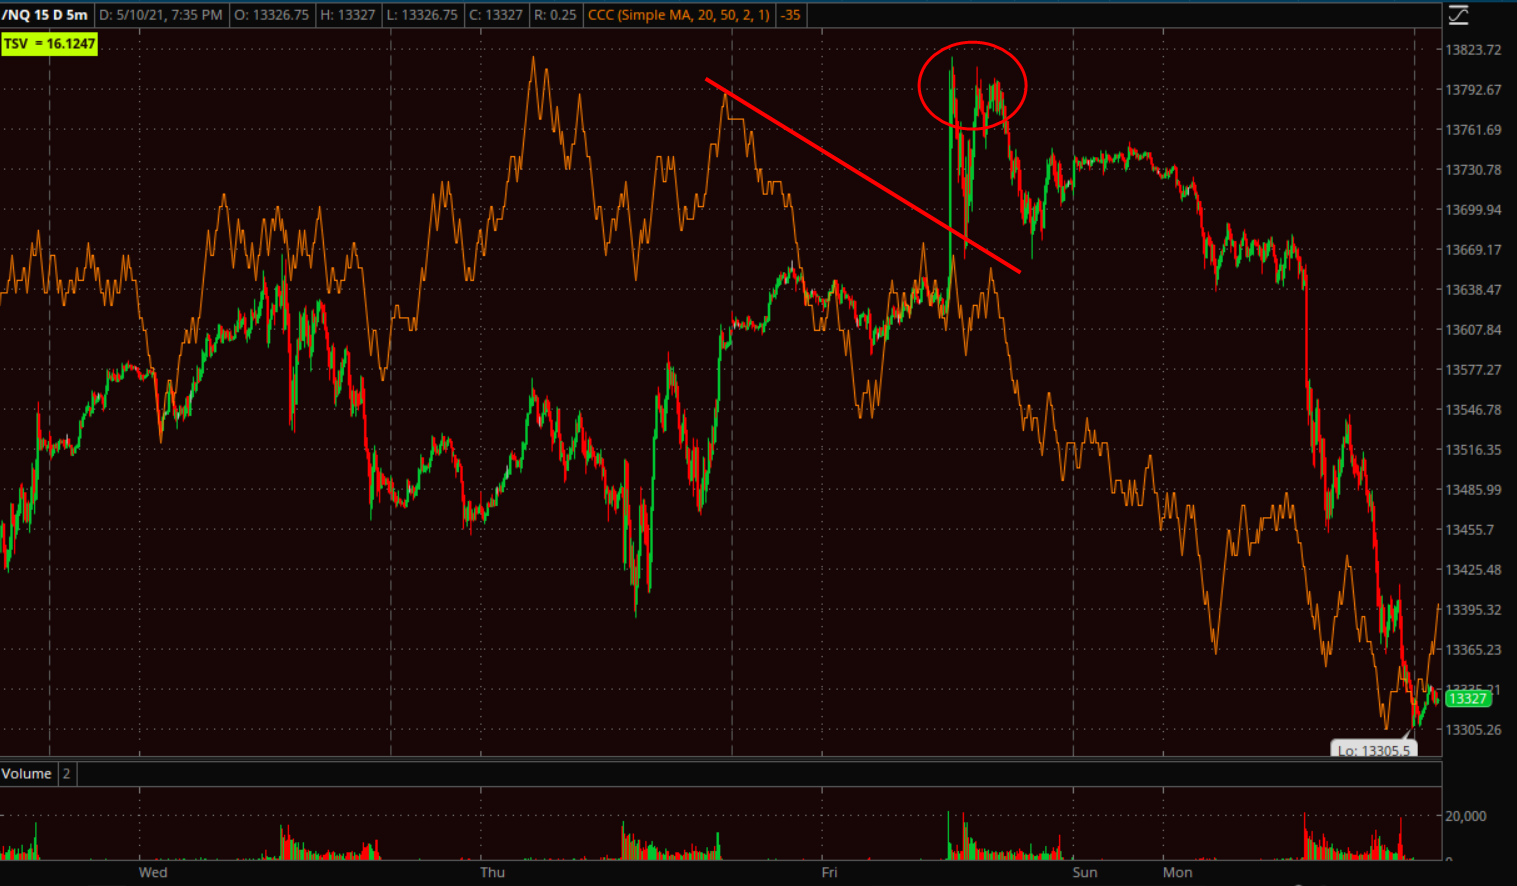
NASDAQ-100 futures (5m) posted a negative divergence into Friday’s highs as NASDAQ-100 filled last Monday’s gap and ran into overhead supply/resistance Friday in the form of the nearly month-long range. Prices fell into the start of the new week and on increasing volume at the start of the cash session.
S&P futures look similar with a divergence at Sunday night’s high.

ES (5m)
In the afternoon commodities faded sharply, interrupting a multi-week win-streak and souring Risk Sentiment among early leading cyclical sectors. After Friday’s 4 bp jump in the 30-year yield, bond yields climbed off morning lows to end higher today reflecting inflation concerns and putting additional downside pressure on the large-cap Tech stocks this afternoon that were already under pressure in pre-market.
This afternoon’s Risk Aversion post mentioned the short term toppy action in various commodities that have been on a tear to the upside, which was likely to weigh on the re-opening cyclical trade, and rising long term bond yields (saw some of that Friday in the 30-year yield) that weighed on the secular growth mega-cap stocks.
“Commodities like Lumber futures and Copper futures are looking near-term toppy, signalling the potential for risk aversion among cyclicals. Yet at the same time, bond yields are up 1 to 4 bp with the long end outperforming which has typically been a headwind for the large-cap tech growth stocks.”
The averages ended with bearish near term intraday price action, and near the lows of the session.
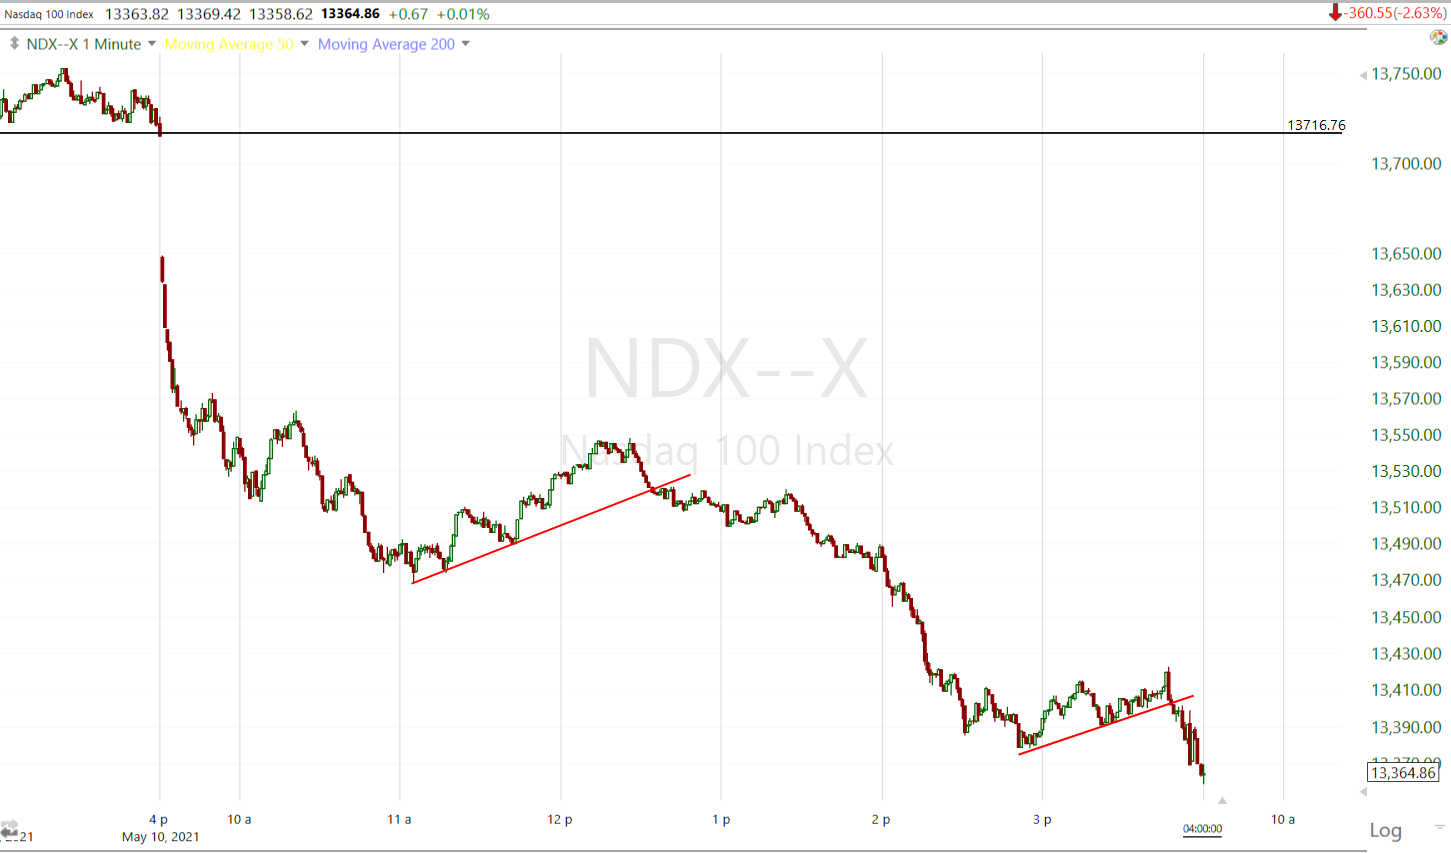 NASDAQ-100 (1m) bearish intraday price action.
For the third time in a week, Dallas Fed’s Kaplan spooked markets warning that he was “cognizant of excess risk-taking in financial markets”.
Averages
Although all of the major averages closed lower, large-cap Tech NASDAQ-100 and Small Cap Russell 2000 were laggards out of the gate. Dow was best on the day, but failed to hold new highs by the close.
S&P 500 ⇩ -1.04 %
NASDAQ ⇩ -2.63 %
DOW JONES ⇩ -0.10 %
RUSSELL 2000 ⇩ -2.59 %
The Dow was up as much as +0.9% intraday and traded above $5k for the first time ever, but gave back all gains to close lower and snap the 5-day win-streak.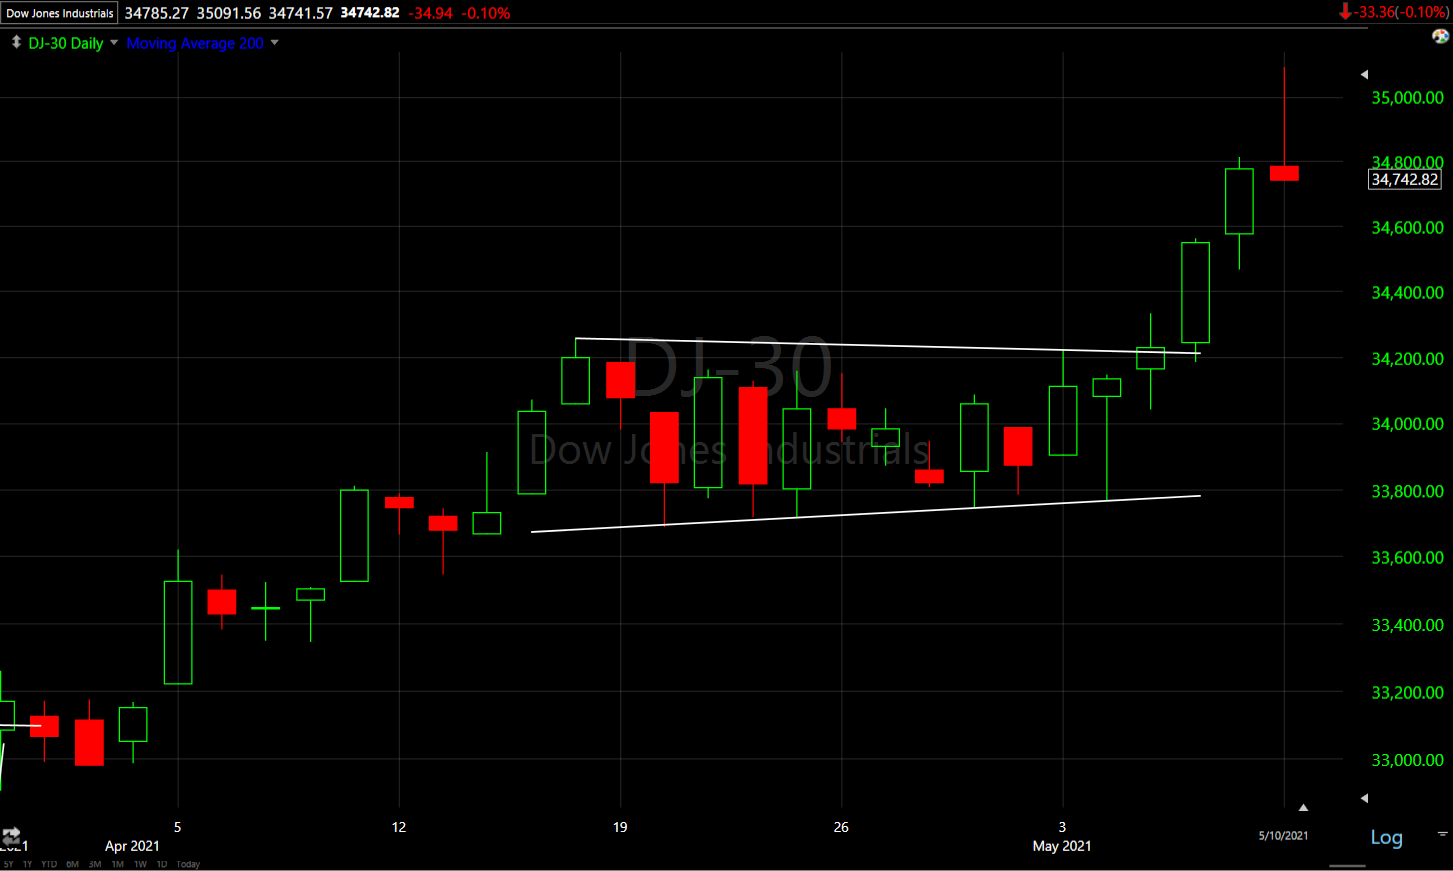
Dow (daily) posting a bearish inverted hammer.
The S&P started following in the Dow’s footsteps with a breakout above its own range last week, but had not put that much distance between current prices and the range, and was at risk of another failed breakout. By the close, S&P-500 was darn near another failed breakout.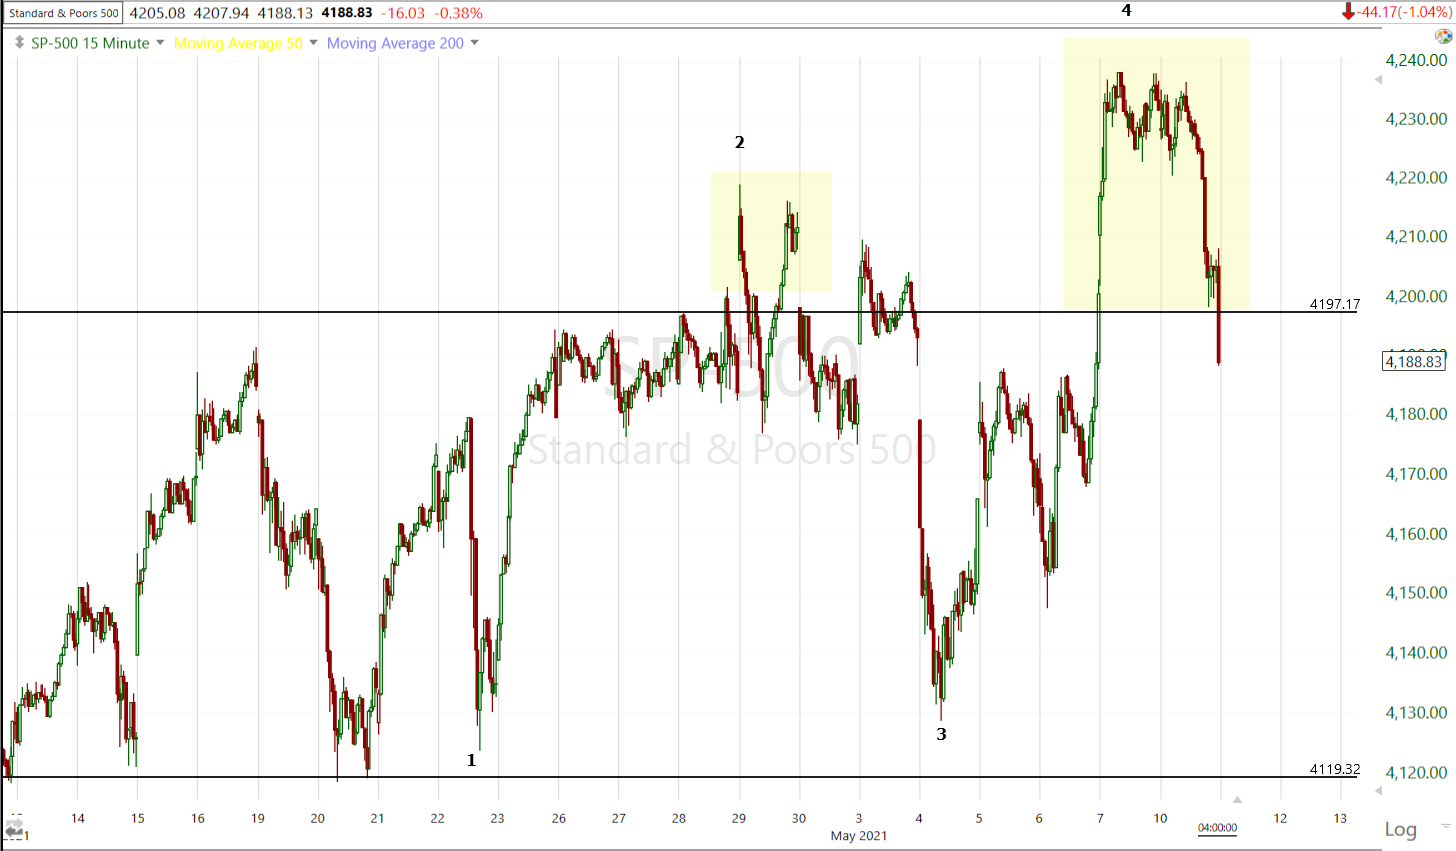 SP-500 (15m) closing back inside the range, although the trend line could be adjusted a few points in either direction and still be credible. Still, this is not a good look for the S&P after a failed breakout just over a week ago and with SPY and ES 3C charts negatively diverging, or at least not confirming the breakout (see below).
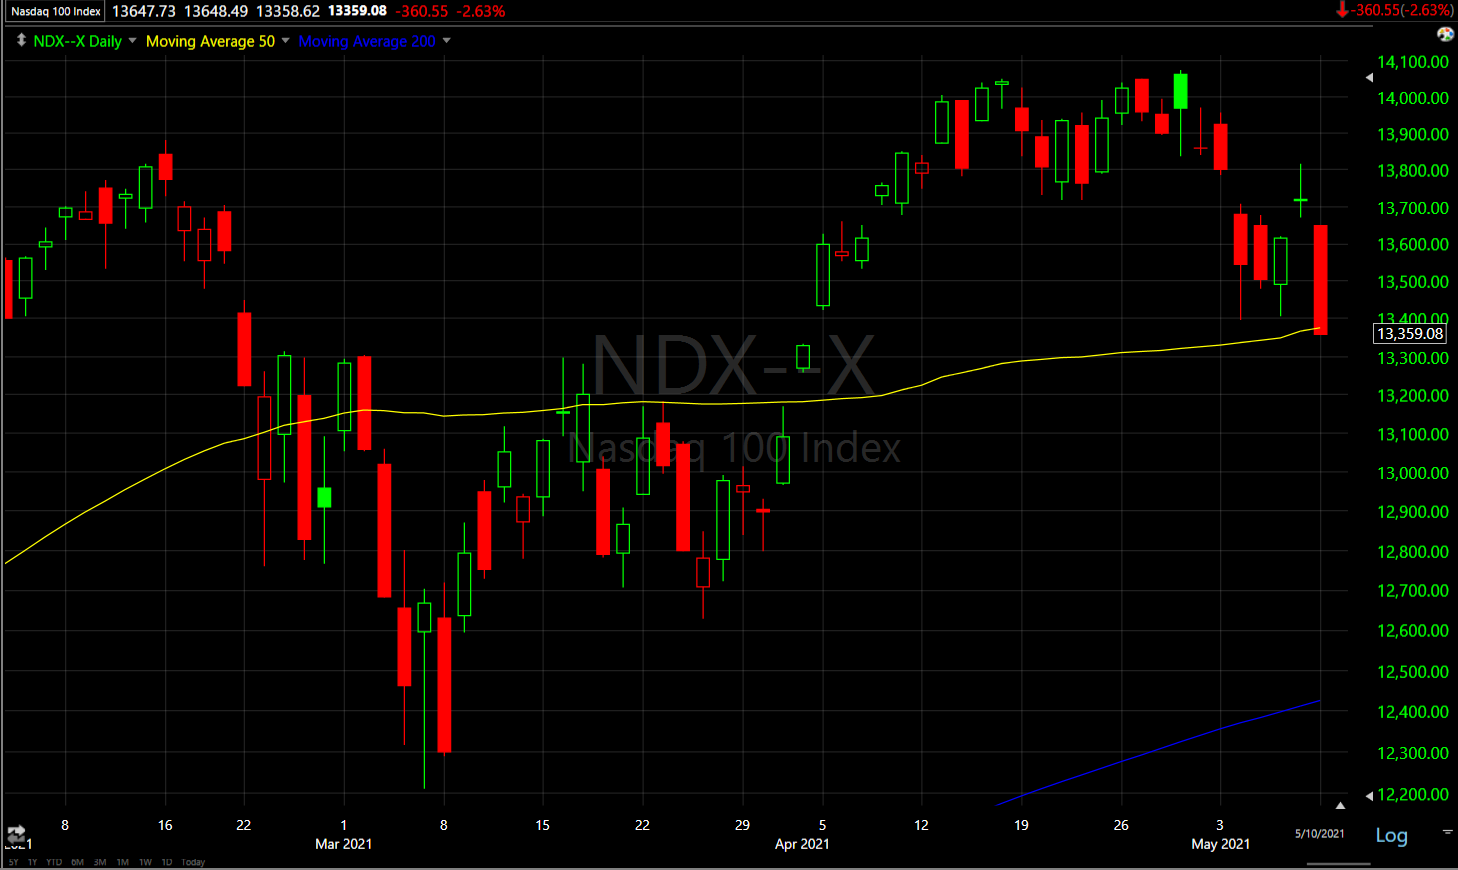 NASDAQ-100 (daily) closed just below its 50-day and at the lows of the day, but it was not a decisive break below the technical level.
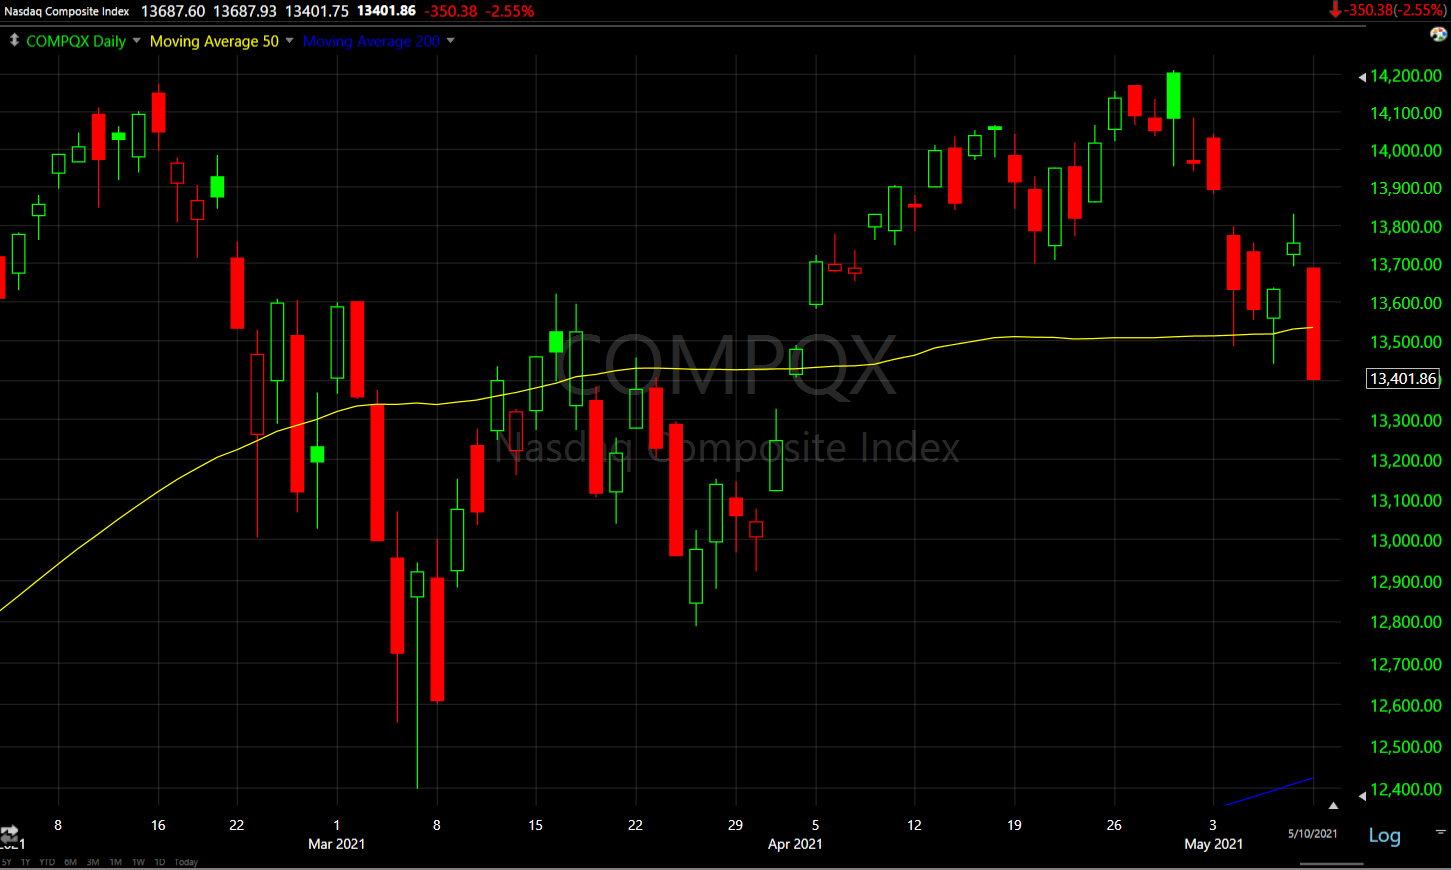 After having found support there last week, the broader NASDAQ Composite (daily) closed below its 50-day for the first time since March.
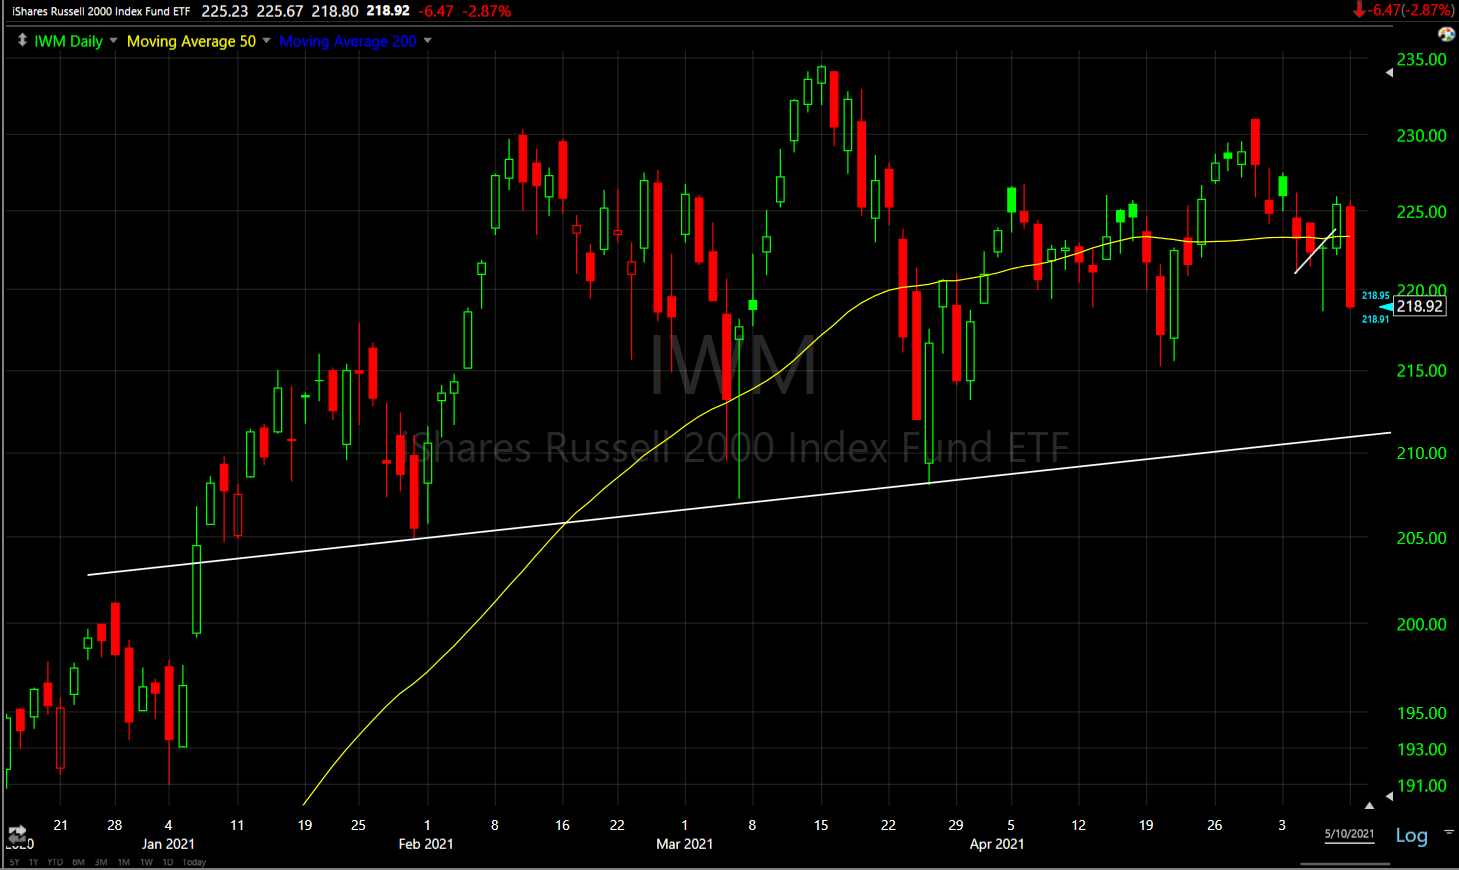 Small Cap IWM (daily) has been trading along its 50-day for nearly 2 months with a close below today.
 EEM/Emerging Markets (daily) closed below their 50-day (yellow).
There was a very brief unusual move in volatility’s term structure right at the open (sliding toward backwardation).

SP-500 (2m) and vol’s term structure flattening at the cash open (red).
After the Absolute Breadth Index traded below 15 last week (13), VIX displayed relative strength out of the gate today and ended higher by +17.8% to confront its 50-day sma and the $20 area that has provided resistance.
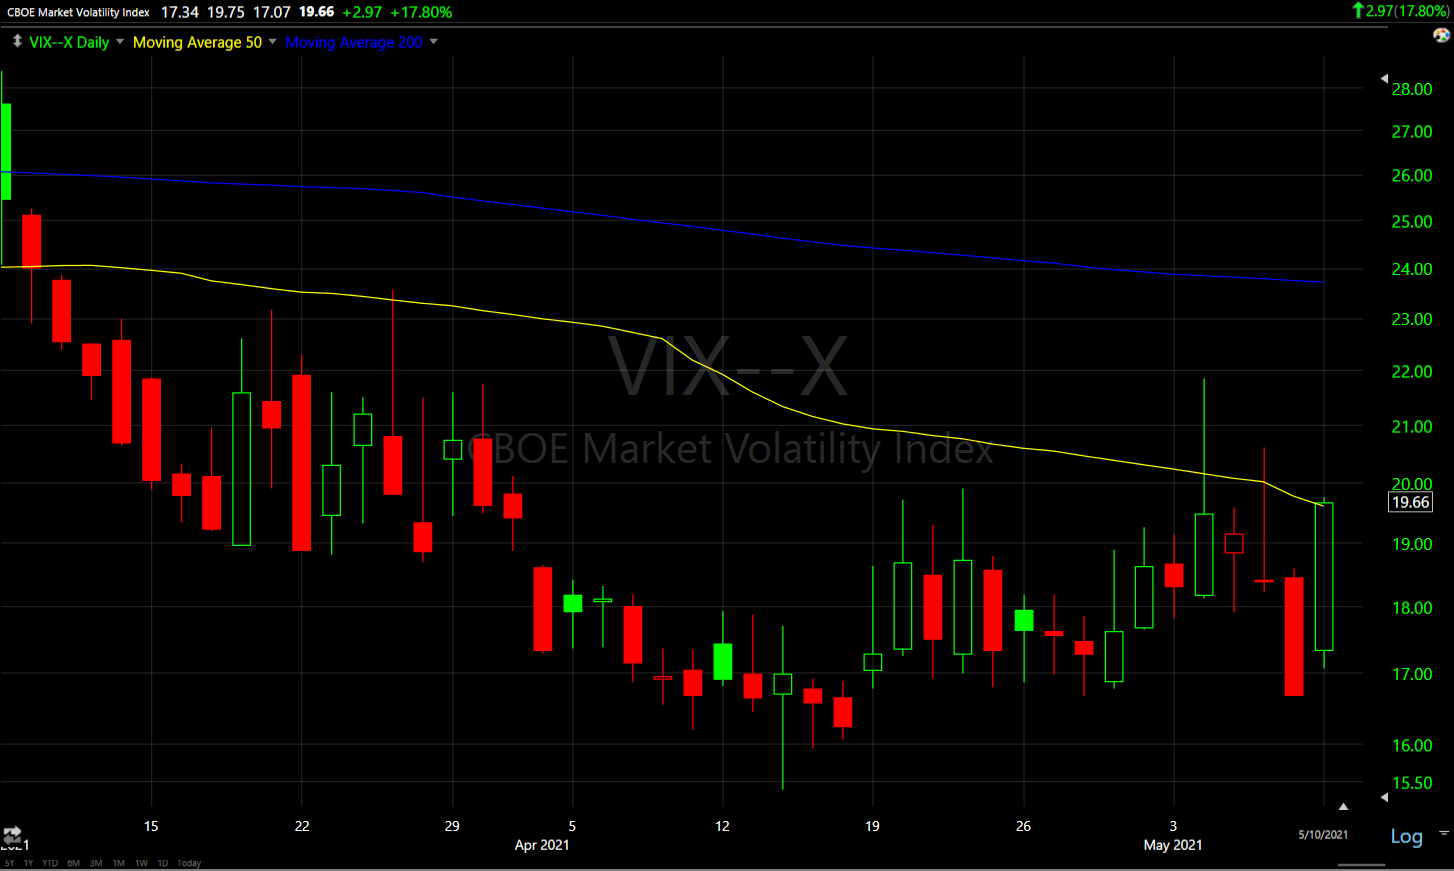 VIX (daily) with 50-day sma (yellow) and 200-day (blue).
*The Absolute Breadth Index traded down to 13 again today, signalling a decent probability that Volatility jumps over the next month, although VIX already jumped double digits (percentage terms) today.
S&P sectors
The day started with a cyclical bias as Energy and Materials were the best performing. As the day wore on, that bias turned defensive with Utilities and Consumer Staples performing best. The entire day the mega-cap heavy sectors (Technology, Consumer Discretionary and Communications) underperformed notably starting in pre-market.
Pressuring large-cap Tech before the open, Citigroup posted a rare downgraded of Alphabet (GOOG -2.4%) and Facebook (FB -4.1%) to Neutral from Buy. Also The Wall Street Journal reported that the Pentagon is considering scrapping the $10 billion JEDI cloud contract that was awarded to Microsoft (MSFT -2.1) amid litigation from Amazon (AMZN -3.07%). An uptick in long term bond yields didn’t help the cause of large-cap Tech stocks this afternoon.
Although S&P sectors are about split between advancing and declining, the cyclicals that led the way early on barely closed green (Energy and Industrials).
Materials ⇩ -0.44 %
Energy ⇧ 0.04 %
Financials ⇩ -0.08 %
Industrial ⇧ 0.09 %
Technology ⇩ -2.52 %
Consumer Staples ⇧ 0.76 %
Utilities ⇧ 1.01 %
Health Care ⇧ 0.13 %
Consumer Discretionary ⇩ -1.78 %
Real Estate ⇧ 0.45 %
Communications ⇩ -1.92%
Both the mega-cap secular growth-heavy sectors like Tech, and the cyclical/value sectors like Materials, ended the day weak.
 Technology sector (daily) ended just below the 50-day sma (yellow). This isn’t a definitive break down of the 50-day, but the afternoon trade displays technical traders’ risk aversion in not stepping in to buy the dip to a technical level (50-day).
The mega-cap stocks had reason to trade poorly today before the open.
AMZN dropped 3% as it issued upside $18.5bn debt…
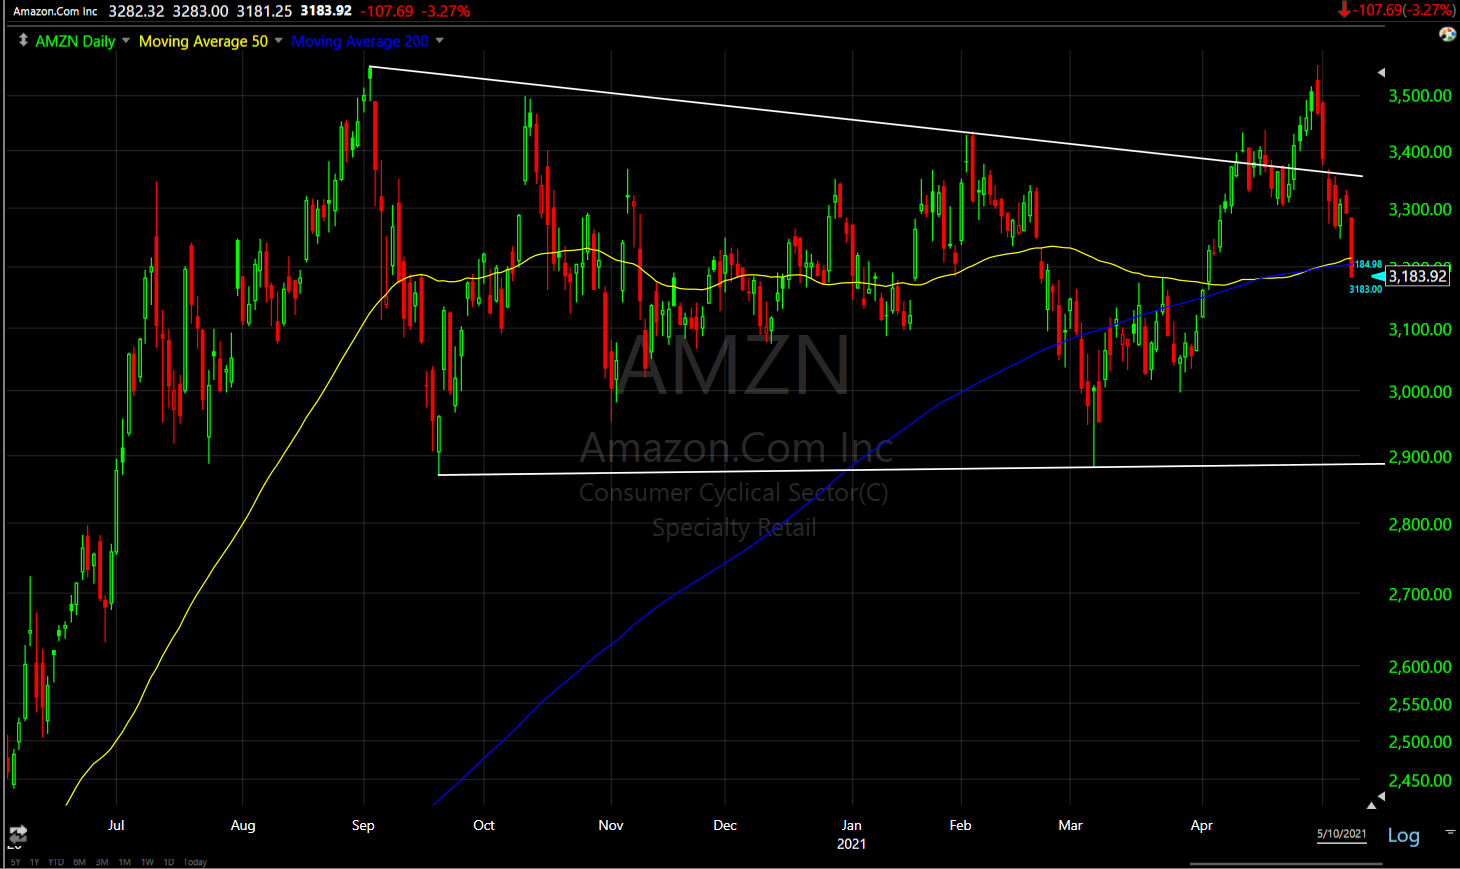 AMZN (daily) looks like another example of a failed breakout (bull trap), now starting a fast reversal as price closed below both the 50-day (yellow) and 200-day (blue) sma’s.
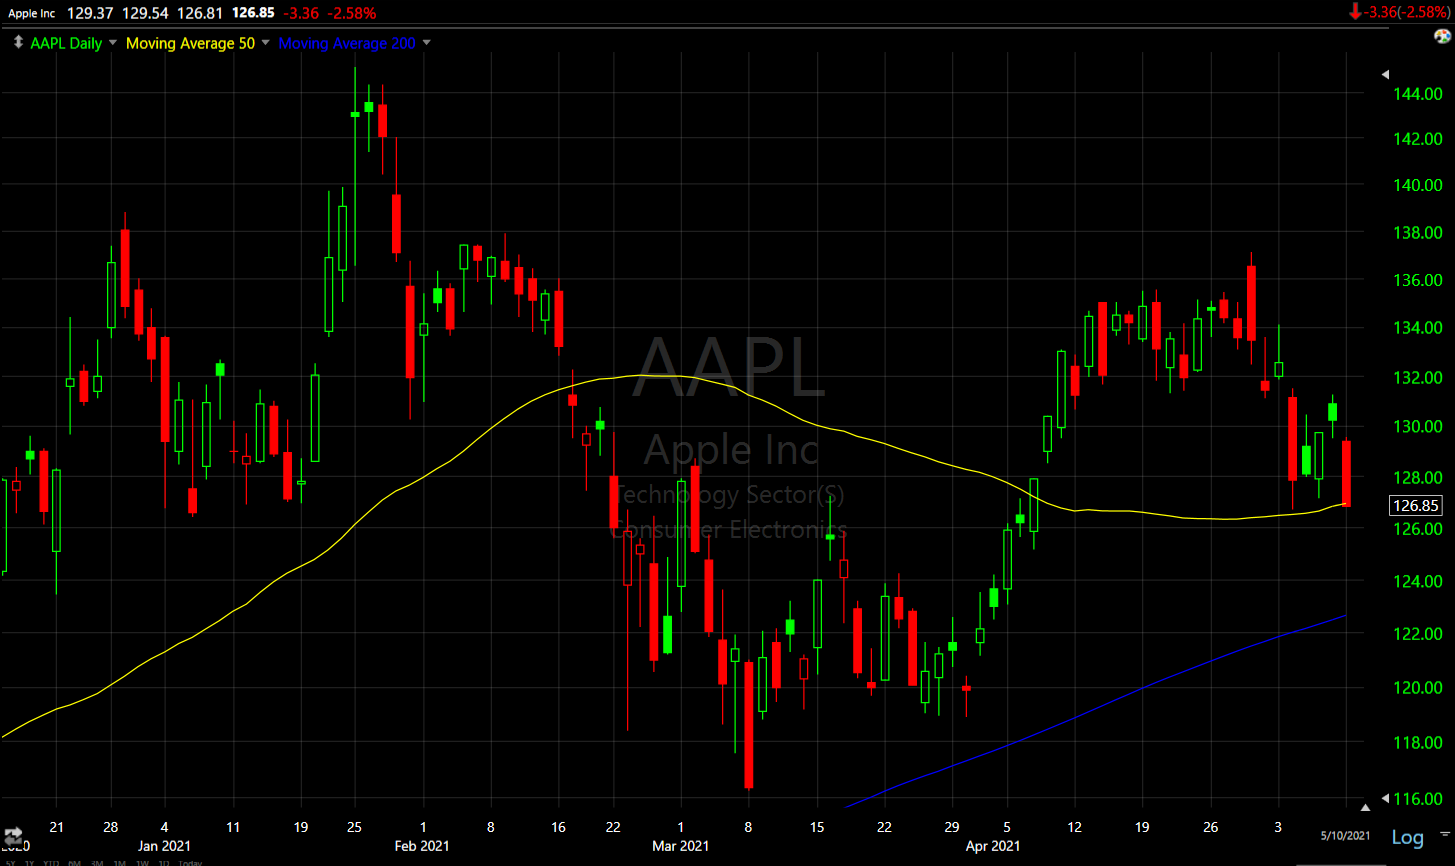 Apple / AAPL (daily) lost -2.6% and closed near its 50-day at sesion lows.
In the Early Update I warned that the S&P’s breakout above the range last week was at risk because the heavily weighted mega-caps that have single-handedly lifted the market for years, were not confirming the S&P’s breakout…
“SP-500 (15m) and an equal weight index of mega-cap stocks. Anyone who has invested or traded over the last decade knows how influential these stocks are. A handful of them alone have carried entire market rallied for years, so the fact they are not participating (note how S&P broke our above the range while ega-caps made a lower high) could be a problem for the benchmark S&P as it relates to holding above this near month long range it has broken out above.”
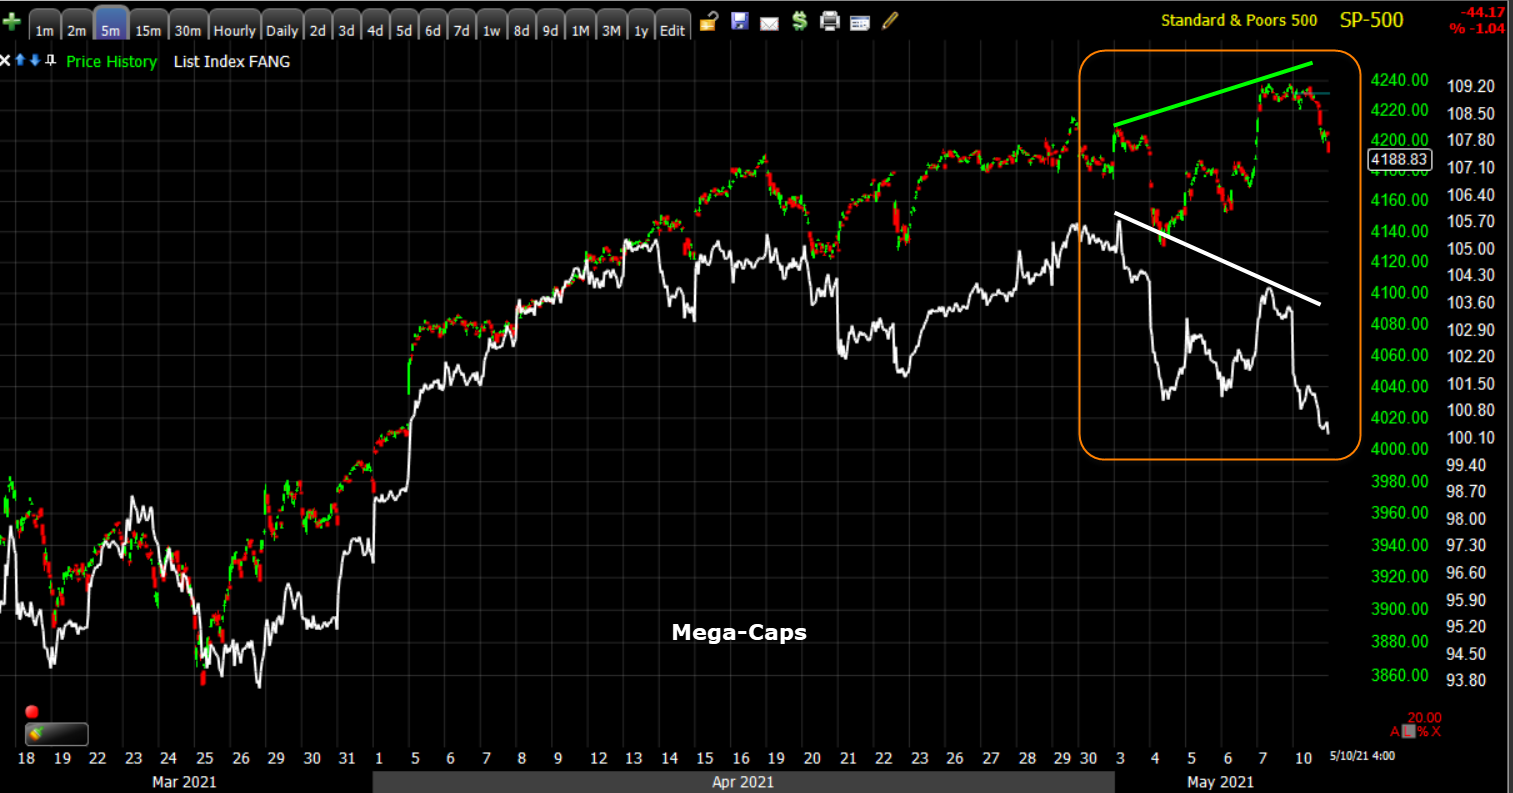 SP-500 (5m) breakout above its 3 week range was not confirmed by an equal weighted index of mega-cap stocks (FB, AMZN, AAPL, NFLX, GOOG, MSFT) in white.
In the Technology sector, Semiconductors – which tend to be a canary in the coalmine and lead the Technology sector – displayed increasing and notable relative weakness in recent days.
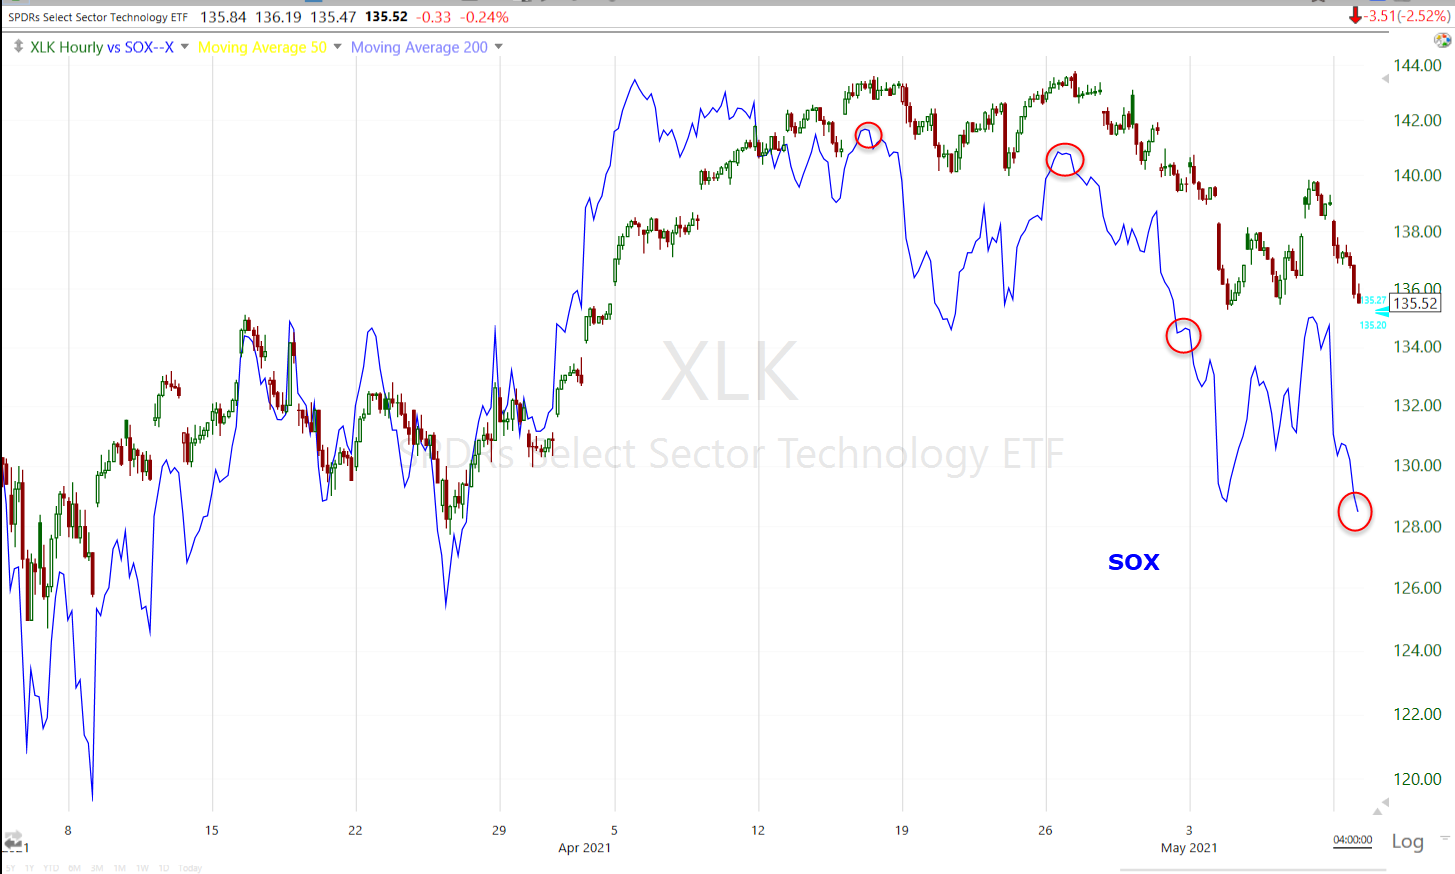 Tech sector (60m) and Philly Semiconductor Index (blue) displaying relative weakness (lower highs and lower lows in red).
The SOX closed lower by -4.66% and slid below the 50-day sma.
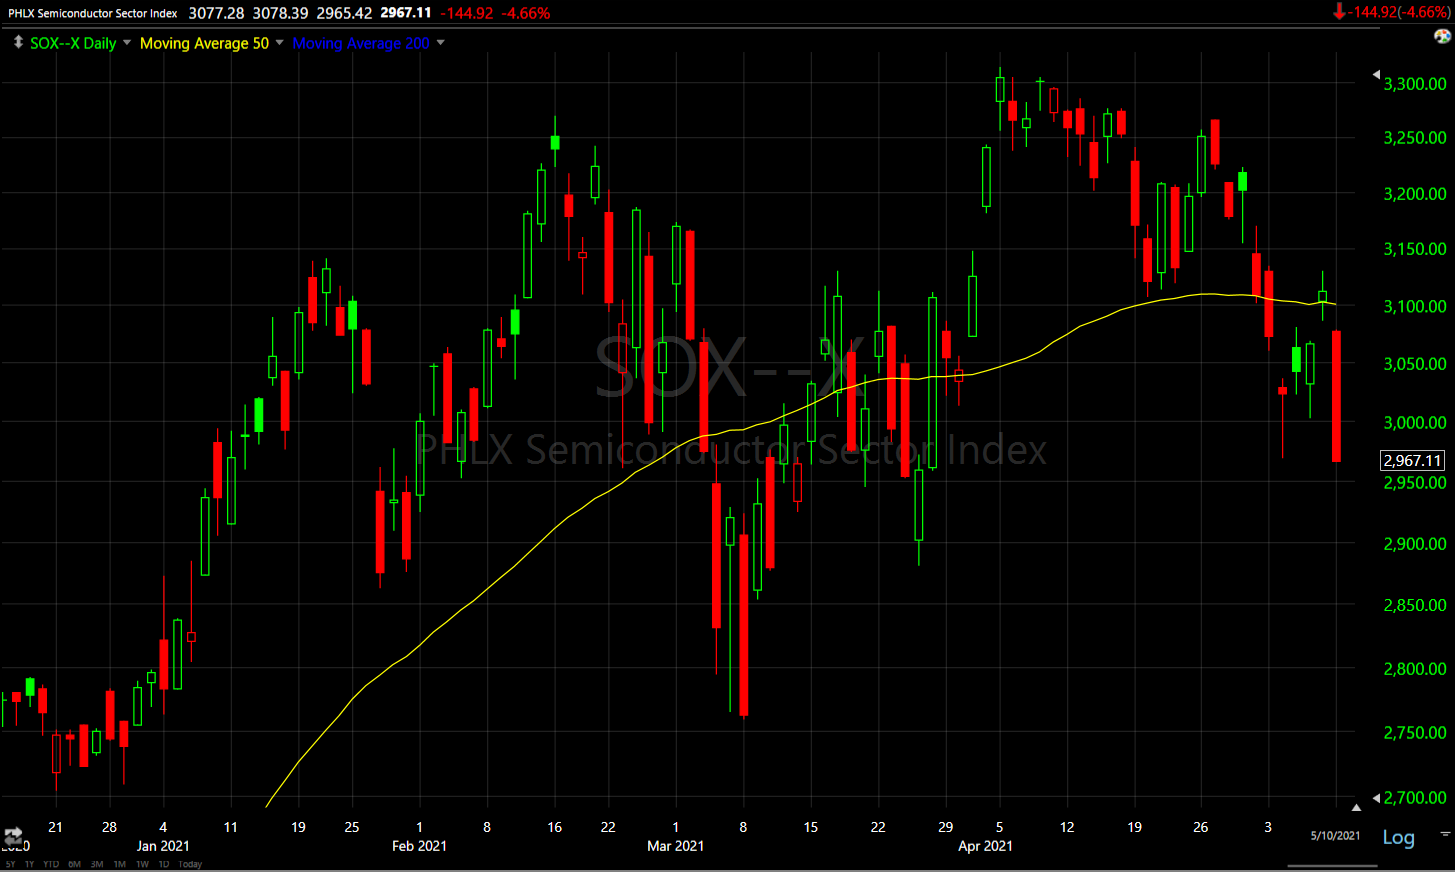 SOX Index (daily) met resistance at the 50-day Friday and tumbled to close below today.
Rising yields from mid-morning were an additional headwind certainly contributing to the afternoon weakness in the group.
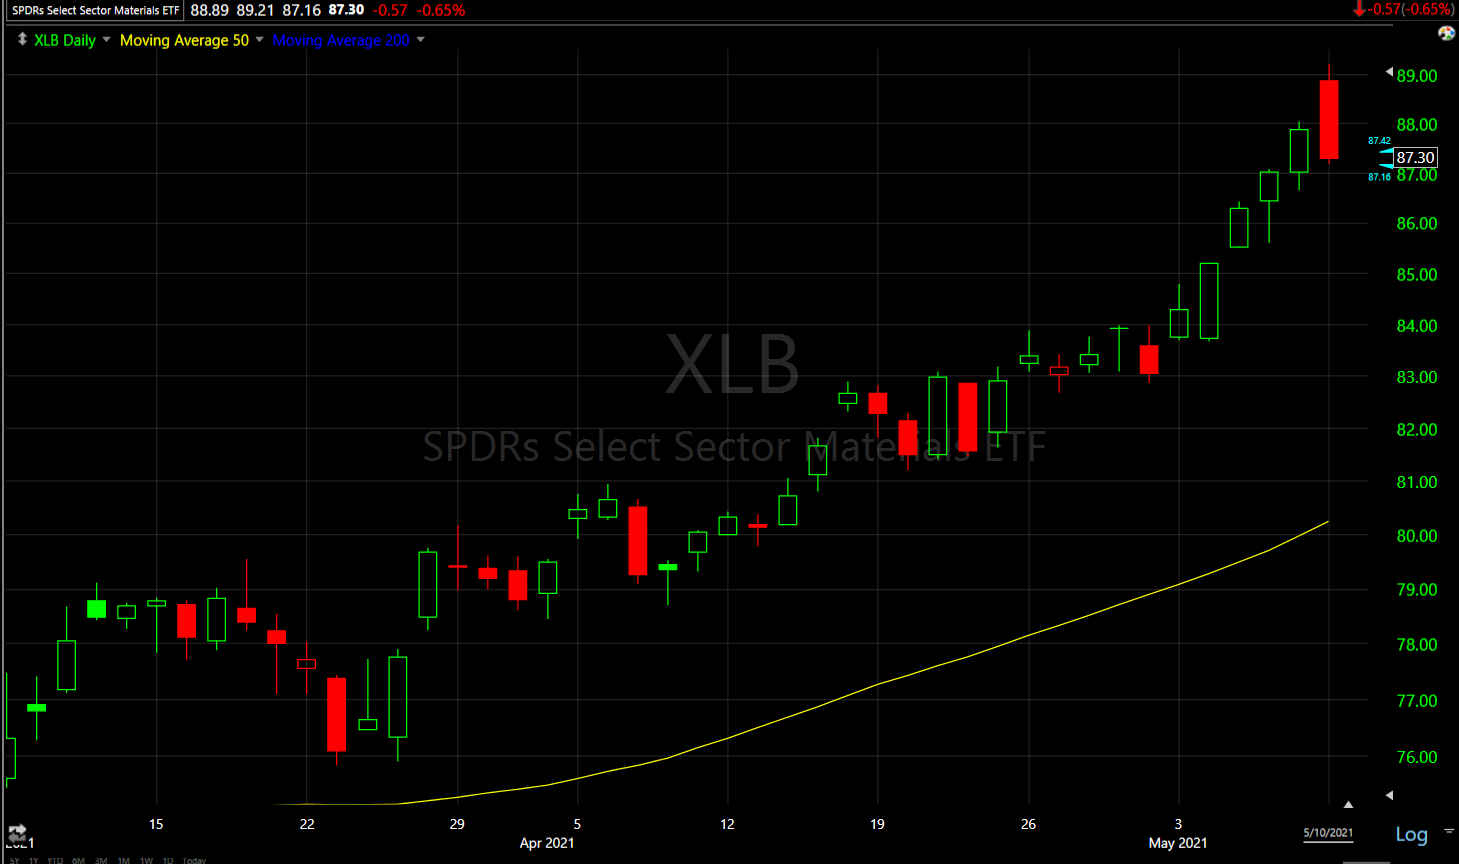 Materials sector (daily) started he day higher with commodities, and had a negative reaction to the price weakness in commodities this afternoon. The sector ended the day with a bearish dark cloud cover candle (open above Friday’s close, and close below Friday’s close and well into Friday’s opening/closing range) as well as at session lows which is never a good look.
Internals
NYSE Decliners (2233) edged out Advancers (1071) by a 2-to-1 margin on heavier Volume of 998.2 mln shares.
The price/volume relationship was not dominant, but leans toward Close Down/Volume Up (1-day oversold).
Internals lean toward 1-day oversold due to decliners 2-to-1 over advancers and the price/volume relationship leaning toward 1-day oversold. S&P sectors did not have a clear majority closing lower which prevents a solid 1-day oversold condition.
 SP-500 (15m) and NASDAQ-100 advance/decline line not confirming the S&P’s breakout.
SP-500 (15m) and the broader NASDAQ Composite Advance/Decline line deteriorating since mid February, which is when yields jumped at a higher rate of change amid inflationary pressures and concerns.
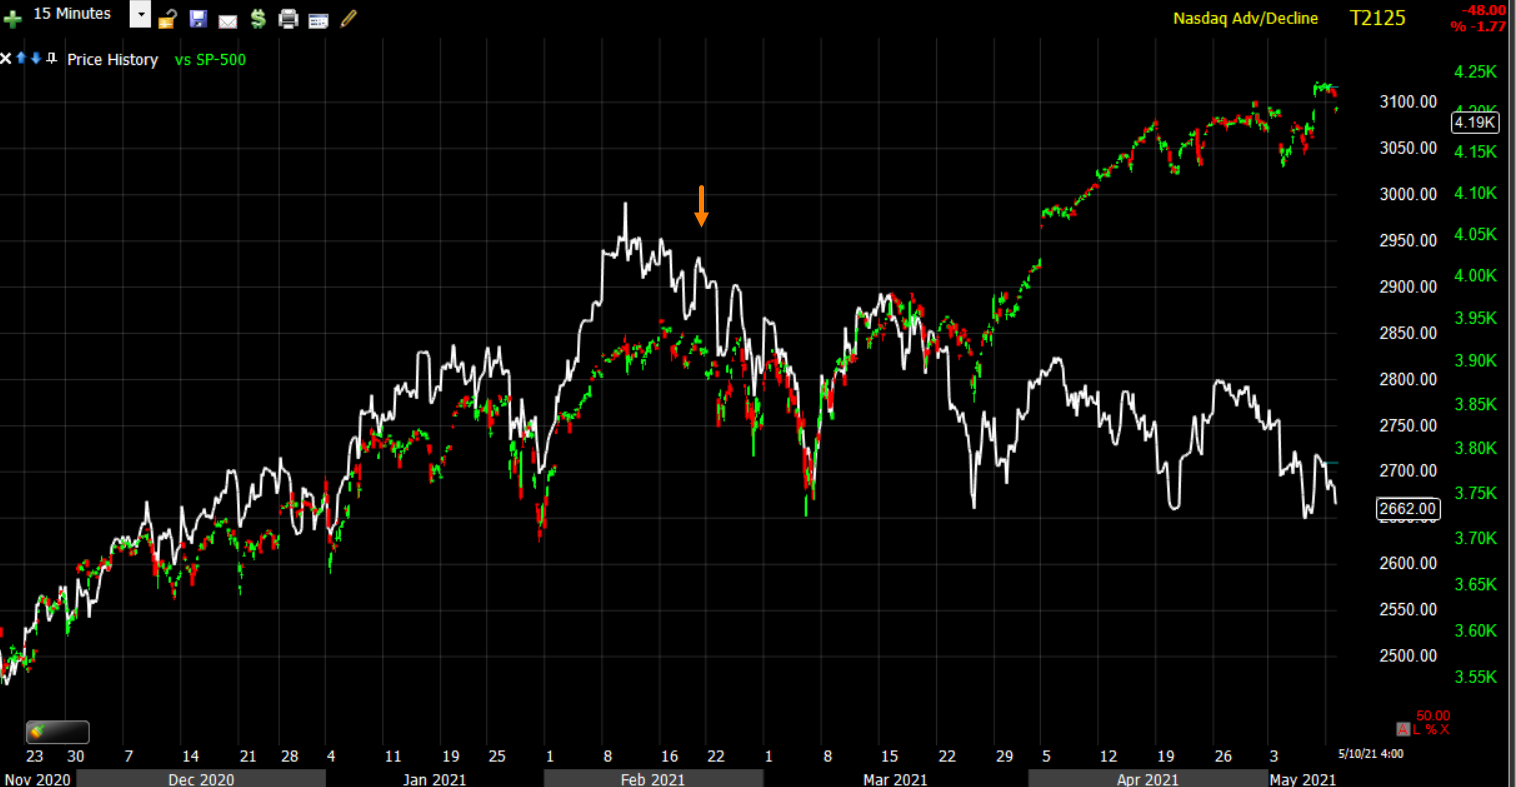
 SP-500 (daily) and NYSE new 52 week lows surging today, but the real yellow flag is the rising trend of 52 week lows into each of the S&P’s rallies off the bottom of the lateral range. New lows should never increase as the benchmark index rallies (orange arrows), they should decrease. This is yet another sign of waning participation among equities. Notice that new NYSE 52 week lows jumped to their highest of each bounce as the S&P traded above the range (yellow arrows). That’s certainly not a good sign on a breakout attempt from the range.
, Treasuries
Bonds have not been acting as I’d expect over the last week. Last week inflationary data didn’t produce any gains in yields, nor did the surge in commodities. Today the inflationary impulses from commodities started to fade, yet long-end bond yields (30y) surged for a second day. Part of the gains in yields today may be related to the large Amazon bond issue.
The 2-year yield increased one basis point to 0.15%. The 10-year yield was down 1 bp in the morning and closed up two basis points to 1.60%. The 30 year yield which jumped 4 bp on Friday, gained another 4 basis points today to 2.32%.
That said, in my view yields should have been much higher already, not just due to the inflationary data, but the inflationary macro signals from commodities…
 10-year yield (60m) I’ve redrawn the trend lines to account for recent action. I’d view a move above 1.65% as a breakout from this consolidation/channel.
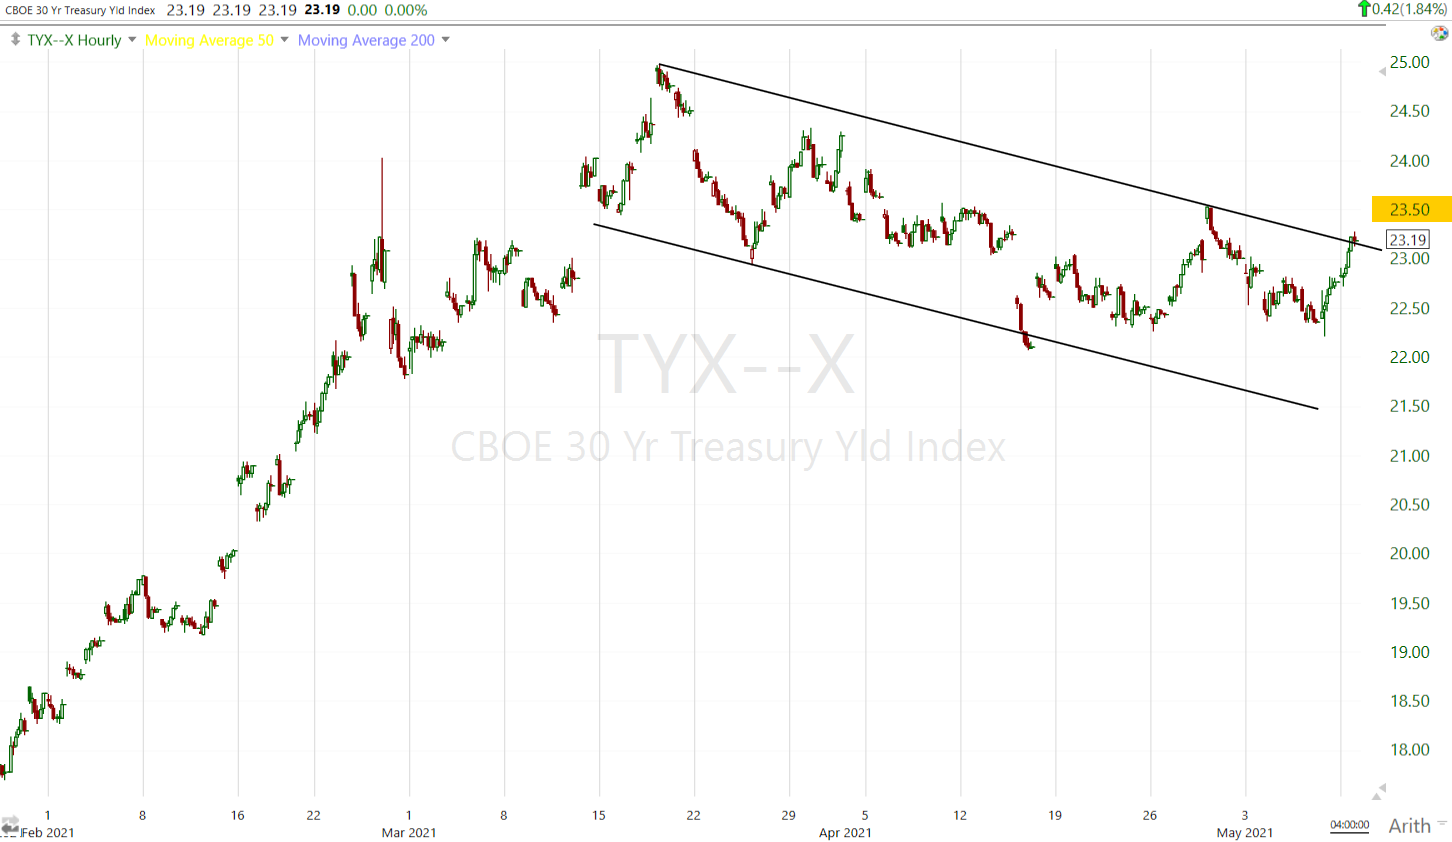 30-year yield (60m) I’m looking for a move above 2.35% to confirm a solid breakout from the channel.
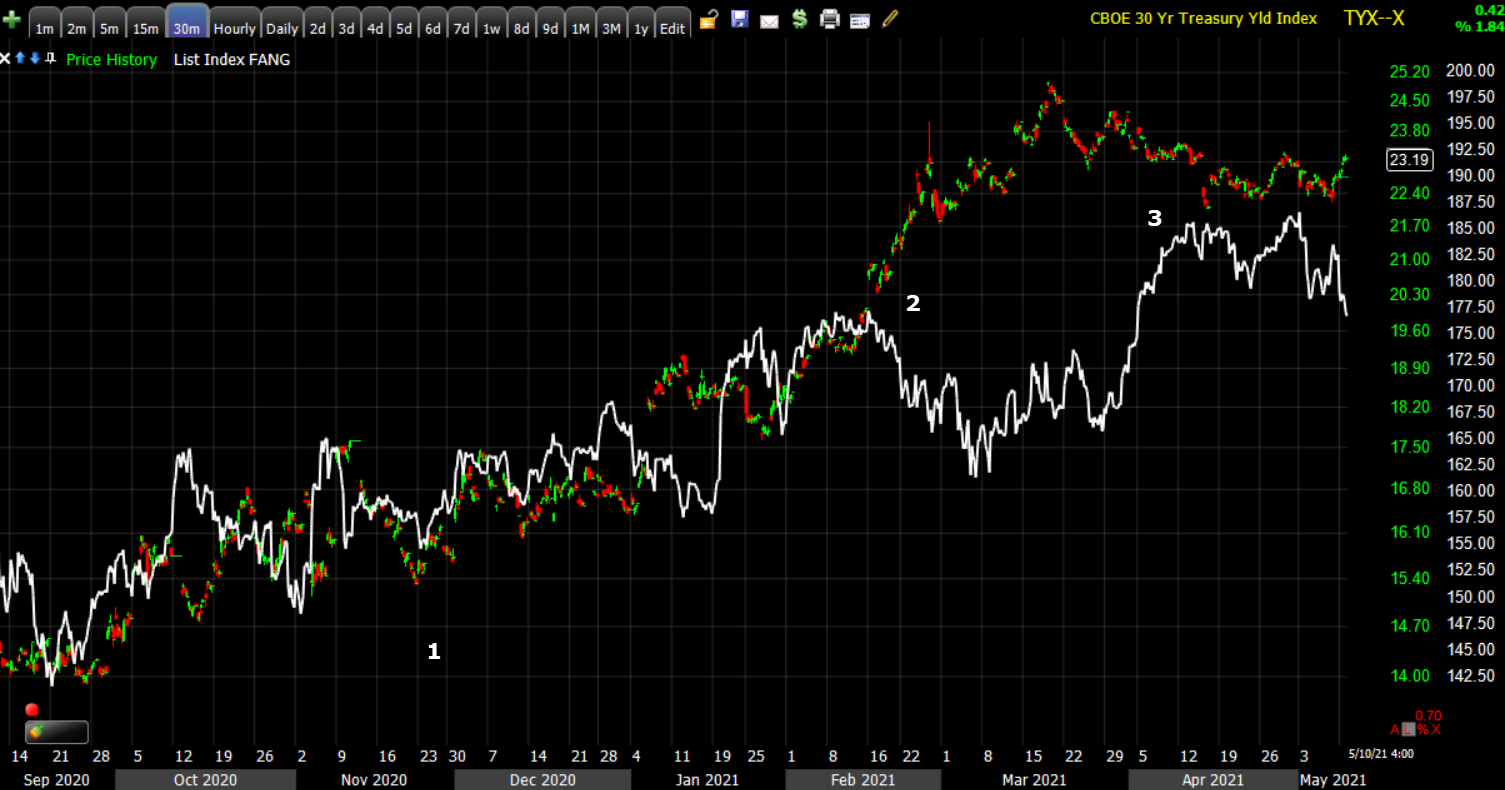 This chart shows the 30-year yield (candlesticks) and the mega-cap index (white). At 1) yields were rising slowly and methodically indicating growth prospects as the economy re-opening accelerated, but in February 2) yields jumped at a much faster rate of change and growth stocks were sold in Q1. At the start of Q2 in April the pull back in yields opened the door to some rotation from Q1 favorites (cyclicals) to Q1 laggards (mega-cap growth stocks) in some start of the quarter rebalancing. If yields break out to the upside, it seems pretty clear that these growth stocks are going to get hit again as stock valuations have soared to record levels.
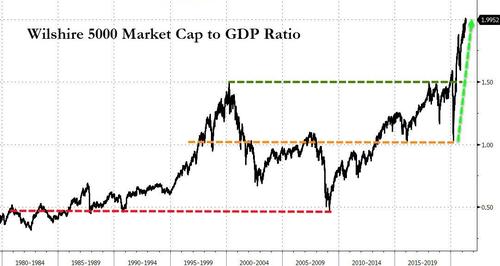 One metric of record equity valuations…
Credit…
 While not a divergence that jumps off the chart, High Yield credit (blue) did not confirm the S&P-500’s (15m) breakout above the range last week as credit posted a lower high.
Currencies and Commodities
The U.S. Dollar Index was little changed at 90.22, but traded red for the year.
 U.S. Dollar Index (4 hour) is still above the February low, but the ongoing decline has weakened the dollar’s near term to sub-intermediate term outlook. The price action at the white trend line is looking more and more like a large bearish flag.
Commodities carried on as nothing changed with an advance overnight in Steel, Copper and Iron Ore futures, but started dropping into the afternoon. In this afternoon’s Market Update-Risk Aversion, it started becoming clear that commodities across the board were acting unusually weak, hinting at a short term top in the works. Lumber futures ended a 13 day win-streak today with the biggest drop since March. Copper futures settled down -0.3% to $4.72/lb after being up as much as 2.8%. Even Wheat futures dropped sharply with the biggest 1-day drop since August 2019.
Commodity price pressures boosted a gauge of inflation expectations to the highest level since 2006. Still with the afternoon weakness, the Bloomberg Commodity Index posted its biggest 1-day drop in over 5 weeks.
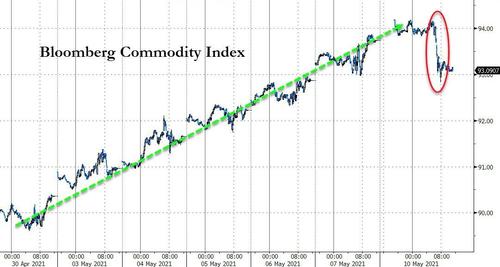 Source: Bloomberg
Energy prices briefly keyed off reopening optimism and the shutdown of the Colonial Pipeline over the weekend, but it was apparent early on that WTI Crude oil was weaker than expected.
“WTI Crude oil (-0.6%) and Gasoline futures (+0.4%) are starting to come down into the cash session, that may weigh on the cyclical leader Energy.” – Early Update
WTI Crude futures closed +0.1% to $64.80 and RBOB gasoline futures settled fractionally lower (-0.02%) at $2.13/gallon after being up as much as +4.2%.
Gold futures gained +0.3% to $1,837.60/oz, as the dollar index at one point this morning fell to late-February lows just above the $90 level.
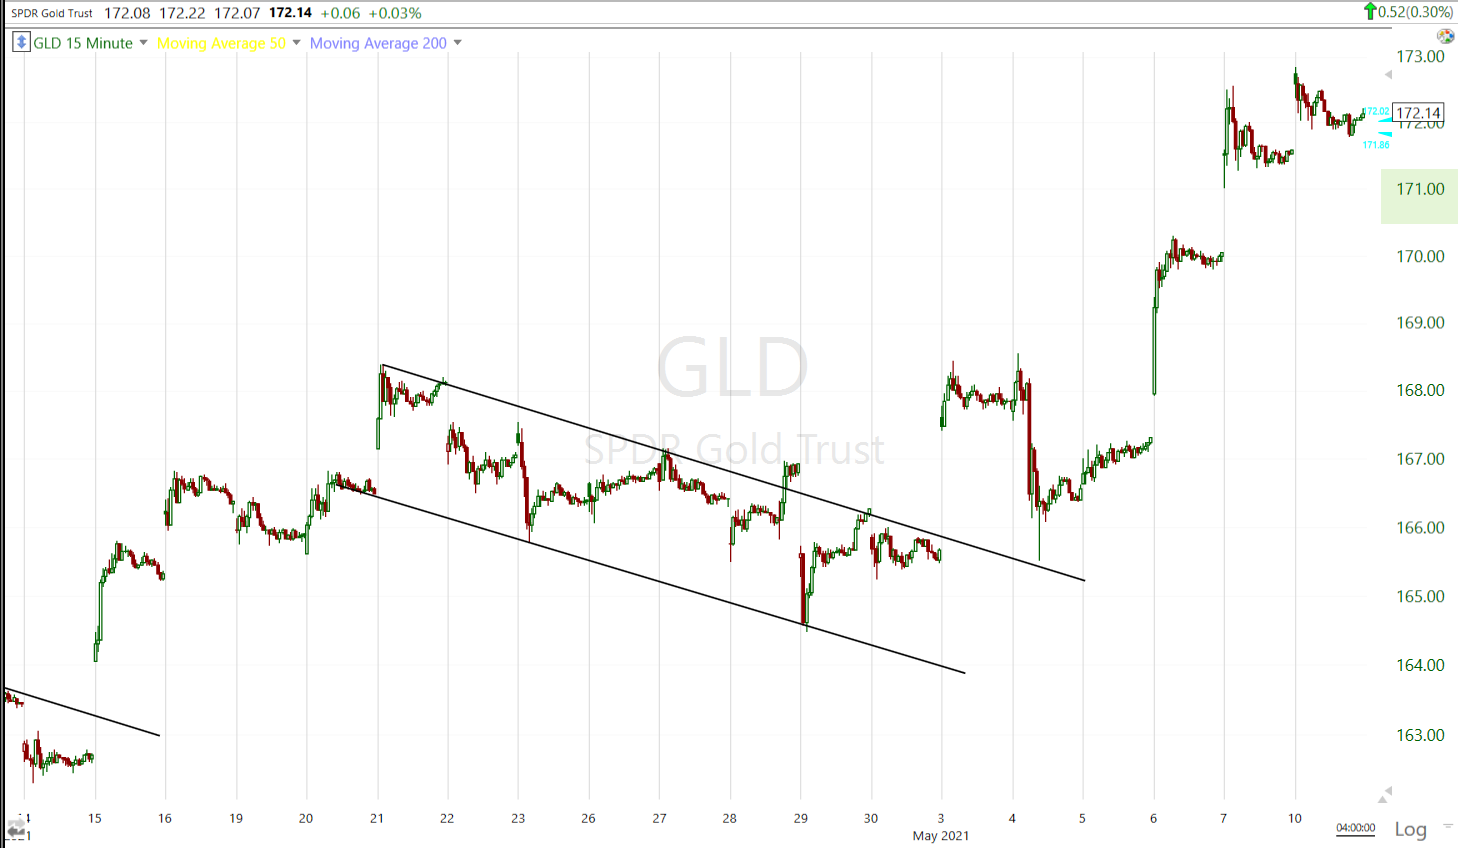 GLD (15m) reached its second leg measured move last week (near $171). Probabilities increasingly favor a correction/consolidation, but gold’s sub-intermediate trend price action remains constructive.
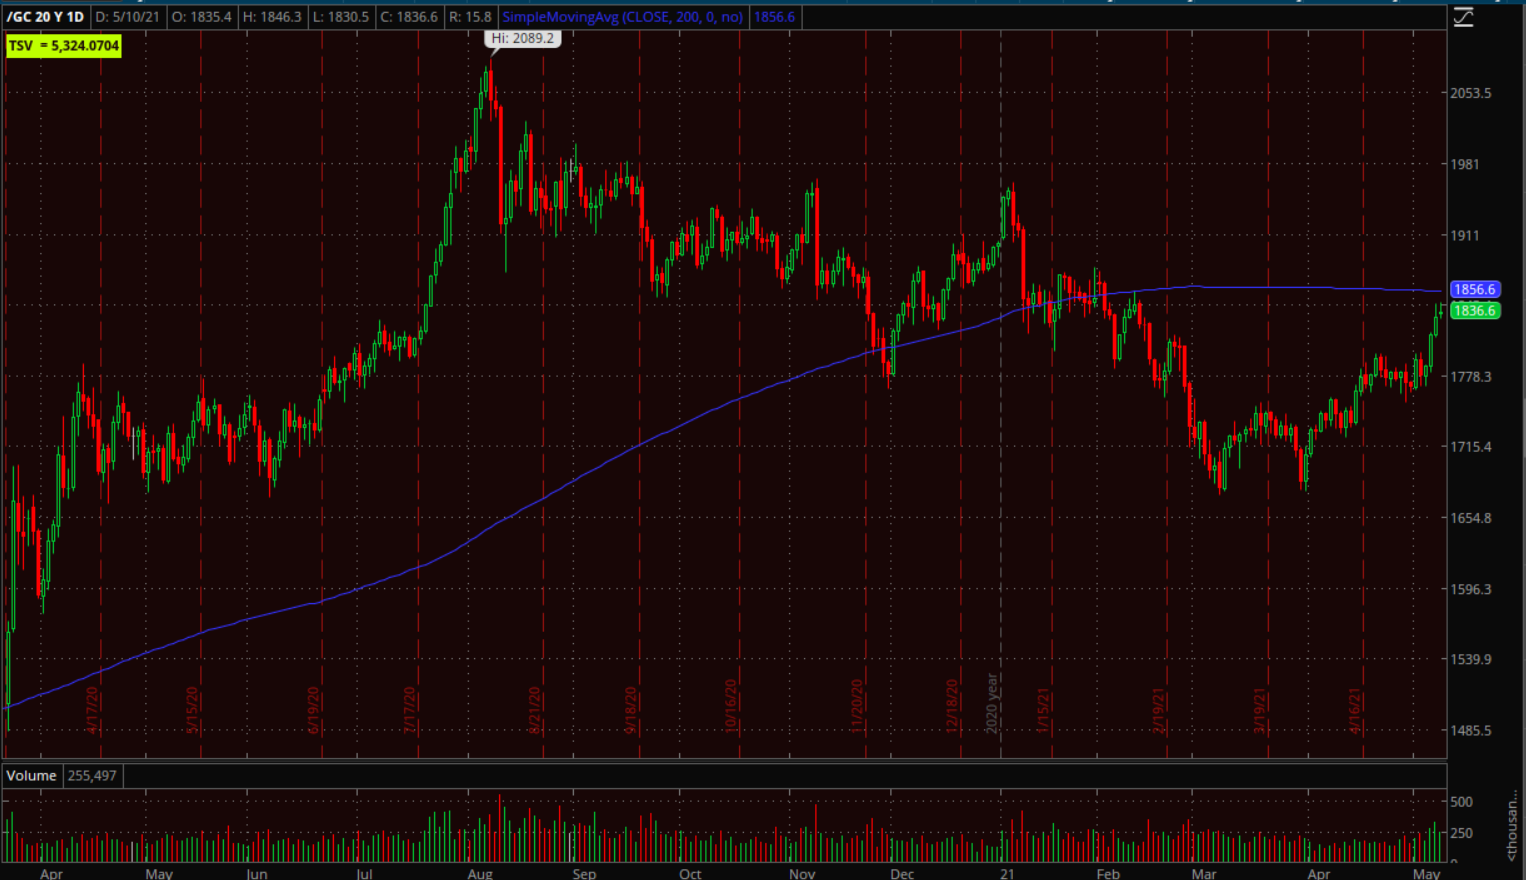 Gold futures (daily) and 200-day sma coming up (technical resistance) which makes it even more likely that gold pauses to correct/consolidate soon.
Cryptocurrencies were mixed with Ethereum outperforming. Bitcoin is still trading around the $56k area…
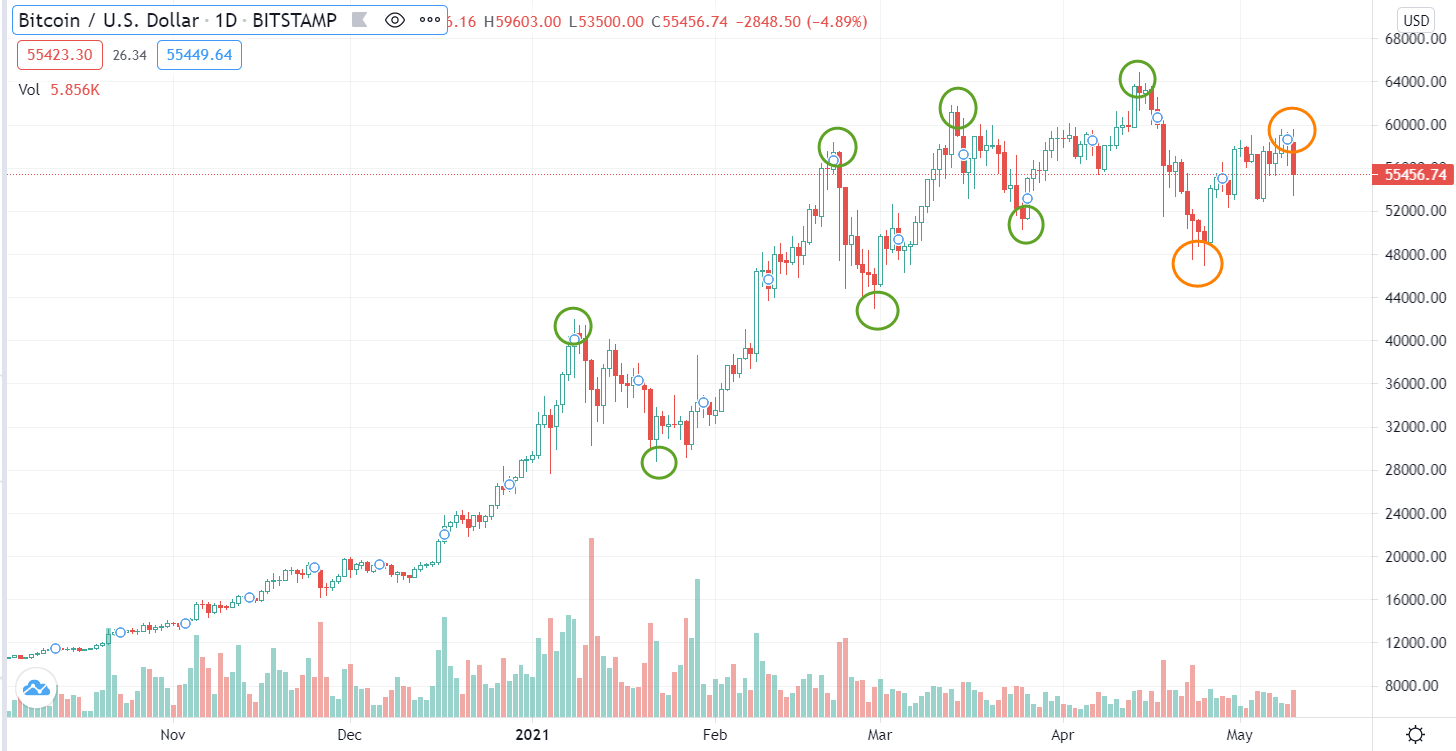 BTC/USD Bitcoin (daily) is entering more of a lateral consolidation range, but the price action has deteriorated to some degree, going from a solid trend of higher highs and higher lows (green) to a lower low and lower high (orange).
Ethereum traded above $4200 for the first time…
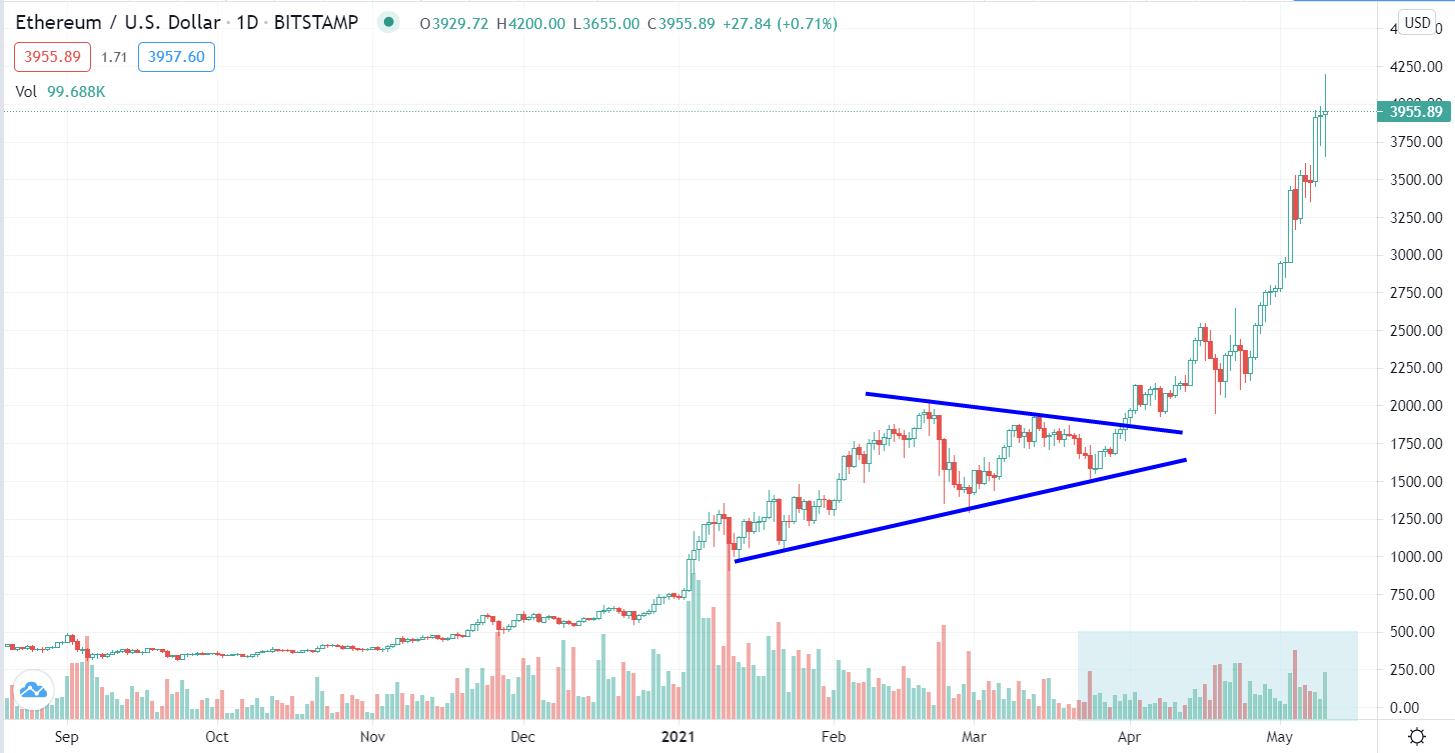 ETH/USD Ethereum (daily)
ETCG started the day higher by at least 15%, but ended -15% lower. ETHE ended +6.2% higher.
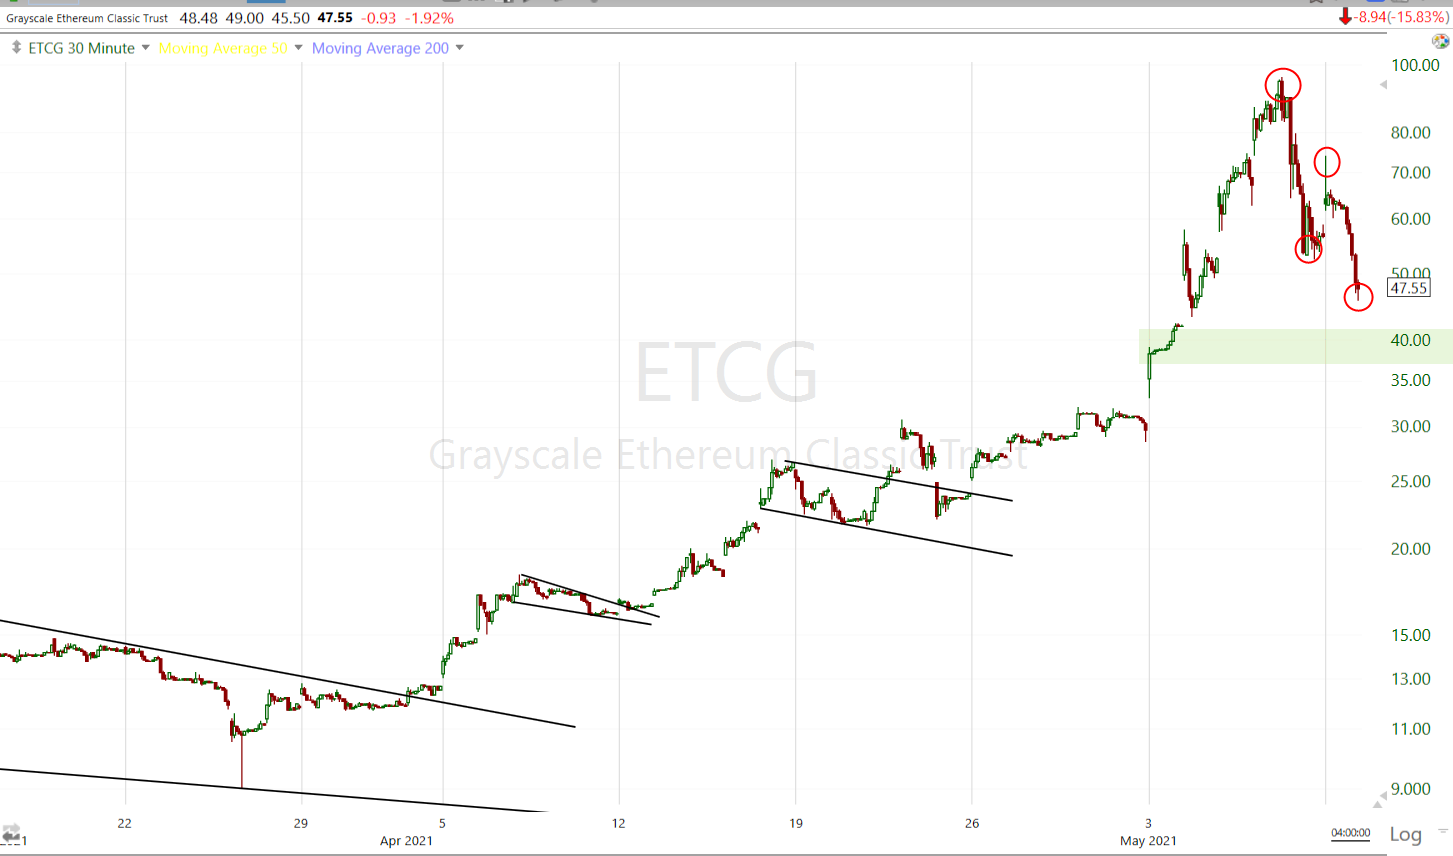 ETCG (30m) still in consolidation/correction mode after blowing past the measured move target last week (green shaded area around $40). It’s not uncommon, even after price blows past a measured move, for price to come back down to correct/consolidate in the area of the measured move and for ETCG that’s around $40 which still represents a 33% gain for last week.
Summary
From a sector perspective, there’s no doubt that S&P 500 Technology, Communications, and Consumer Discretionary sectors (large cap tech) took the brunt of the damage amid weakness in the mega-caps and semiconductor stocks, and led the day’s decline. These stocks/sectors bounced lifting the NASDAQ-100 on Friday helping it fill last Monday’s gap, but also running into overhead supply in the form of the month-long lateral range. The early pre-market news sparked their weakness and rising bond yields into the afternoon accelerated the weakness.
 NASDAQ-100 (30m) filled the gap on Friday (green circle), but faded there with lots of overhead supply from the range. Prices closed below last week’s low, although not an impulsive break yet, it’s not a pretty close and there are several gaps below that will attract price just as the upside gap did on Friday. I think probabilities favor rising bond yields at the long end and that’s been a clear headwind for the NASDAQ-100 and large-cap Tech. The only scenario I see that they may get some support is if it appears as if the inflationary impulse and growth prospects fade and investors rotate from cyclical/value back to the relative safety of the large, liquid, secular growth tech stocks.
If you didn’t pay attention to commodities you might think that these three sectors soured risk sentiment across the board this afternoon, but it was in fact commodities’ weakness this afternoon that brought down the cyclical sectors (and the averages) and shifted investor positioning to defensive sectors despite falling bond prices. The rise in bond yields smells a lot like the inflationary fears that the equity market has recognized and reacted to in both economic data and the surge in commodity prices, but bond yields acted strangely for a week with no reaction. This may be a delayed reaction. Remember that the Copper:Gold ratio has been leading yields higher.
There are quite a few averages, sectors and heavily weighted influential stocks like Apple at key technical zones (i.e. 50-day), but I’m increasingly concerned that the S&P-500 is at increased risk of a bull trap/head fake, which often leads to fast reversals (down in this case). We already saw a more muted version of this just last week after a failed breakout above the 3 week range at the end of April in the S&P, and a more extreme example in the NASDAQ-100 for the same reason (failed breakout at the end of April).
 SP-500 (15m) this could be the second head fake or failed breakout in as many weeks. Because the breakout Friday was more substantial, it has a higher potential of creating a bull trap as more traders likely chased the breakout Friday.
3C charts look a lot like the divergences in market breadth and, if anything, bolster the case for a failed breakout.
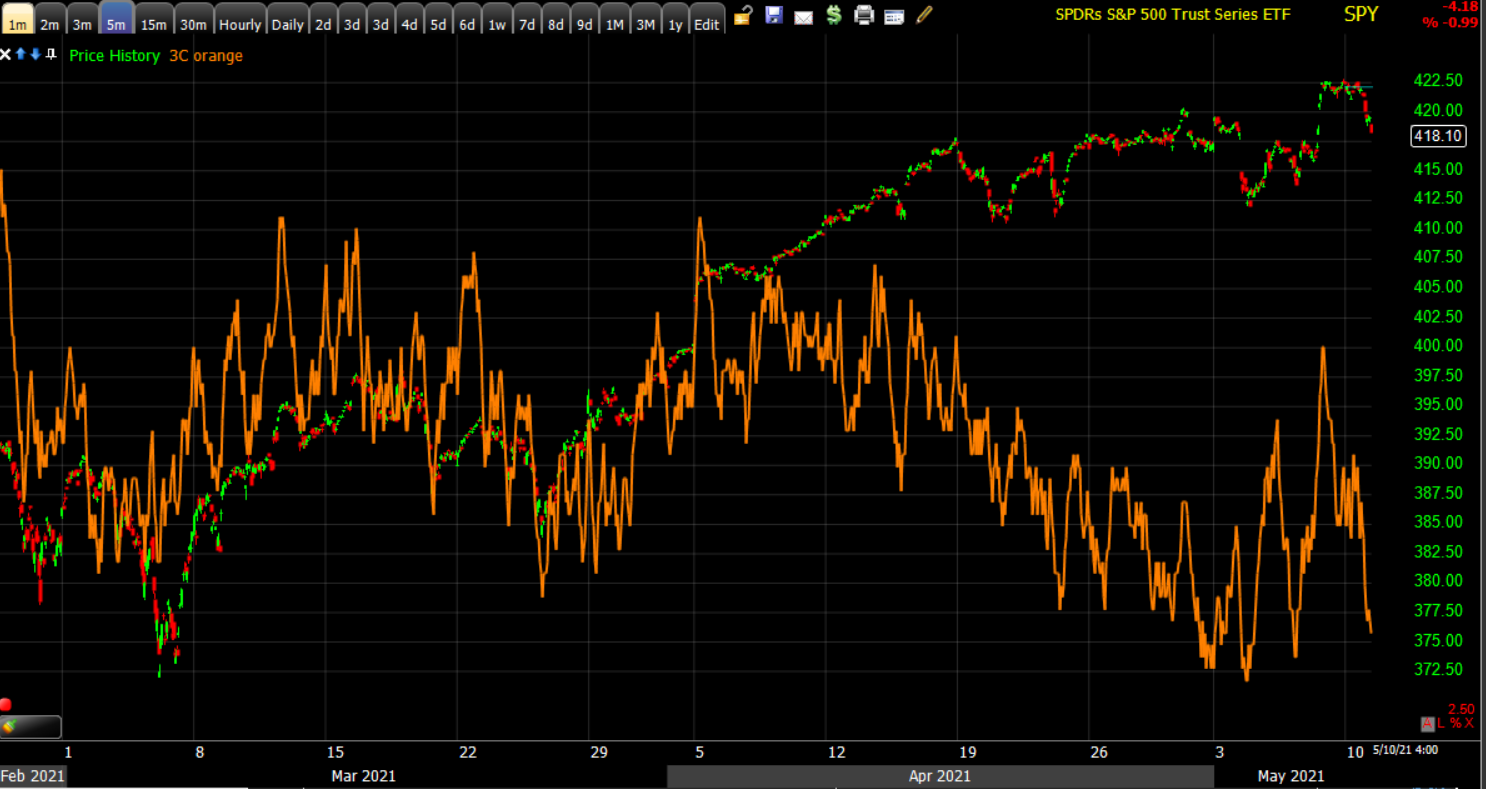 SPY (5m) negatively diverged into the start of the lateral range and then led lower. There was some improvement in 3C on Friday, but not enough to confirm the breakout. What raises yellow flags for me is that more and more timeframes are saying the same thing, and not just in SPY, but S&P futures which trade with completely different volume (3C is based on price and volume), yet they’re saying the same thing.
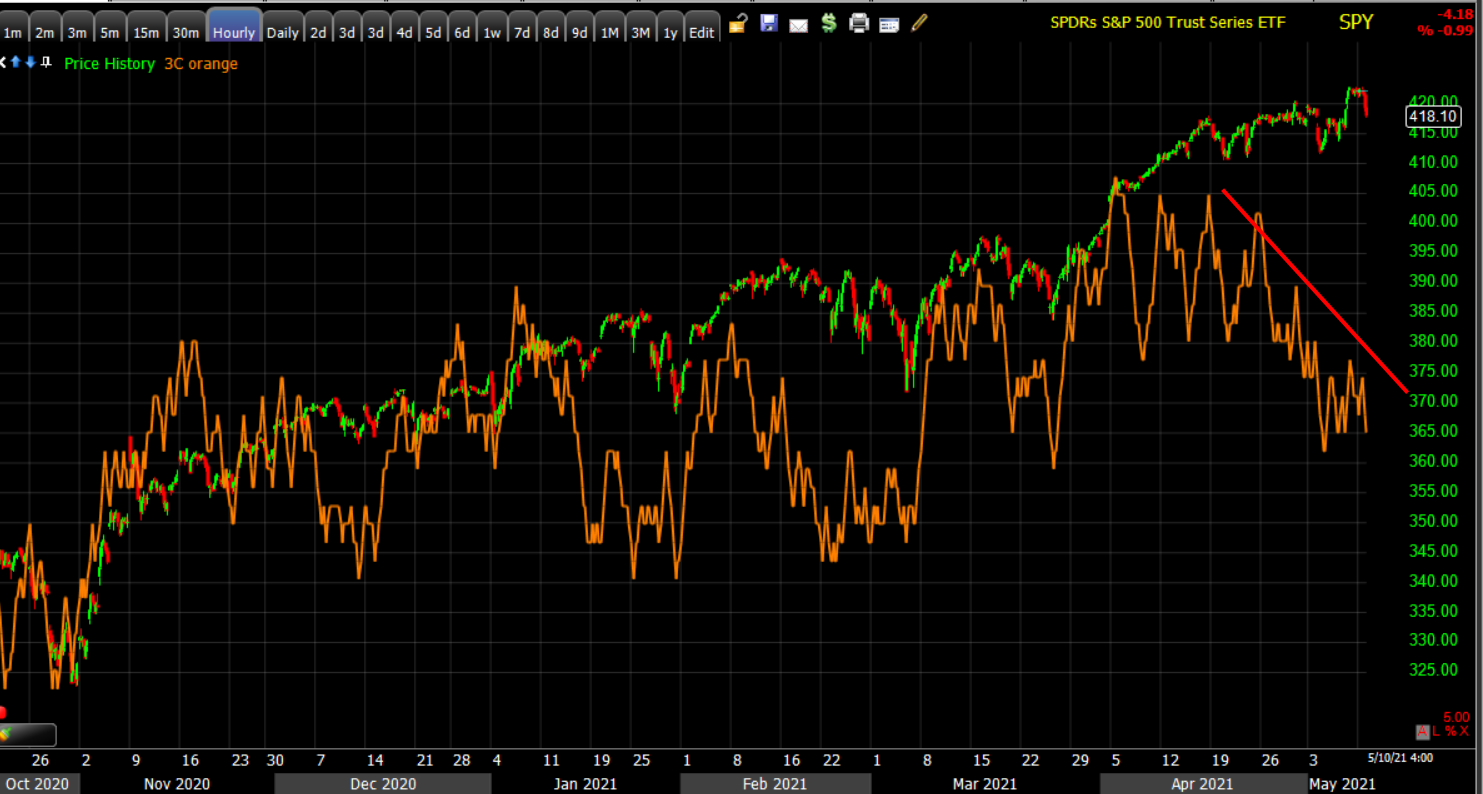 SPY (60m) is a strong timeframe that is more trend oriented so it doesn’t pick up on as many pivots, but when it diverges it’s a more substantial and meaningful signal.
 S&P futures 60m and (4h above) are negatively diverging from the same time, into the start of the earnings season lateral range, and leading lower since. Again, this is a meaningful timeframe and signal.
It’s not just the S&P, but NASDAQ-100 too.
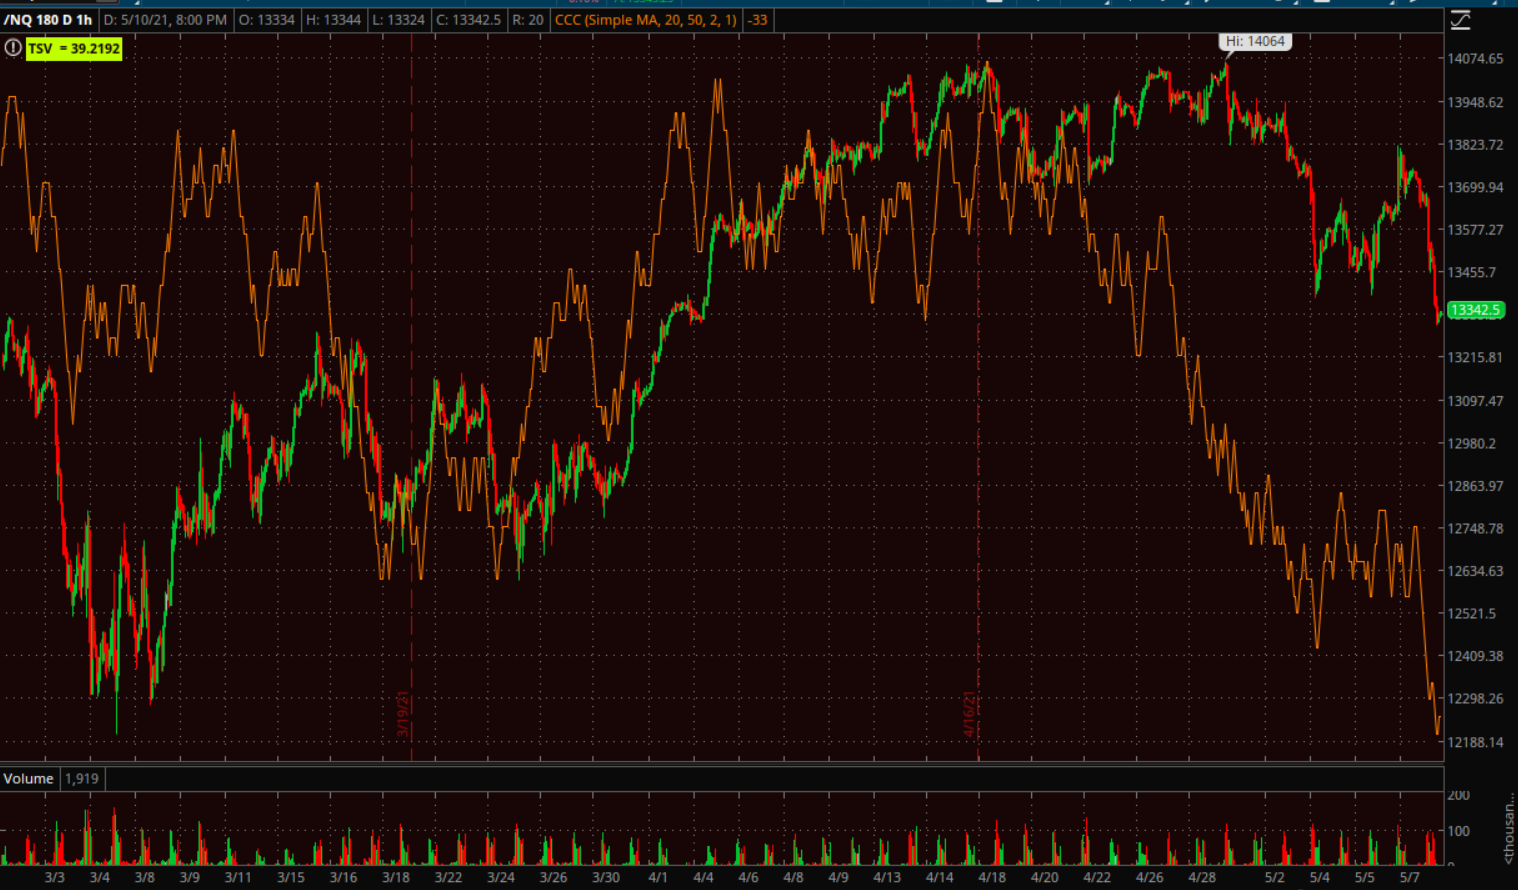 NASDAQ-100 futures (60m) similar to ES with a negative divergence that’s leading lower. In NASDAQ 100’s case, it needs to get back above last week’s lows quickly. Price closed just under them today.
Overnight
S&P futures are down a tenth of a percent (-0.1%) and look like a typical consolidation (bearish bias) following cash session losses.
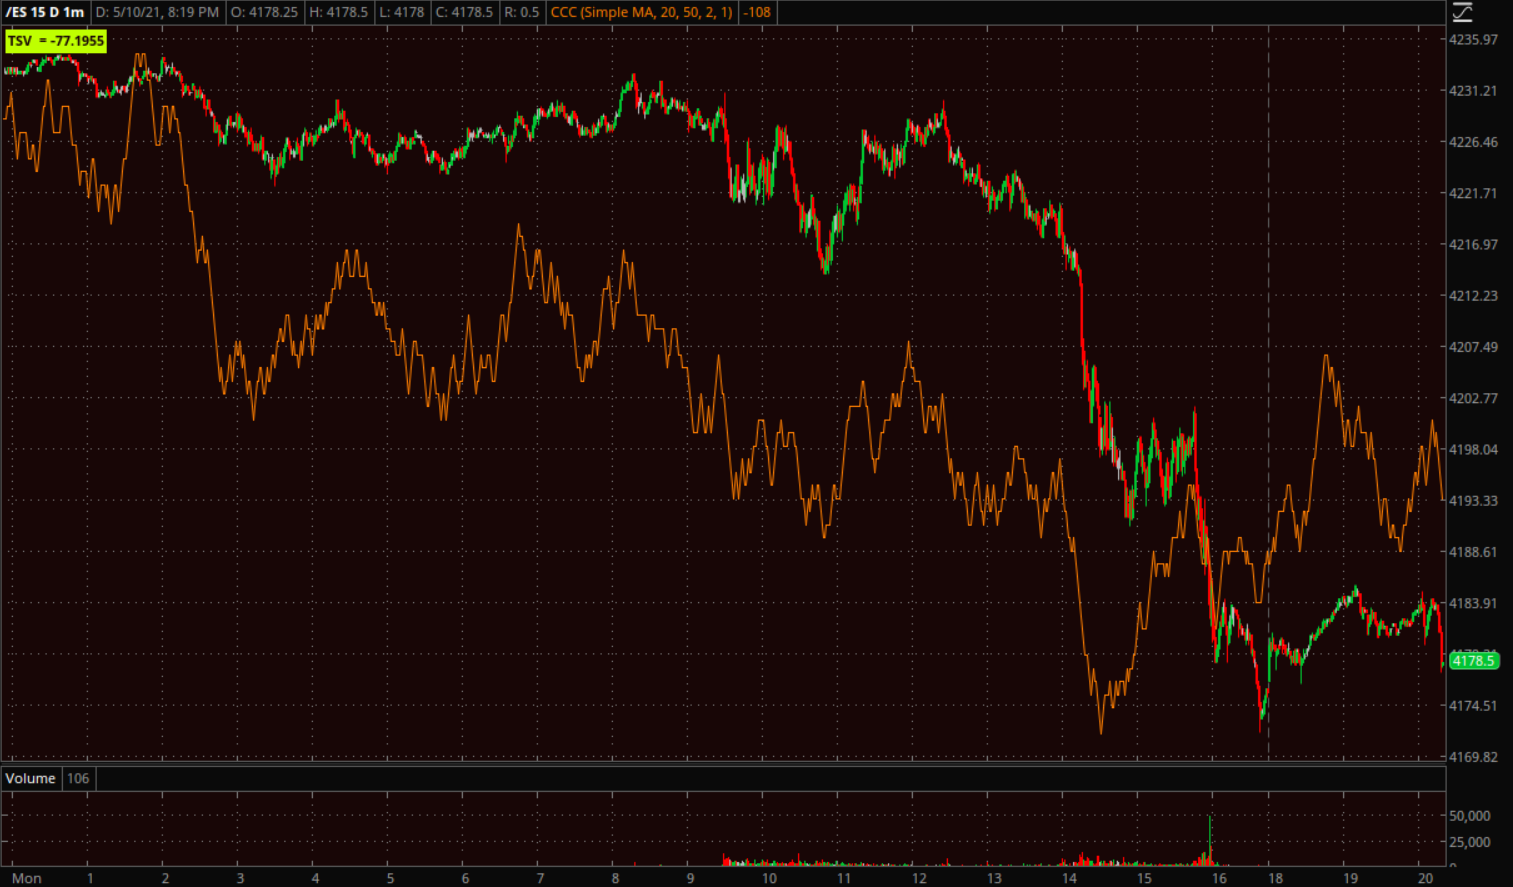 S&P futures (1m) with a small 3C positive divergence at sesion ows leading into a correction/consolidation (bearish bias). The other index futures are slightly different, but have the same overall theme of a bearis consolidation tonight.
Investors did not receive any economic data of note on Monday. The NFIB Small Business Optimism Index for April and the JOLTS – Job Openings report for March will be released on Tuesday.
CPI, PPI, and Retail Sales data will be released this week. The U.S. CPI report Wednesday is forecast to show a strong gain in April. It plays into a broader market concern that the Federal Reserve may be forced to raise interest rates sooner than current guidance suggest to contain inflation.
Also this week…
- A range of Fed speakers are due this week, including Governor Lael Brainard on Tuesday, among others
- Chinese inflation data are due Tuesday
- OPEC monthly Oil Market Report is published with global demand forecasts and production estimates Tuesday
- Bank of England Governor Andrew Bailey speaks Wednesday