Stock Market Daily Wrap – October 15, 2020
Yesterday was an odd day in that if you took price action for the major averages in a vacuum, price looked bullish, but the Yen (USD/JPY) was troubling, and the Dollar is so close and so ready to breakout that it doesn’t need to move much to have a dramatic impact.
The early market weakness was attributed to growth concerns caused by renewed lockdowns in Europe amid rising cases of coronavirus and by a 53,000 increase in weekly jobless claims to 898,000, above consensus 830,000.
In more practical terms, things fell apart overnight as Cable and the Euro dropped as EU and UK Brexit talks broke down. Recall it was Brexit/Cable that sent the Dollar higher and stocks lower at the start of September.
 EUR/USD (60m) breaking trend Tuesday and dropping again overnight. Recall the stock market was very strong Monday with its best day in months, and has been down every day since.
Here’s another perspective…
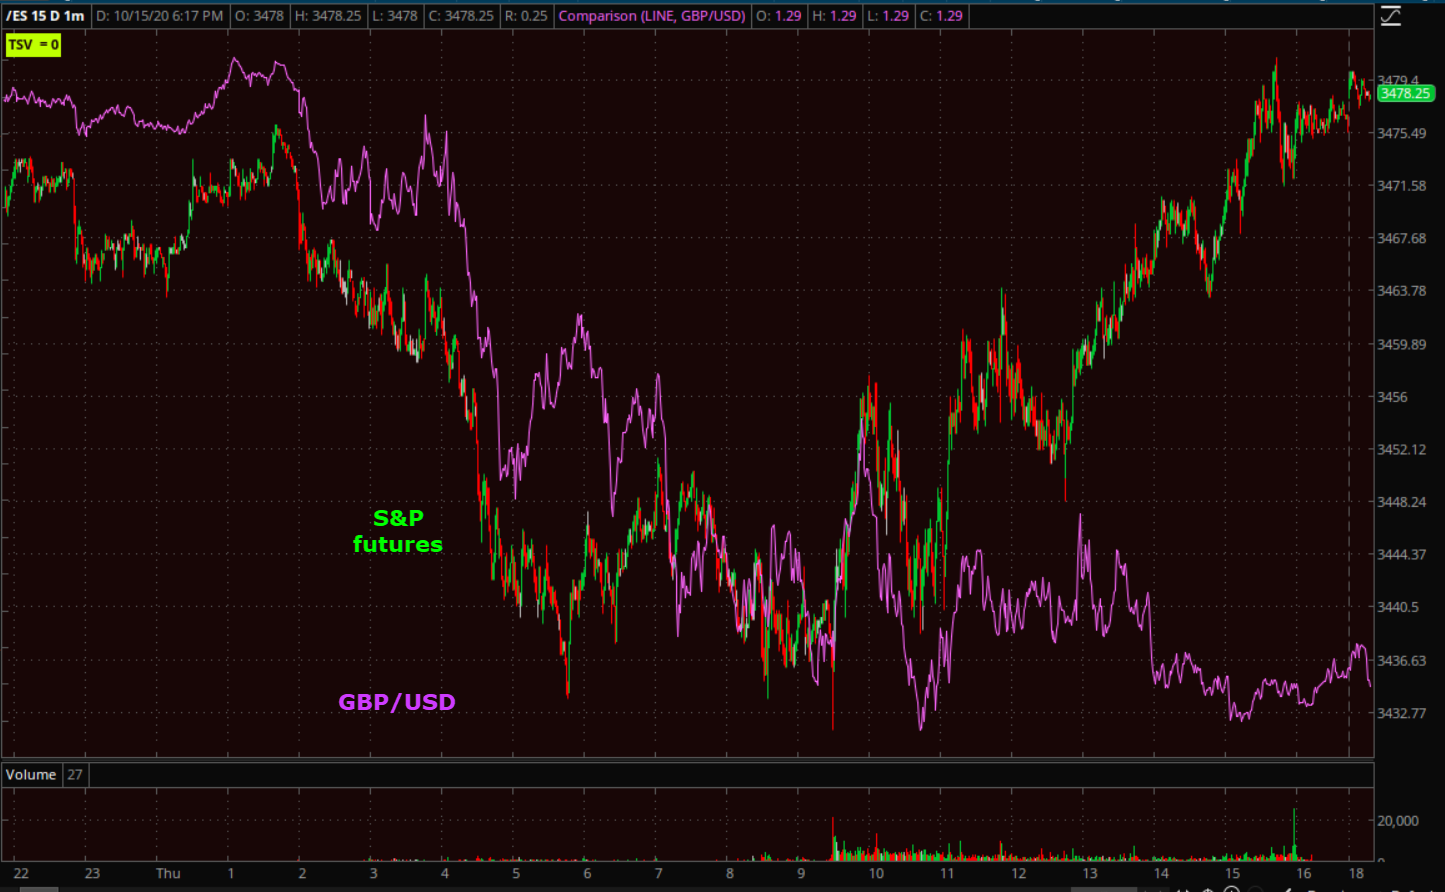 S&P futures and Cable (1m) from overnight.
With Cable and the Euro down, the U.S. Dollar Index jumped +0.5% and that’s a headwind for stocks due to the extremely high inverse correlation in recent months.
The S&P 500 battled back from an early -1.4% decline to close lower by just 0.2%. Small Caps, however, led the way higher with Value-oriented stocks leading the rebound at the expense of growth and momentum stocks, evident by the 1.1% gain in the Russell 2000 and 0.5% decline in the Nasdaq Composite. Or Momentum (-0.65%) down and Value (+1.45%) up.
Averages
S&P 500 ⇩ -0.15 %
NASDAQ ⇩ -0.72 %
DOW JONES ⇩ -0.07 %
RUSSELL 2000 ⇧ 1.06 %
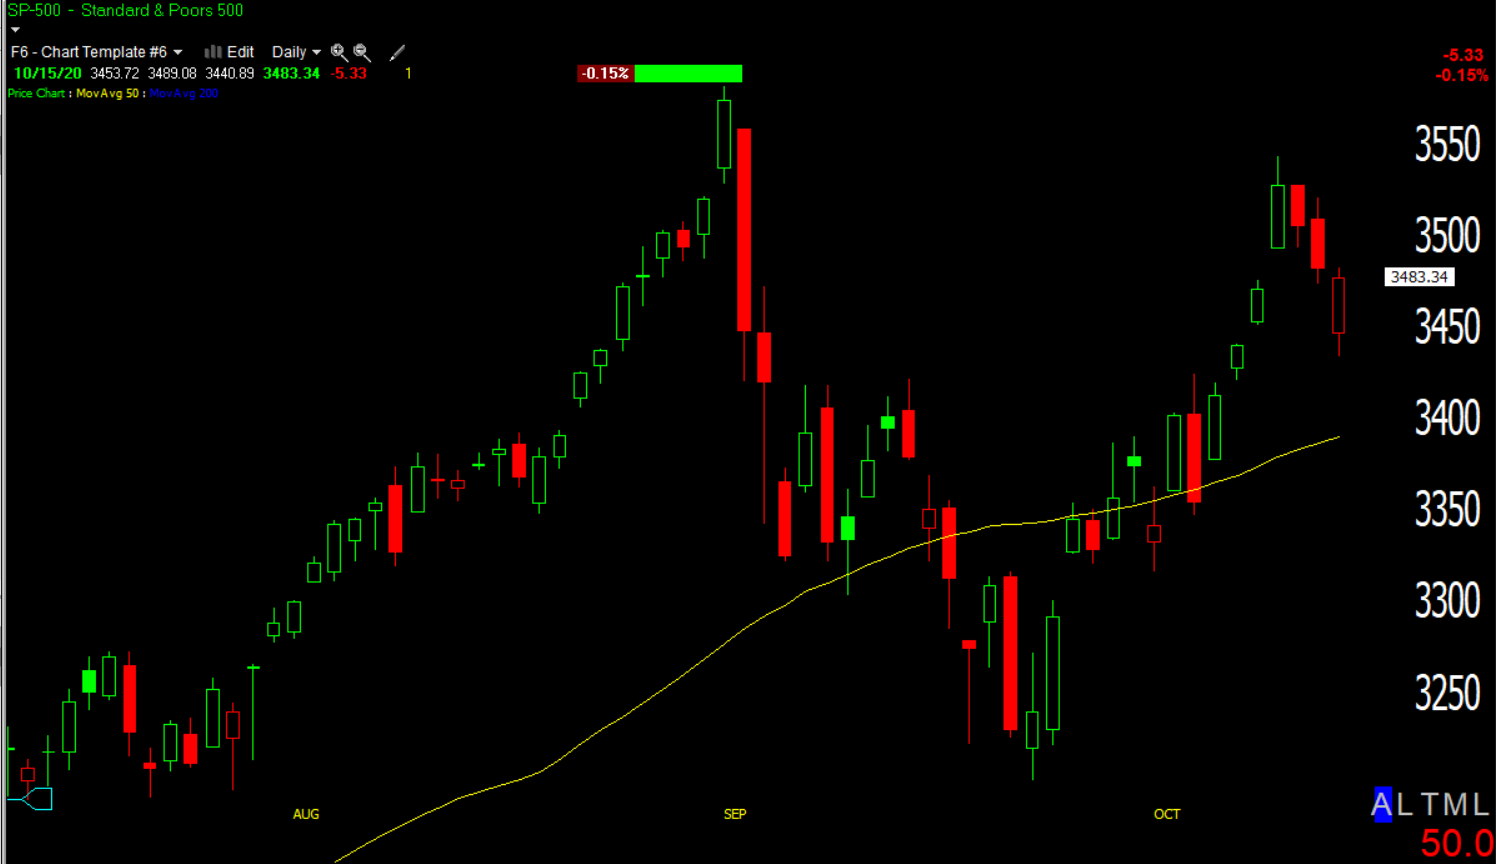 SP-500 (daily) w/ 50-day sma (yellow)
S&P retraced the week’s gains at the open and bounced back to fill the opening gap.
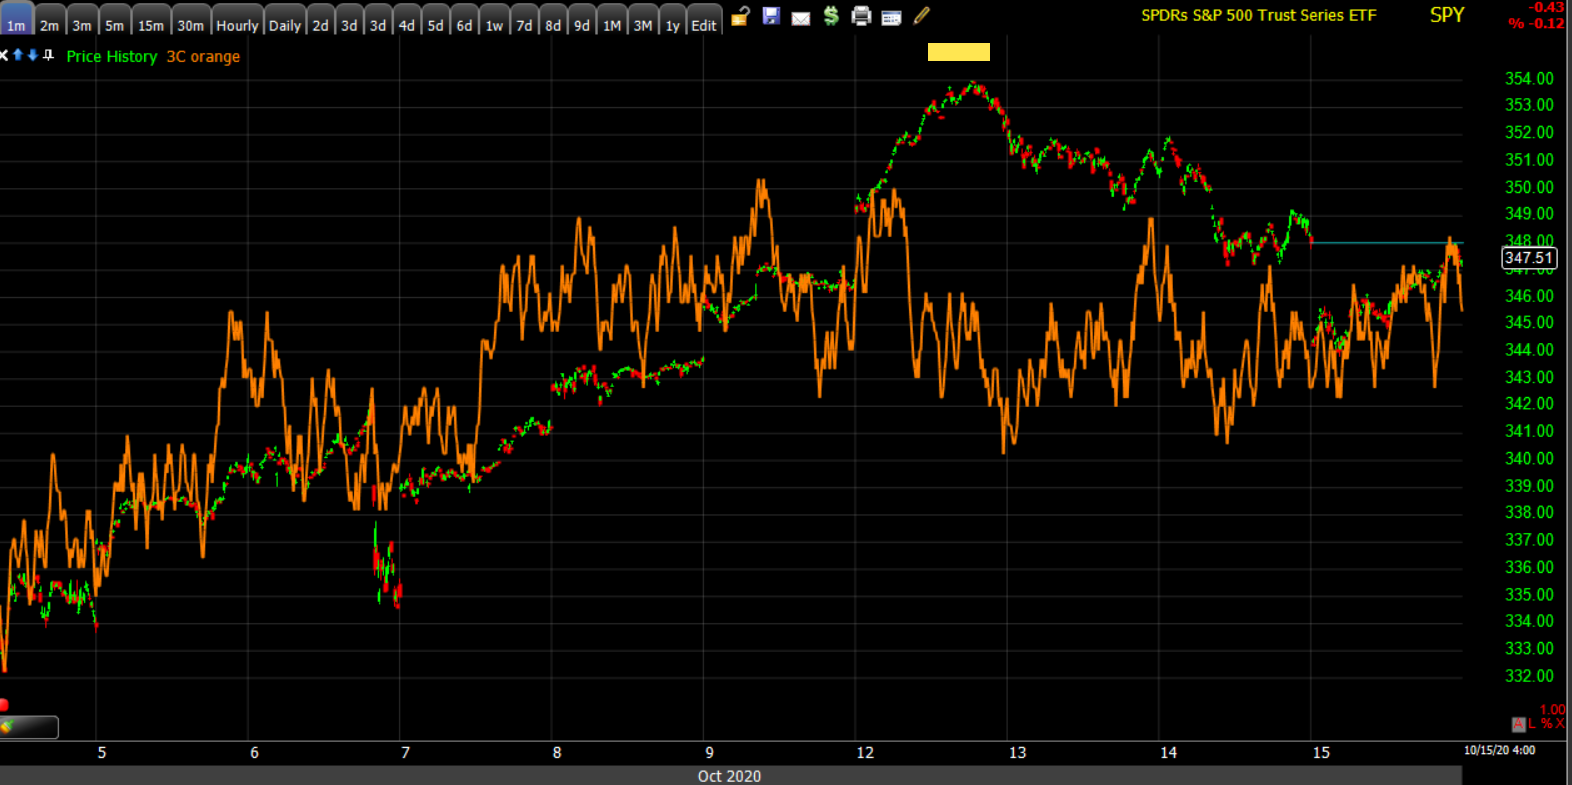
 SP-500 (5m) came into the week strong, followed by a bullish flag consolidation (green), but retracing all of the preceding gain (yellow) means it’s no longer a consolidation, at least not on the week. While price did fill the gap, the price action transitioned to more bearish (red) short term tone.
Small Caps were in a world of their own after being the worst looking major up until today.
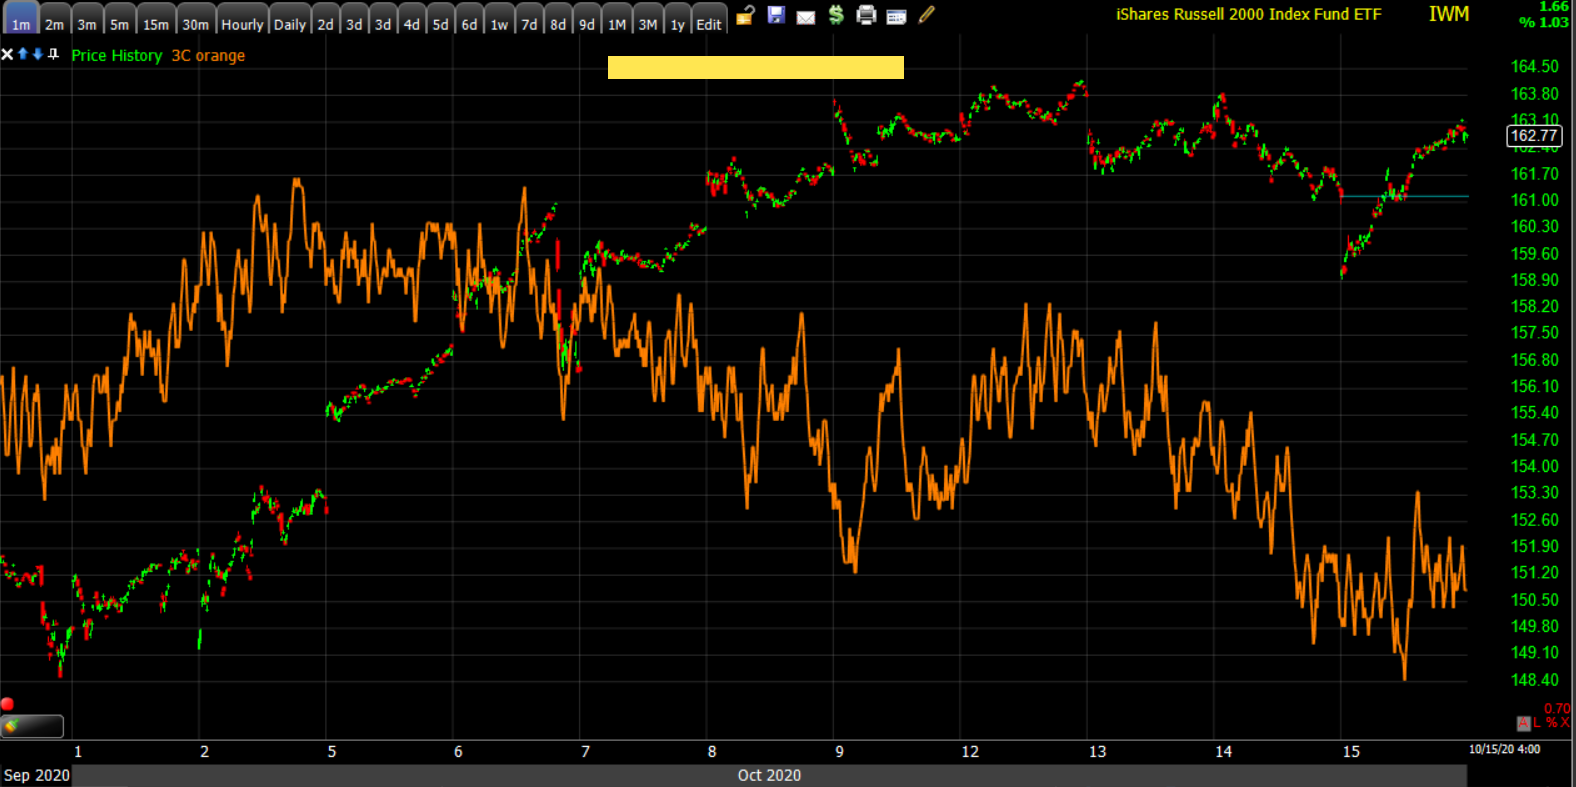
 IWM (daily) nearly bullishly engulfed yesterday so it was a very strong day for small caps. Recall that the reflation trades have been the worst performing this week and weighing down small caps until today. It was those same stocks that led Small Caps higher as new shorts were squeezed. We got a peak of that dynamic yesterday as Dow Transports outperformed Dow Industrials.
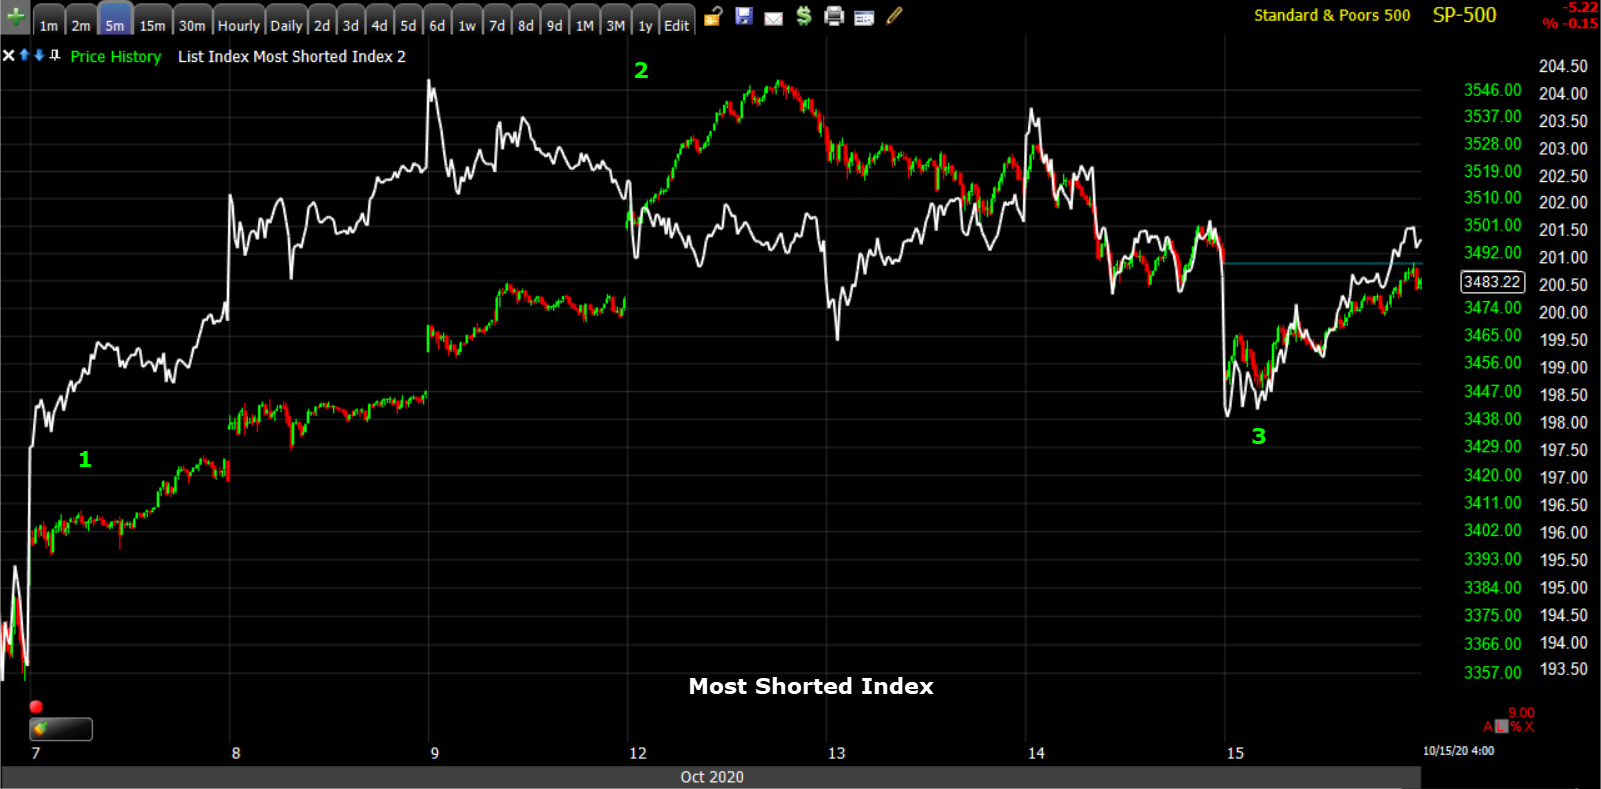 SP-500 (5m) and the Most Shorted Index (1) massive short squeeze last week, (2) 3C negatively diverges on IWM’s chart last week as the short squeeze runs out of momentum, and (3) new shorts in this week’s underperformers got squeezed today. This is why I think it’s important to wait for those high probability leading market signals before getting aggressively short. The market signals (USD/JPY or Dollar breakout) give extra confirmation and higher probabilities that there will been a meaningful turn and you don’t get shaken out in a short squeeze.
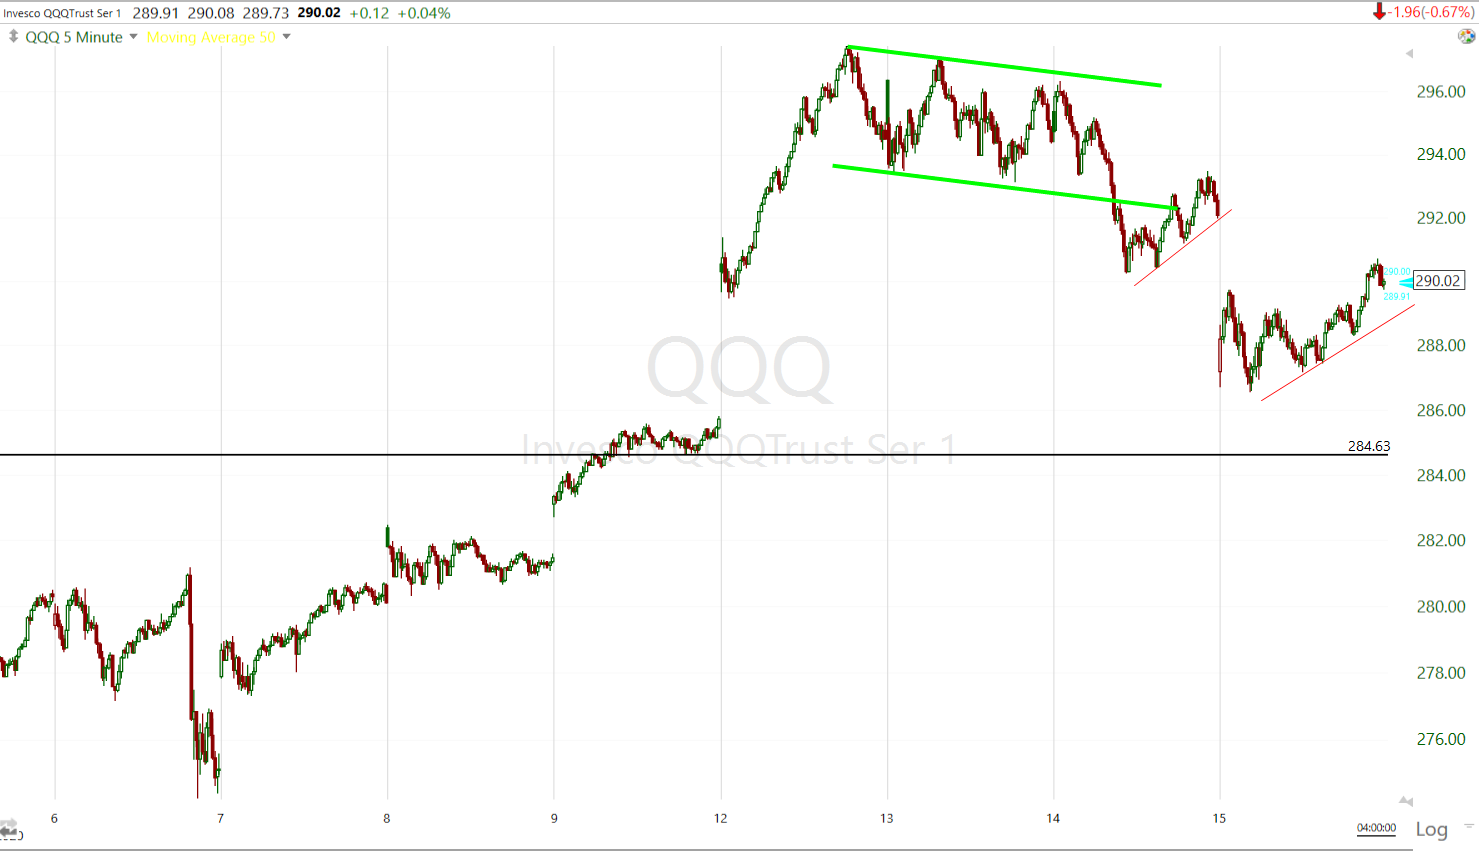 QQQ (5m) from bull flag (green) to two smaller bearish price areas (red). Stepping back beyond just the week, QQQ should have a large support zone between $282 and $285.
The picture on 3C hasn’t changed much. Small Caps have the most notable divergence from last week, while SPY and QQQ are much closer to in line with price.
 IWM (1m) negatively diverging around the middle of last week (yellow) as the short squeeze faded. Today 3C was actually in line intraday, confirming the bounce, but has not changed the overall trend.
 SPY (1m) and QQQ are very similar with a small negative divergence (yellow) Monday afternoon, but unlike IWM, the broader view is more in line with price action rather than negatively divergent. Honestly with earnings season underway, this is how I’d expect SPY to look.
VXX/Volatility still hasn’t shown any interesting positive 3C divergences.
 VXX (1m) negative divergence (red), positive divergence (white) and in-line or confirming (green), meaning that there’s no unusual hidden accumulation or distribution.
That doesn’t mean all is normal in volatility. VVIX has has an insane trend of strength this entire month.
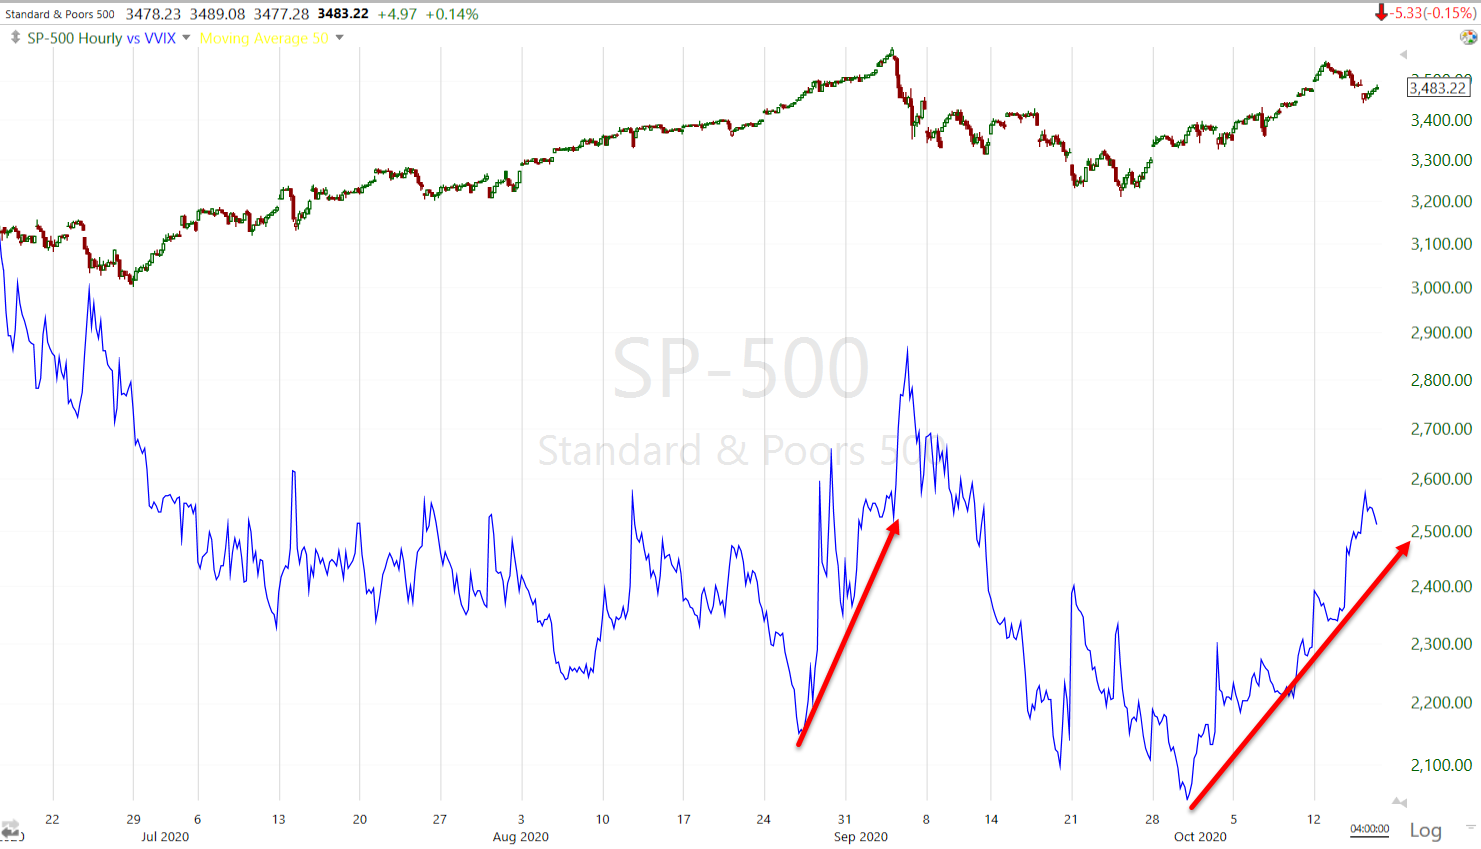
 SPX (15m) and VVIX (blue) should move roughly opposite of each other like the far left. VVIX has shown incredible strength, trending higher with the S&P the entire month of October.
In my experience it’s a more meaningful warning signal when VIX shows this kind of relative strength and positive correlation with the S&P, but VVIX has given signals too. In fact it acted in a similar manner into the market’s August high before the September plunge.
 SPX (60m) and VVIX .
When the Absolute Breadth Index falls below the mid-teen it’s one of my favorite long volatility signals. I almost always buy volatility when I see that. Absolute Breadth Index plunged from 52 at the start of the week to 38 today. ABI is still a way off from that kind of extreme low, but the speed and intensity of the plunge today is worth mentioning.
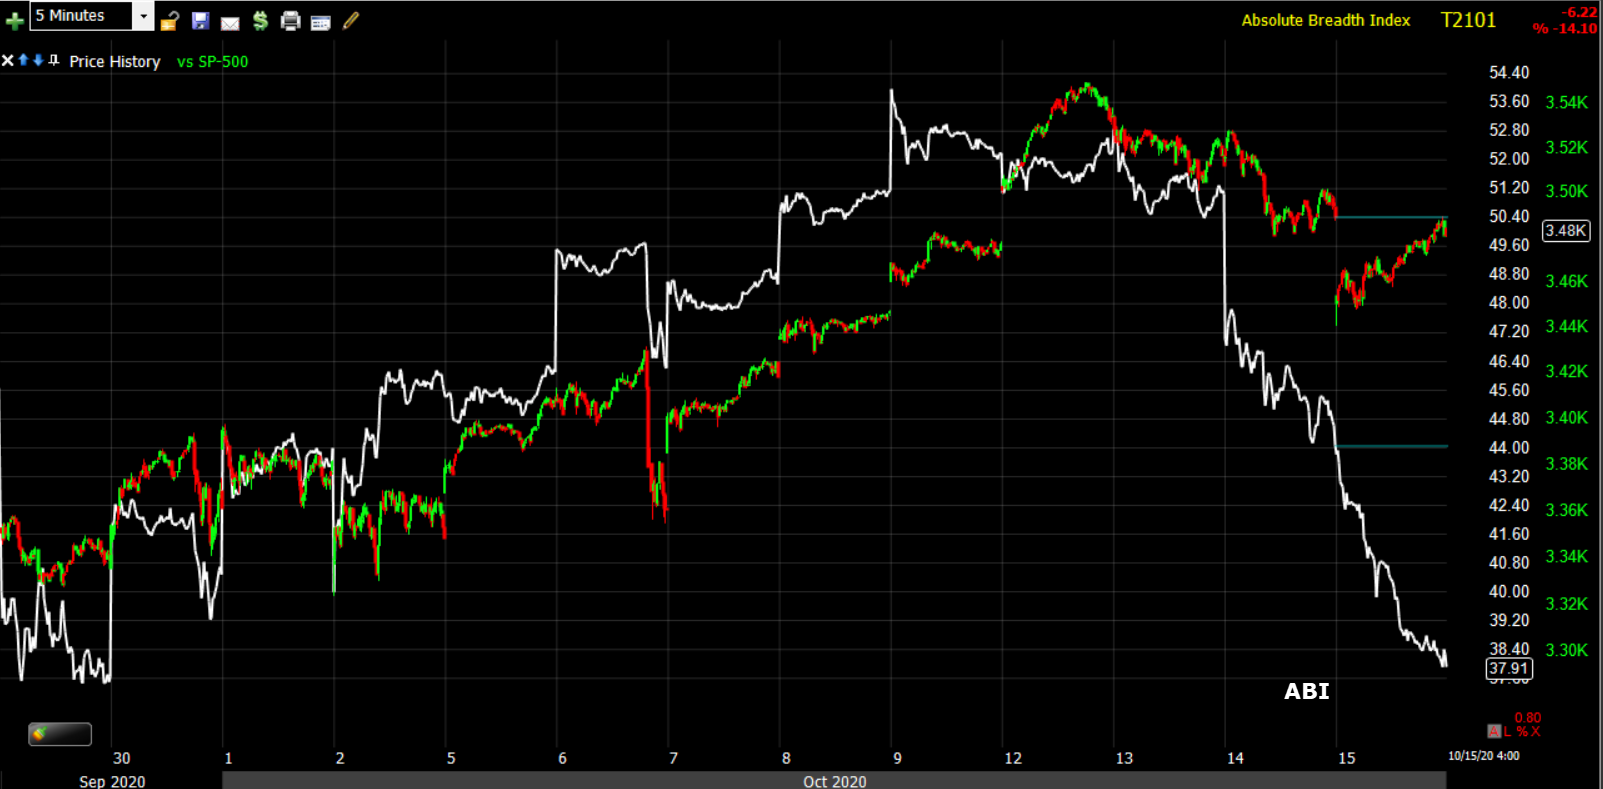 SPX (5m) and ABI
Just to keep the big picture in mind…
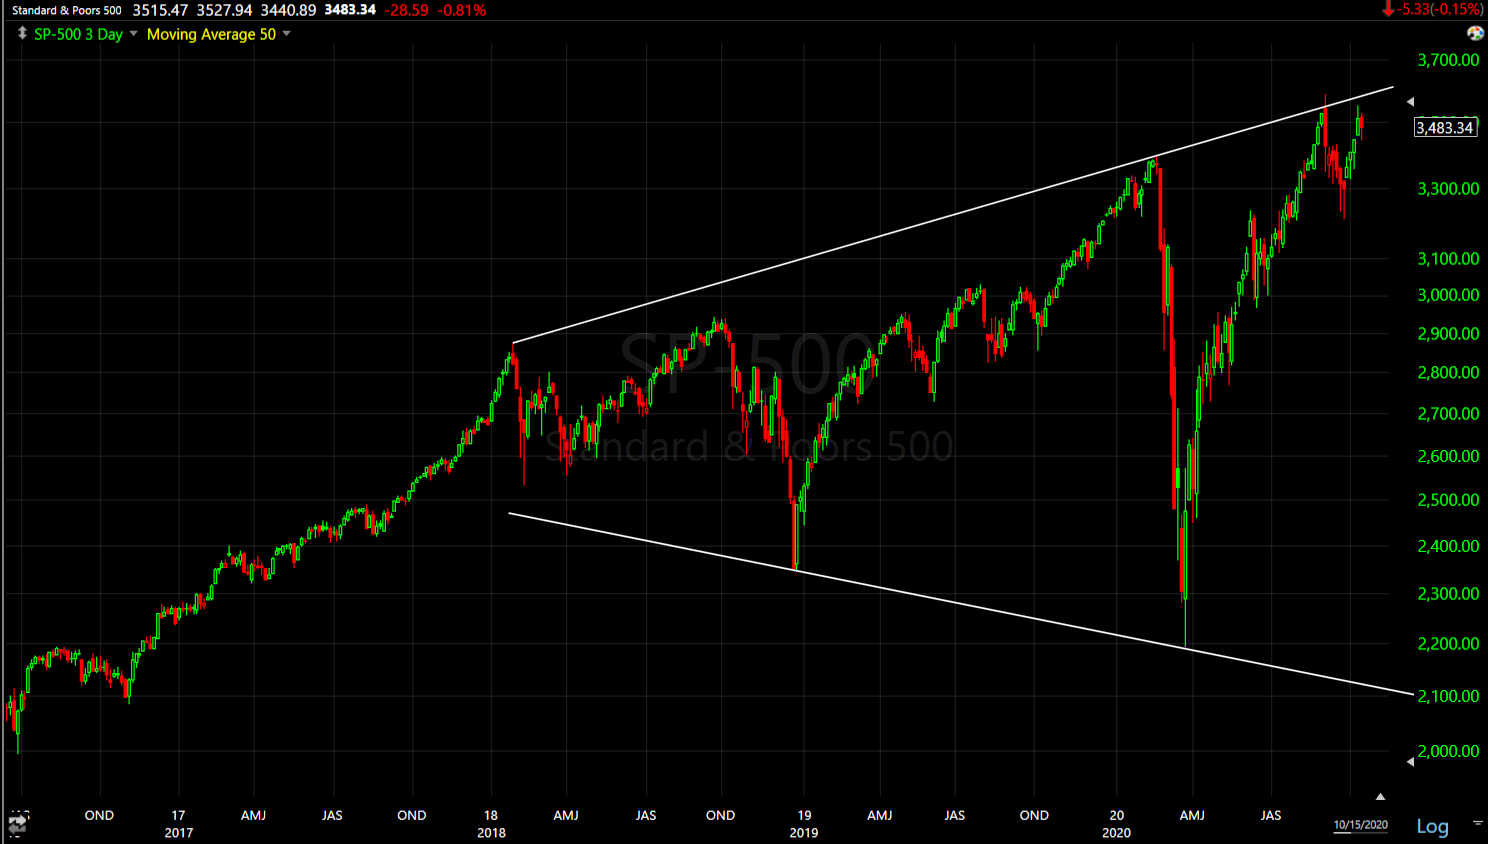 SP-500 (3-day) Broadening formation
S&P sectors
Taking a quick look at the sectors below, the cyclical/value related sectors outperformed, while the growth/momentum related sectors lagged behind. The Technology, Communications, and Health Care sectors were the day’s laggards.
Materials ⇩ -0.29 %
Energy ⇧ 1.21 %
Financials ⇧ 0.77 %
Industrial ⇧ 0.36 %
Technology ⇩ -0.45 %
Consumer Staples ⇧ 0.06 %
Utilities ⇩ -0.06 %
Health Care ⇩ -0.72 %
Consumer Discretionary ⇧ 0.37 %
Real Estate ⇧ 0.47 %
Communications ⇩ -0.77 %
Within Financials, the Banks (KBW Index +1.7%) outperformed.
It would seem that gains were earnings related in Morgan Stanley (MS +1.3%) and Charles Schwab (SCHW +5.2%) driving the banks higher, but we’ve seen banks beat earnings and struggle all this week. Last night I pointed out two factors for the banks- 1) the yield curve and 2) the KBW Bank Index was coming down to probable support at its 50-day moving average.
 KBW Bank Index (daily) after backing away from resistance at the trend line (red) and 200-day, the Bank Index opened right at its 50-day (yellow) and bounced off it today.
I’d say that the action in the banks has a lot less to do with earnings and a lot more to do with technical/macro factors. I think it’s fair to say that’s the case for the entire stock market (i.e.- Cable, Euro, Yen, Dollar).
Internals
NYSE Advancers (1698) ended up edging out Decliners (1306), but at the open decliners were 10-to-1 over advancers. Small Cap’s leadership meant substantial improvement in internals as the day went on. Volume was slightly lighter at 758.4 mln shares. Volume has been light, running about 25% below the 50-day average.
There is no Dominant price/volume relationship.
Treasuries
U.S. Treasuries finished near their flat lines after starting the session with gains and a more risk-off stance. This was one of the reasons I expected the averages to come off the morning’s worst levels and attempt to fill the gaps. The 2-year yield was unchanged at 0.13%, and the 10-yr yield increased one basis point to 0.73% for some very modest curve steepening (helps the bank).
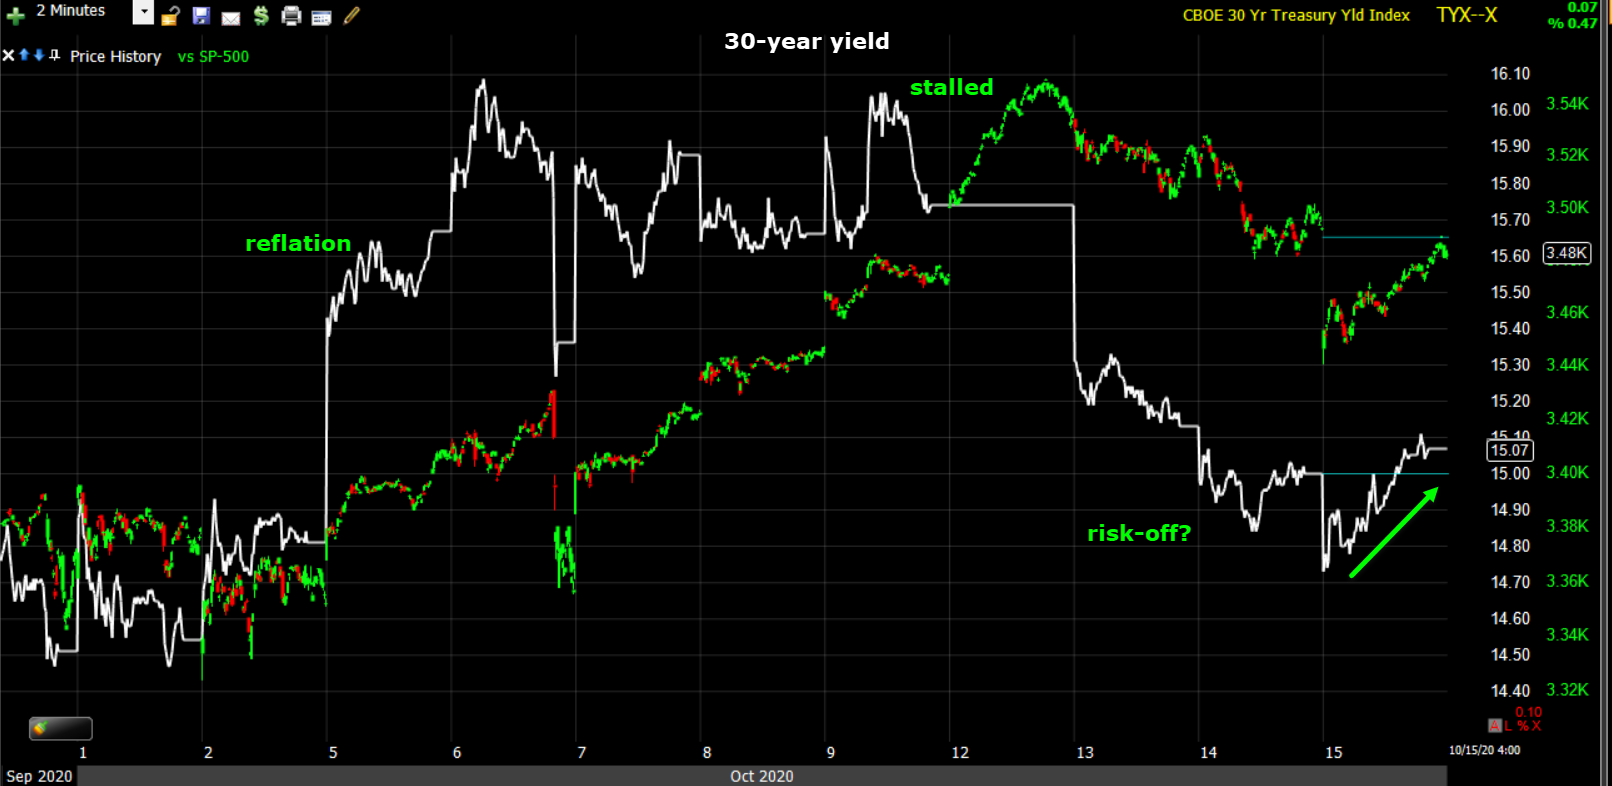 SPX (2m) and 30-year yield going from pro-growth reflationary tone last week, to retracing all of last week’s move this week, bordering on risk-off, or flight to safety. Additionally the plunge in yields is not helpful for the banks that have been weak until today. Notice yields started lower and bounced higher today.
I’m going to stick this chart here, but I don’t think it has anything to do with bonds/yields.
 SP-500 (5m) and an equal weight index of a half dozen credit-related assets. The plunge in credit this morning is the worst/ugliest since late September when the market was still selling off. While there was a bounce off session lows with stocks, credit ended ugly and credit is one of my favorite leading market signals.
Many professional and institutional traders use credit to express risk-on/risk-off positions rather than S&P futures (HYG for example). I think they are looking at the same thing I am for the same reasons… The U.S. Dollar.
Currencies and Commodities
The U.S. Dollar Index advanced +0.5% to 93.83 due to relative weakness in the British pound and Euro. Stocks were down 4 weeks in a row as the Dollar rallied. The last 3+ weeks stocks have rallied while the Dollar has pulled back in a bull flag. The bullish flag has suggested a higher probability that the Dollar will likely make another move higher.
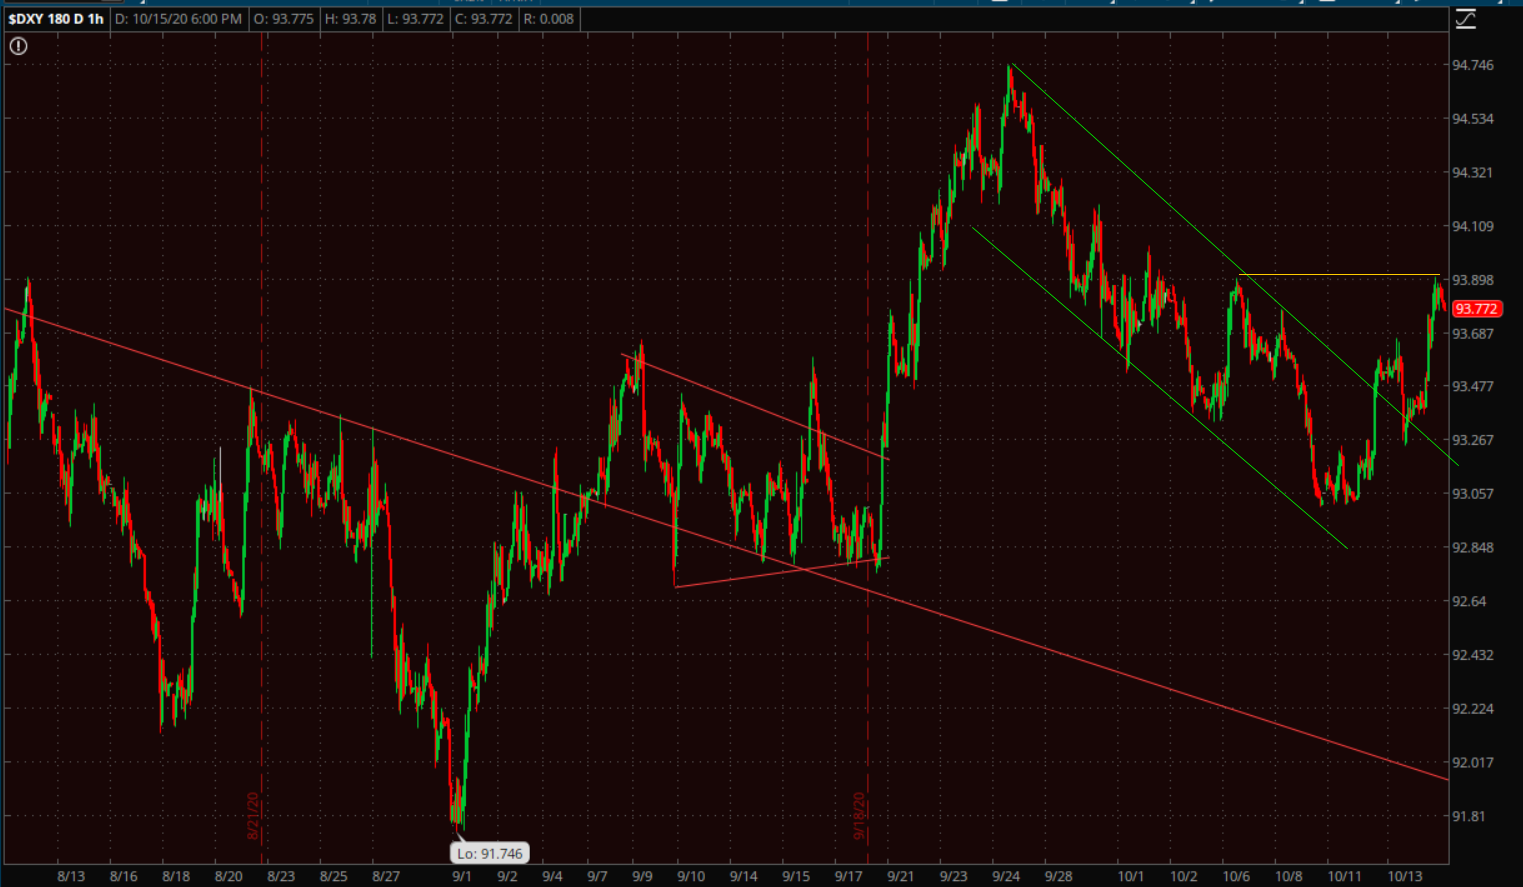
U.S. Dollar Index (60m) is breaking out of the bull flag consolidation (green). I mentioned some very localized probable resistance this afternoon around $93.90 (yellow) and that it could help stocks. I’d say a move above $94 represents a breakout and increasing headwinds for stocks.
WTI crude futures fell a modest -0.2% to $40.96/bbl., but were incredibly volatile.
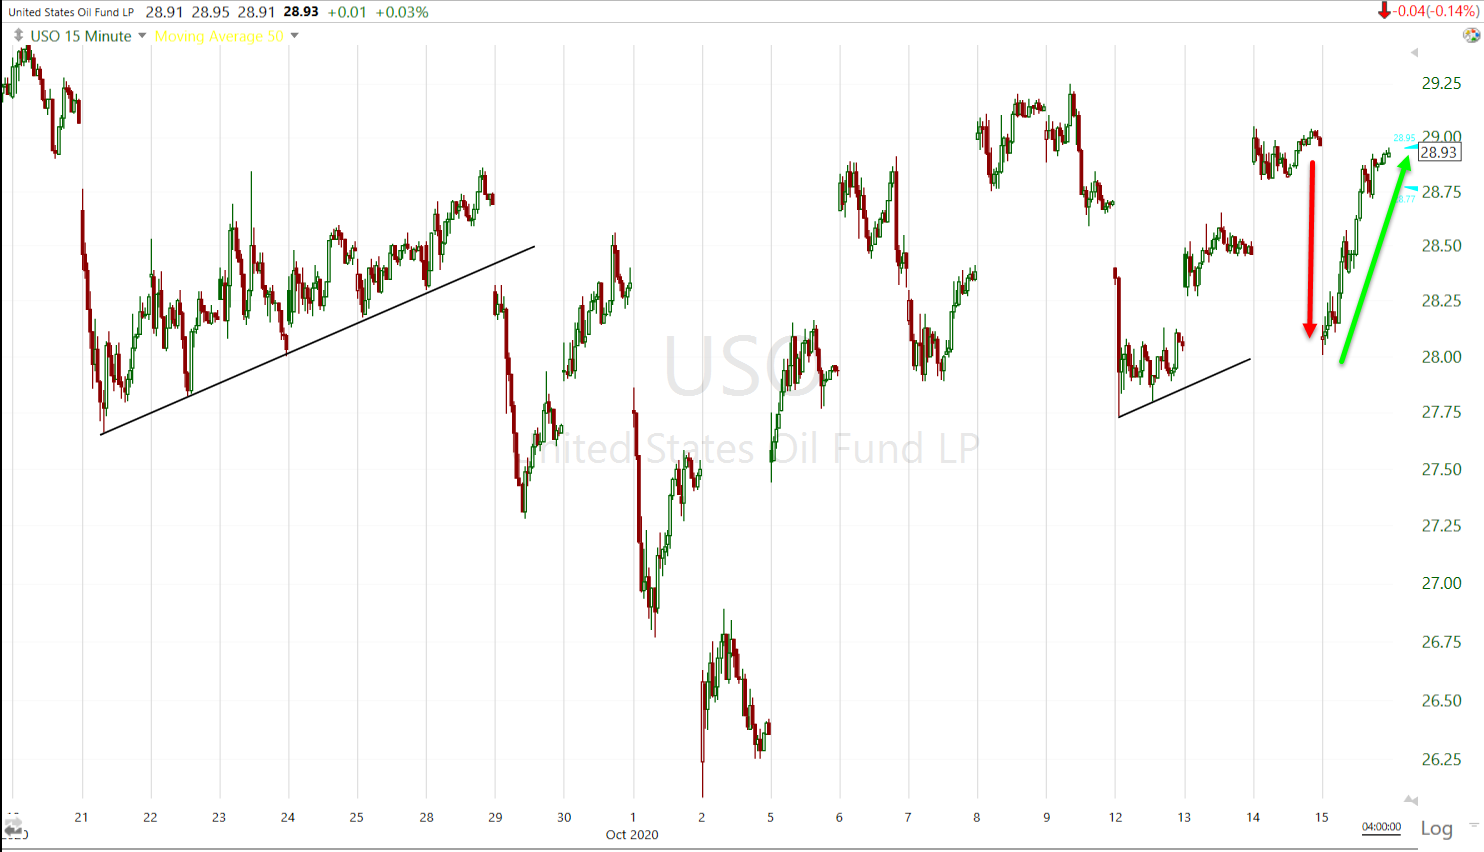 USO (15m) prices dropped -3.3% at the open and then retraced almost all of the drop, providing support to the Energy sector, which provided a lift for Small Caps.
Gold futures were little changed at +0.1% to $1,908.90/oz.
Whenever I’ve talked about Gold the last month, I’ve mentioned the more bearish price action in silver. SLV has been trading in a bearish flag since the Dollar rallied off its low and SLV dropped -18% in 3 days.
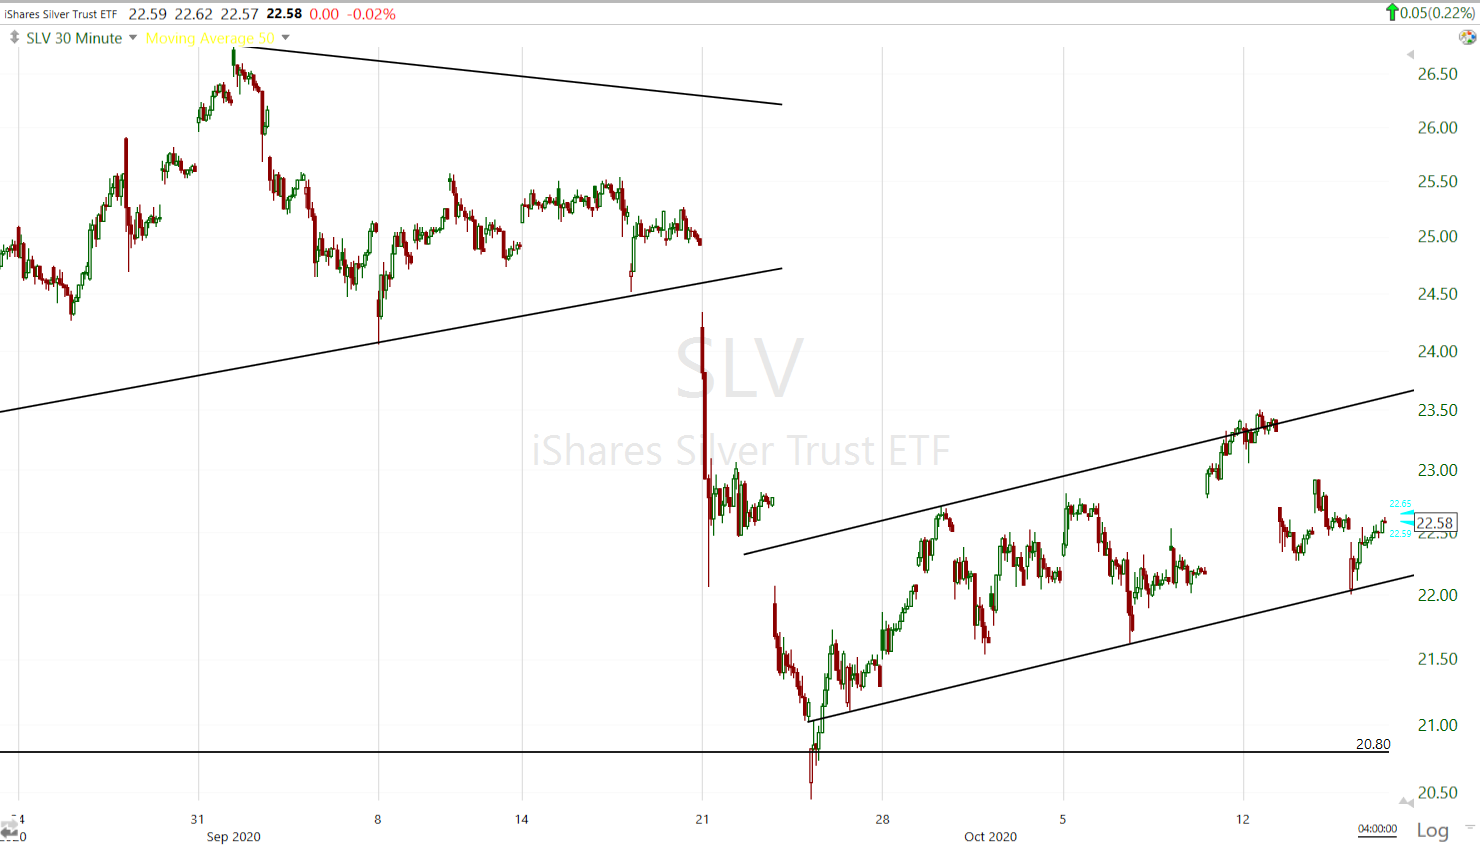 SLV (30m) had a strong gain Monday, but hit resistance at the top of the bearish flag. Since then it fell right to the lower trend line of the bearish flag. That’s not coincidence, that’s confirmation of the ongoing bearish price action and I believe that’s because of the bullish price action in the Dollar. Silver and gold are not the same, but silver’s price action makes me more cautious on gold and that’s due to the Dollar.
After breaking out of a 2 month consolidation, this Monday I posted a Bitcoin/GBTC update.
“I expect a decent probability of another consolidation somewhere between $13 and $13.50.”

GBTC (60m) has been consolidating since then and it looks fine.
Summary
Stocks started the week very strong. If we looked at price action alone in a vacuum, it was bullish and constructive right up to last night. Considering how the week started and where we were this morning, currencies have proven invaluable in assessing market probabilities.
The Dollar Index is the key .My last Youtube video on September 26th was titled, The Key To The Stock Market . Get the U.S. Dollar right and you’re likely to get the market’s direction right, as well as numerous other asset classes like precious metals and commodities. The Dollar started pulling back the next trading day and the market started its rally off the September low. The Dollar remains key, but other currencies like the Euro, Pound and Yen are offering unparalleled insights. I’ll let the Dollar Index chart above speak for itself.
The Euro and British Pound have been the catalysts to move the Dollar, and they’ve been reacting to Brexit developments, and other things like the COVID developments in Europe. The Dollar-Yen has done a fantastic job in indicating risk sentiment.
On Monday the NASDAQ-100 posted it’s best day in six months, up +3.1%. I that context the following are excerpts from Monday’s Daily Wrap…
“USD/JPY s following through on Friday’s decline and falling below the neutral trend line.
The near-term price action for USD/JPY is bearish suggesting a probability of more downside as the safe-haven Japanese Yen is bid up against the Dollar.”
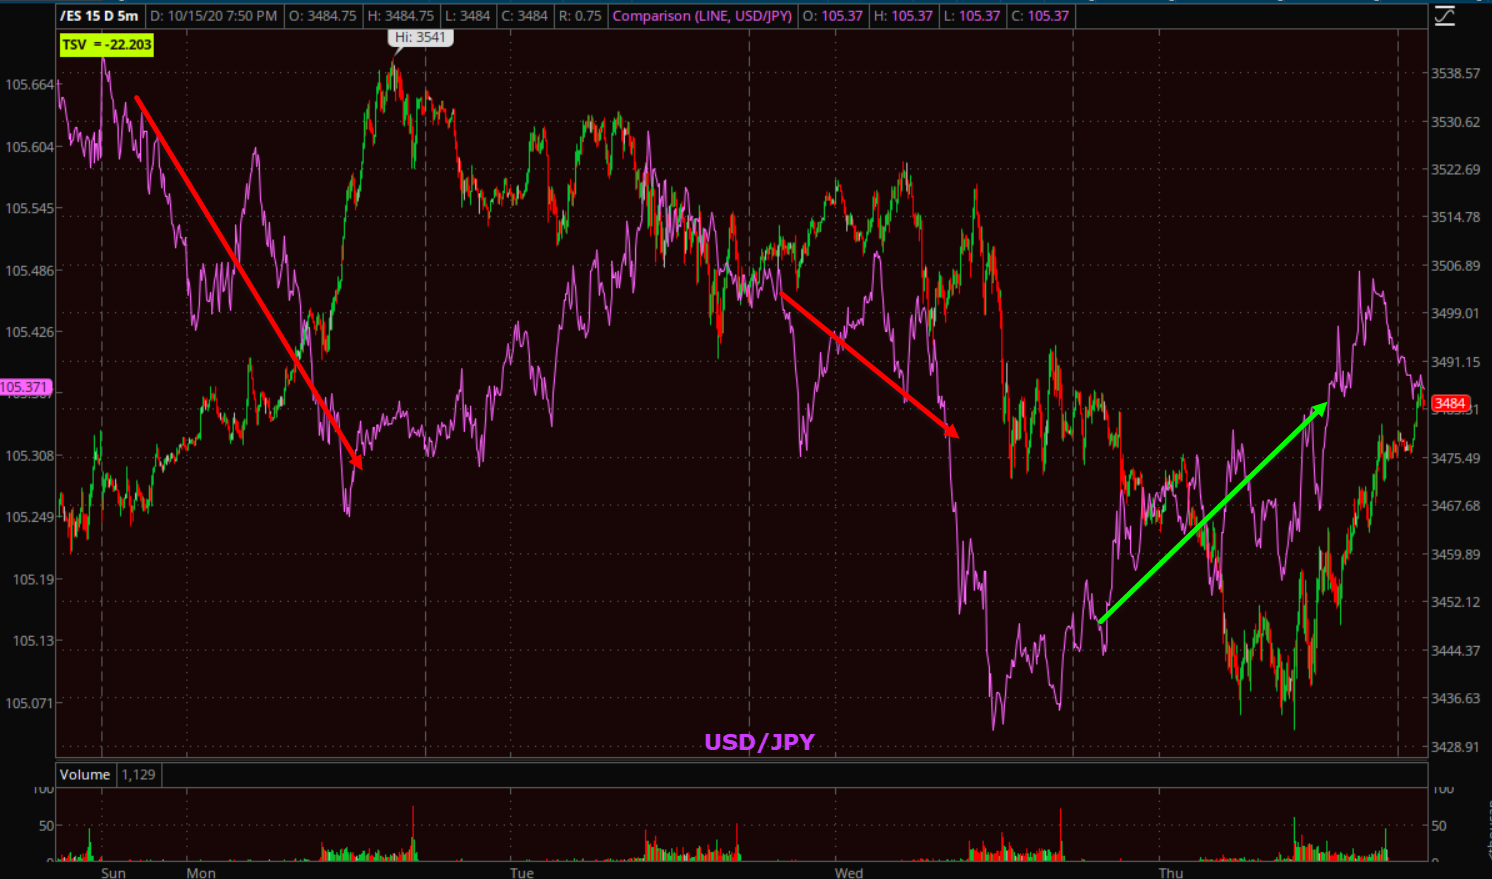 S&P futures (5m this week) and USD/JPY. The Dollar Yen did not confirm Monday’s strong rally and it in fact led lower (red arrow to far left). We had a similar situation yesterday (red arrow in the middle).
Excerpts from last night’s Daily Wrap…
“…most of the day I was considering buying one of the averages, leaning toward NASDAQ/QQQ for a short term trade.
The one thing I saw that gave me pause was the safe-haven Japanese Yen being bid up sending USD/JPY lower.”
And the averages fell again this morning, led by USD/JPY. This afternoon I went ahead and went long QQQ for a quick trade. If USD/JPY was not bouncing (green arrow on the chart above), and in fact leading the market off the lows, I wouldn’t have considered the trade, just as I passed on it yesterday.
As for the long QQQ trade, it was up 100% this afternoon so I took some off to pay for most of the trade and take some risk off the table. That allows me some freedom to give it room to run. The call options expire tomorrow so I’ll be closing the rest of the trade one way or another tomorrow.
Overall as USD/JPY sits tonight…
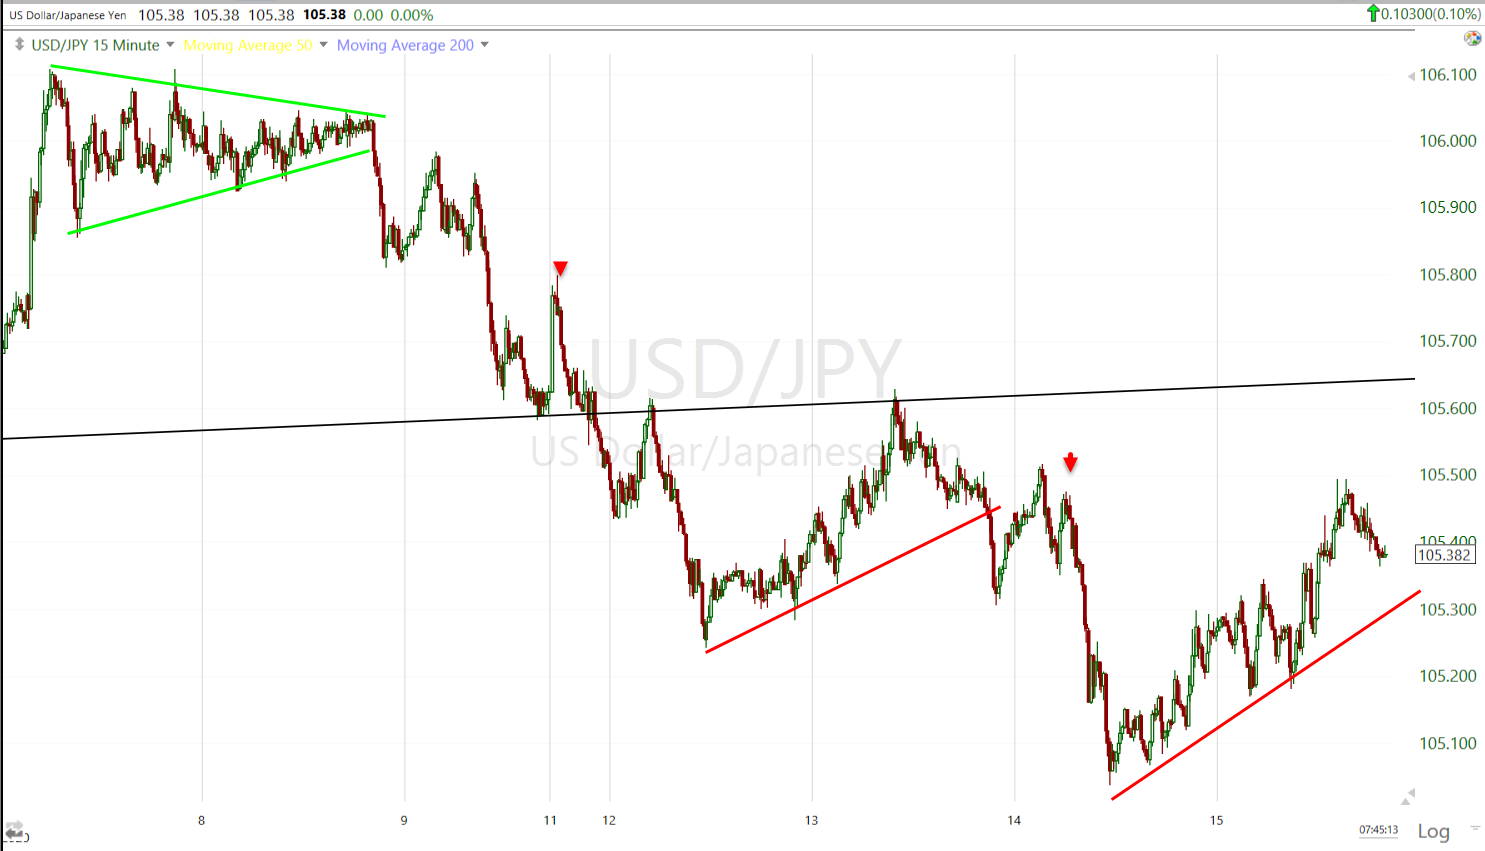 USD/JPY (15m) price action still has a bearish bias being both below the trend line and making lower highs/lower lows. Here’s a broader perspective…
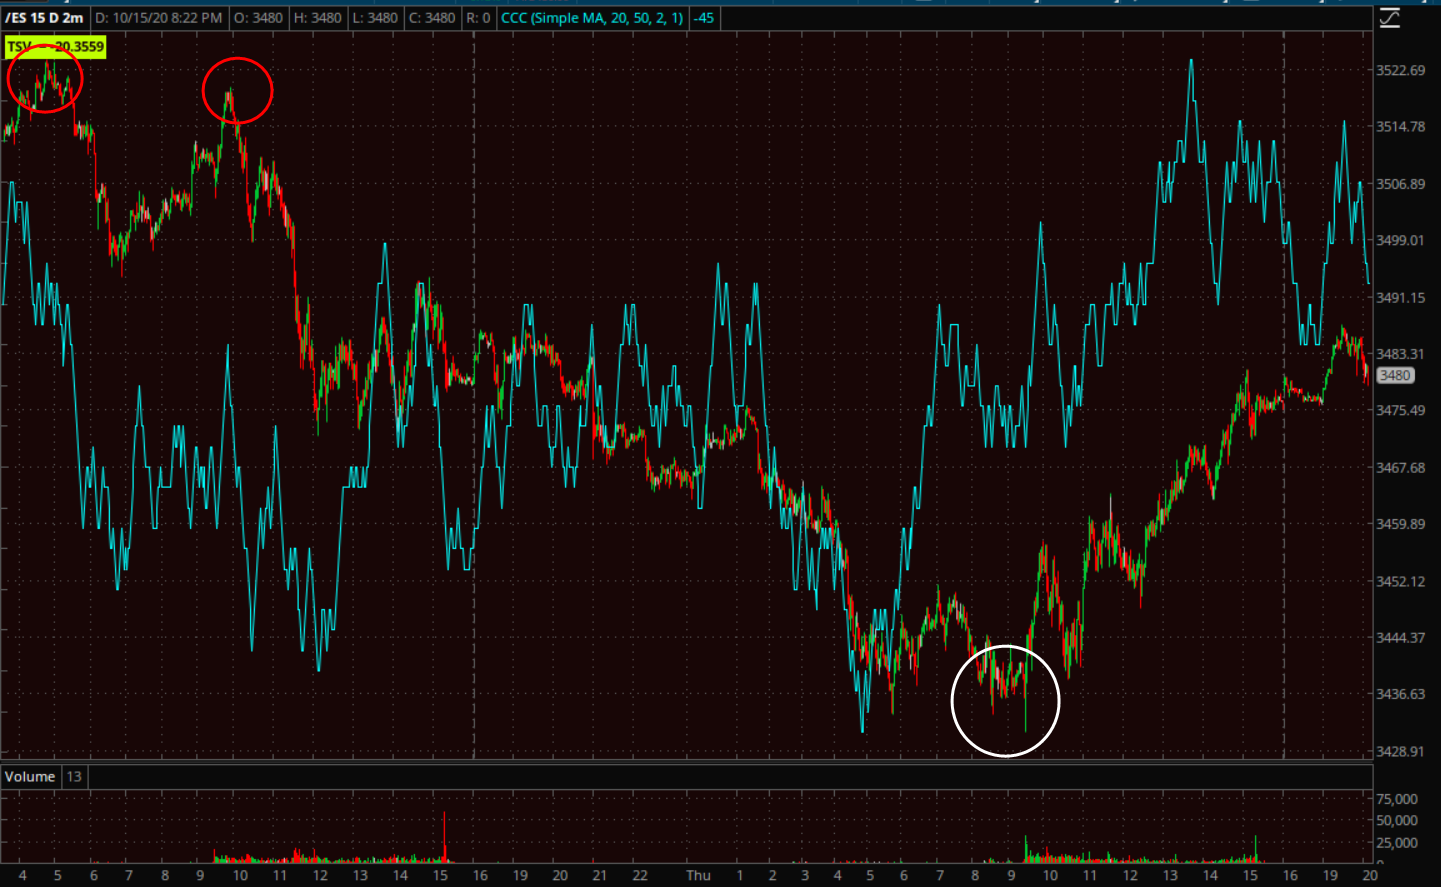
 S&P futures (60m) and USD/JPY. The Dollar Yen is negatively divergent with the S&P on the week. Recall that it led the market lower from the August highs, and led the market higher from the September lows.
Overnight
S&P futures are +0.15%. 3C is pretty much in line with, or confirming price off today’s low.
 ES (2m) negative divergences overnight (red) and positive at this morning’s low (white). The chart looks supportive into the overnight, but it wasn’t a really strong low in the cash session. VIX futures started putting in a positive divergence this afternoon.
 VIX futures (1m)
As it stands now, the Dollar-Yen is negatively divergent heading into next week. If I had to guess, I’d say buyers are starting to sniff around volatility heading into next week.
Treasury futures have a similar look.
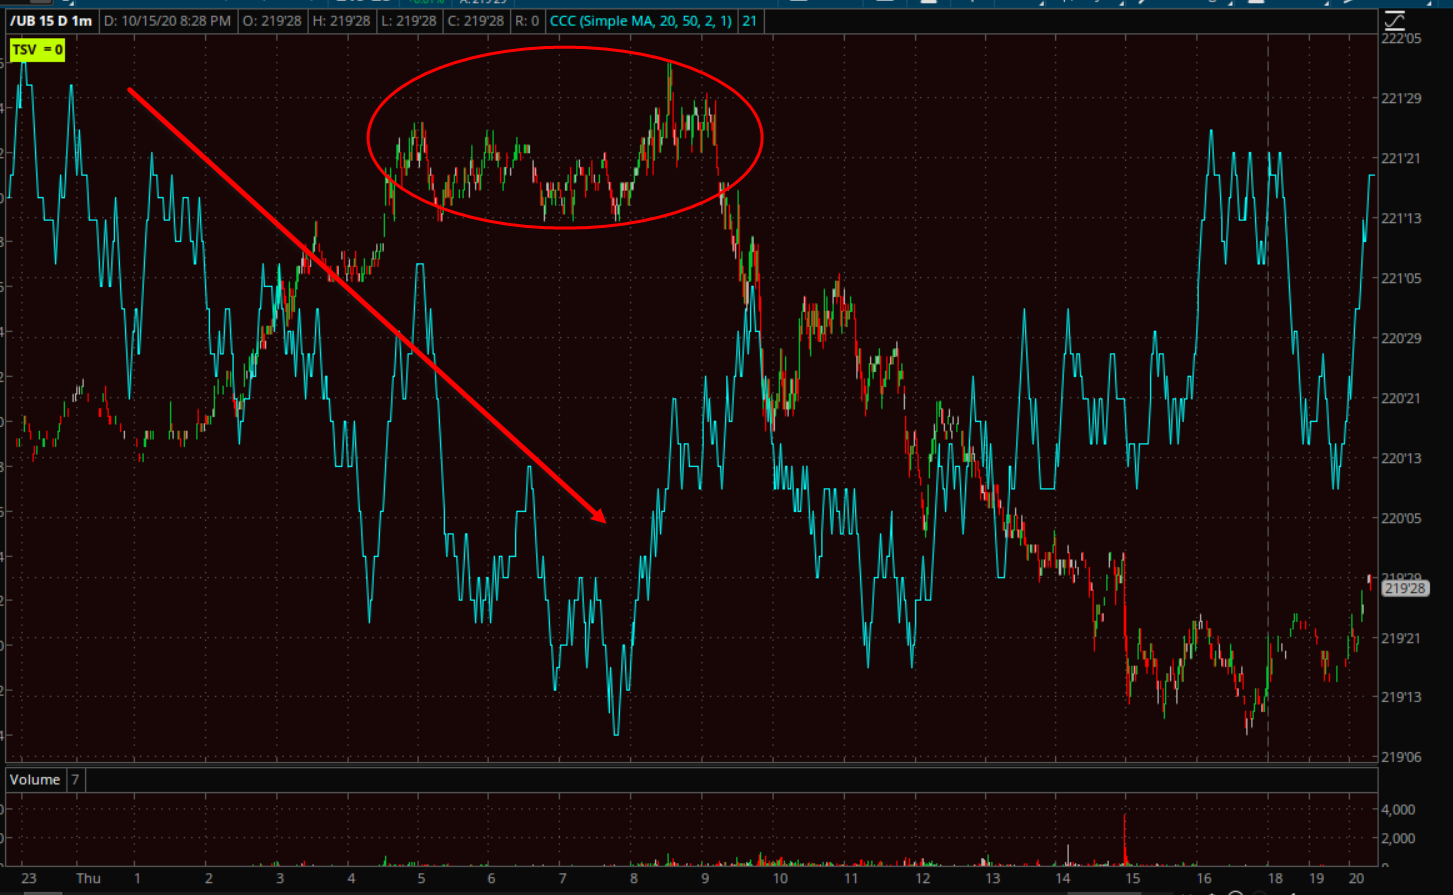
Ultra T-Bond futures (1m) rallied as stocks fell overnight, and pulled back after a negative divergence in today’s cash session. I wouldn’t have gone long QQQ if they had not pulled back. However, like VIX futures above, 3C is starting to positively diverge.
I suspect it will be a relatively quiet night for index futures, but we may have some interesting developments on these charts in the morning if these divergences keep up, and that may speak to how the market unfolds next week.
Looking ahead to Friday we have Retail Sales for September, Industrial Production and Capacity Utilization for September, the preliminary University of Michigan Index of Consumer Sentiment for October, Business Inventories for August, and Net Long-term TIC Flows for August.