Stock Market Daily Wrap – Pre FOMC
Index futures’ and VIX futures 3C charts didn’t look great for the market going into the overnight session last night. Overnight more Omicron news weighed on markets, then this morning a much hotter than anticipated Producer Price Index (PPI) further weighed on futures. Recall also that most of the major averages had a weak close yesterday near or at session lows which is never a good sign heading into the next day.
 S&P futures (3m) weaker 3C tone coming into the new week.
Inflation concerns were fueled by a hotter-than-expected Producer Price Index for November this morning, which was up 0.8% month-over-month (consensus 0.5%) and up 9.6% year-over-year. That further pressured index futures this morning coming into the cash open.
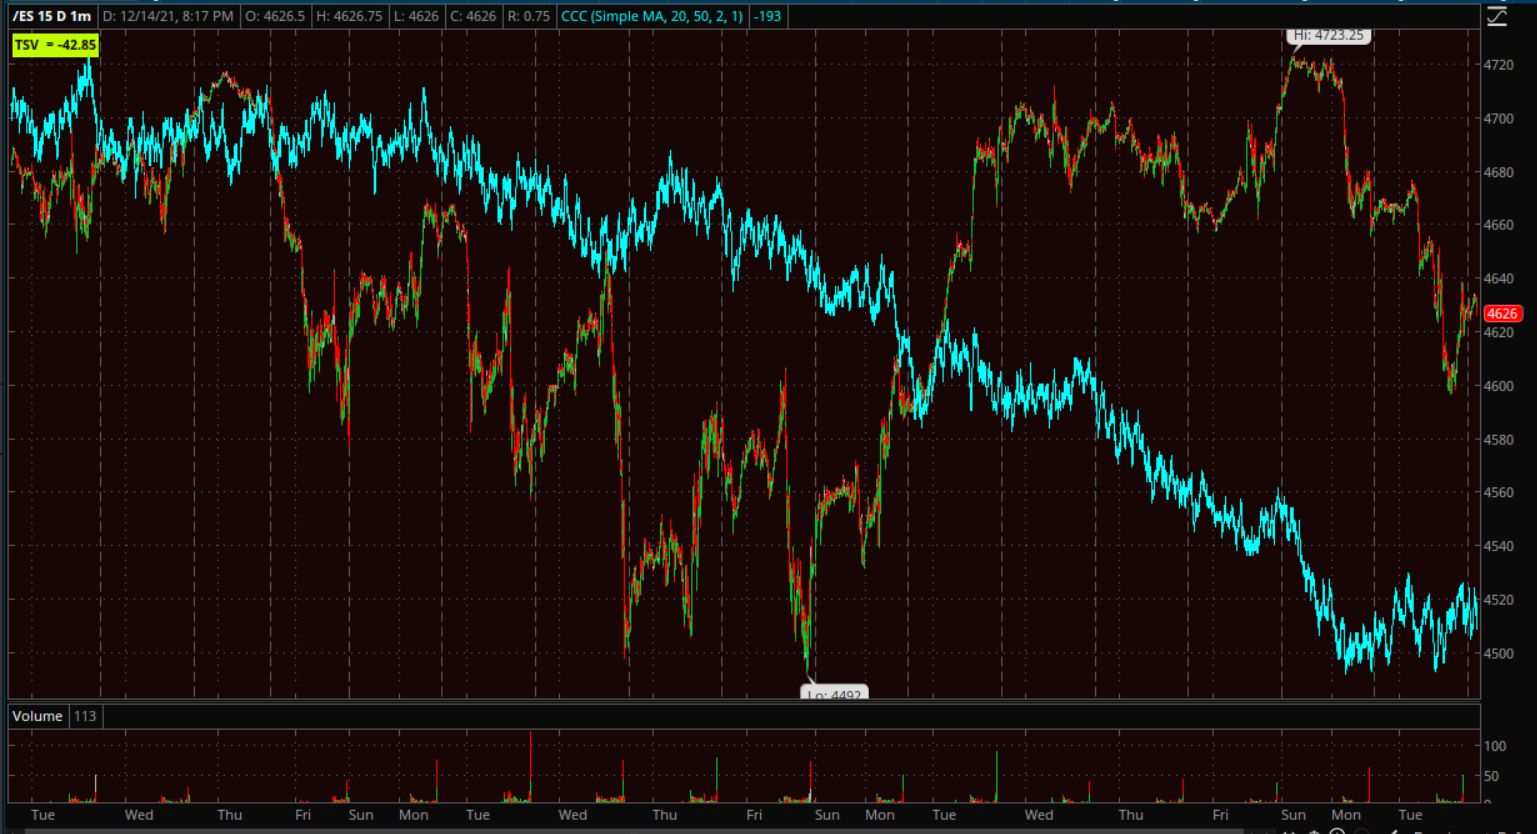
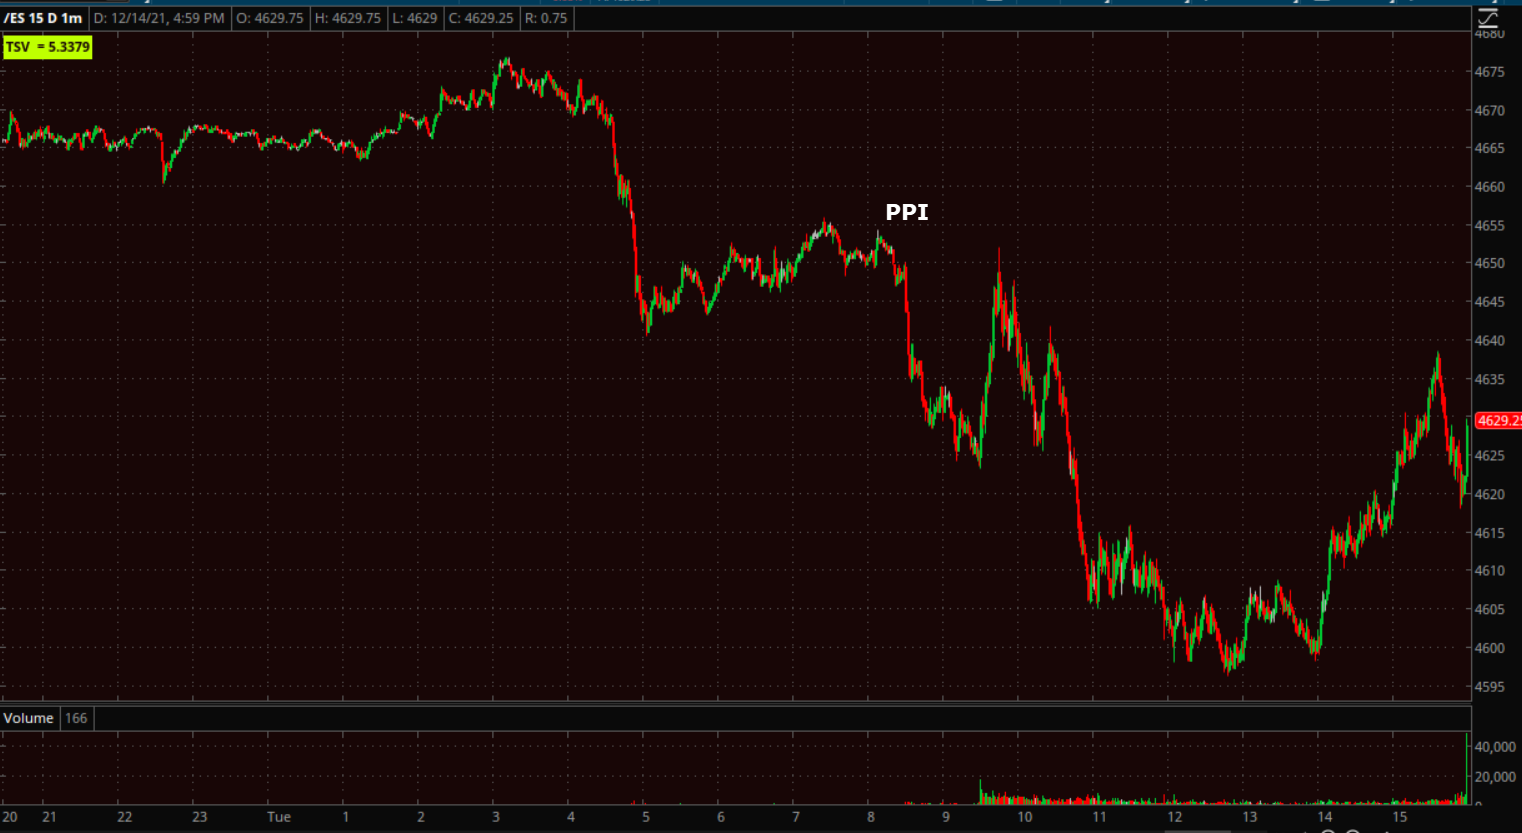 S&P futures (1m) after falling on the Hot PPI report, this afternoon the market eased off intraday lows as volatility came under some selling pressure as is common 24 hours ahead of major Fed events.
The PPI report bolsters expectations for the Fed to taper faster than planned and potentially be more aggressive with rate hikes, which some reasonably fear could stymie growth when the global economy is still struggling to fend off the coronavirus. The FOMC will conclude its two-day policy meeting tomorrow.
In other news, the U.S. Senate voted to raise the nation’s debt ceiling by $2.5 trillion, an amount intended to extend the government’s borrowing authority until early 2023.
Covid-19 hospitalizations are surging across New York state and New Jersey, and restrictions are coming back in some parts of Europe. Pfizer Inc.’s experimental Covid-19 pill was highly effective at keeping patients out of the hospital but less adept at erasing milder symptoms.
Averages
It’s not often that both large-cap Tech NASDAQ-100 and Small Cap Russell 2000 underperform on the same day, which, today at least, reflects both growth and inflation concerns. Similar concerns are evident in S&P sector performance.
S&P 500 ⇩ -0.75 %
NASDAQ ⇩ -1.04 %
DOW JONES ⇩ -0.30 %
RUSSELL 2000 ⇩ -0.96 %
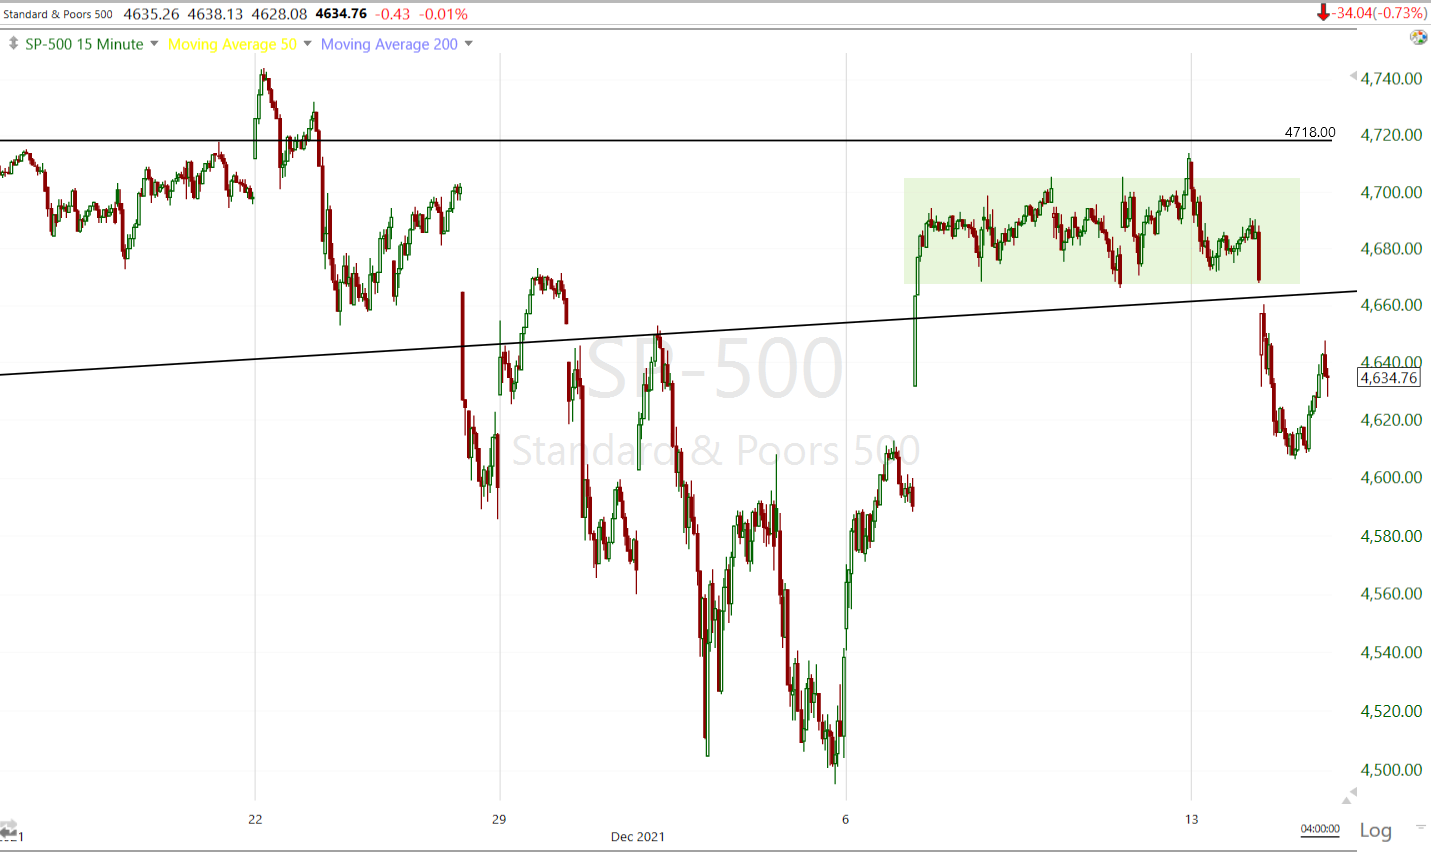 SP-500 (15m) as pointed out last night, filled the gap as expected, but hasn’t been able to push further than that with a brief foray above $4700 (local resistance) rejected.
On the other side, the averages haven’t seen that much selling and have held technical support ahead of the FOMC
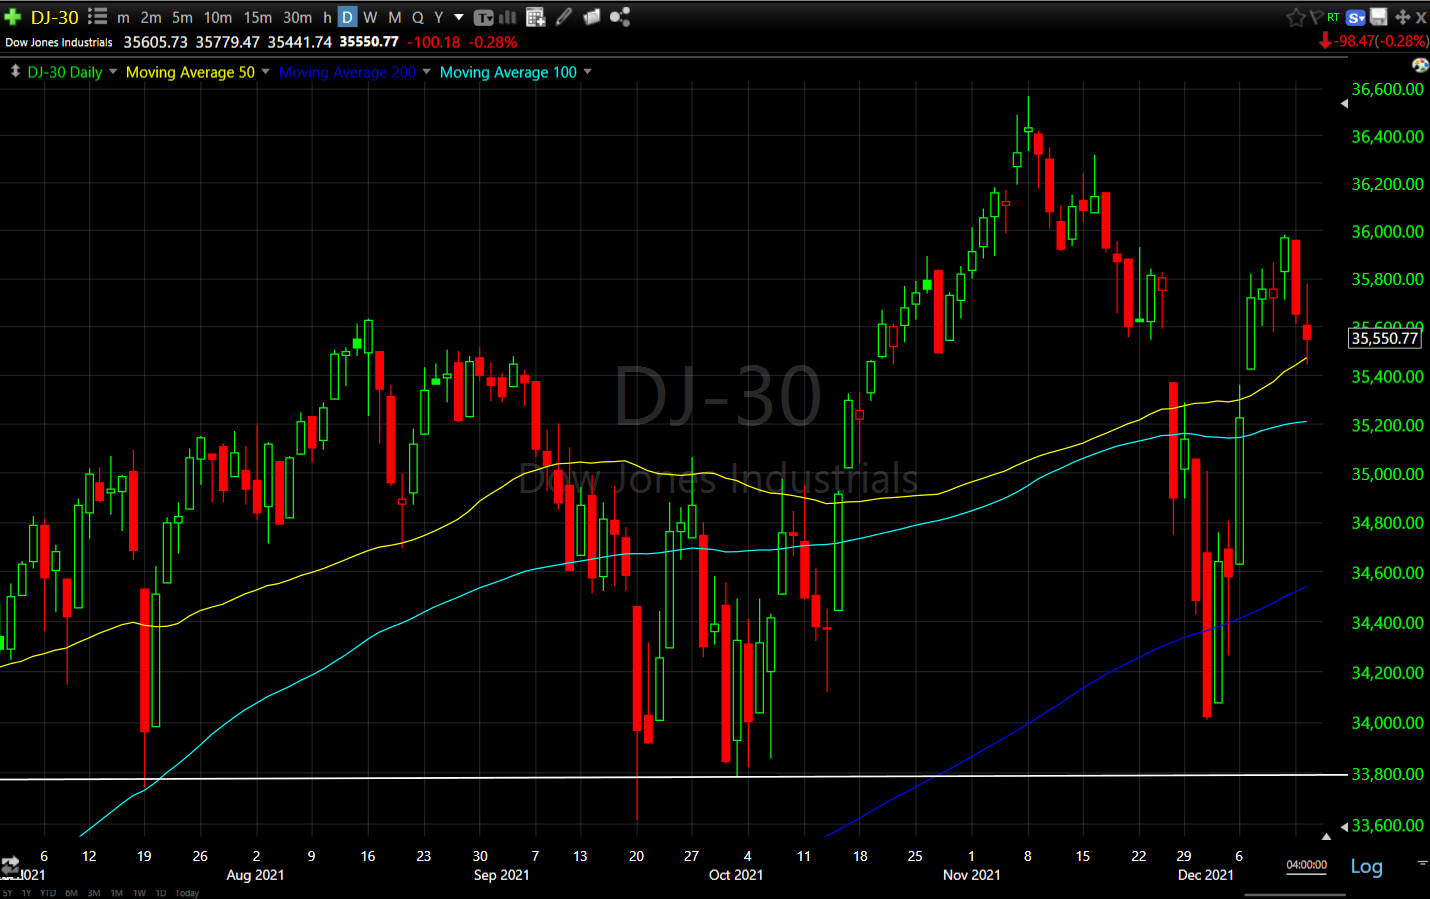 Dow (daily) holding its 50-day today
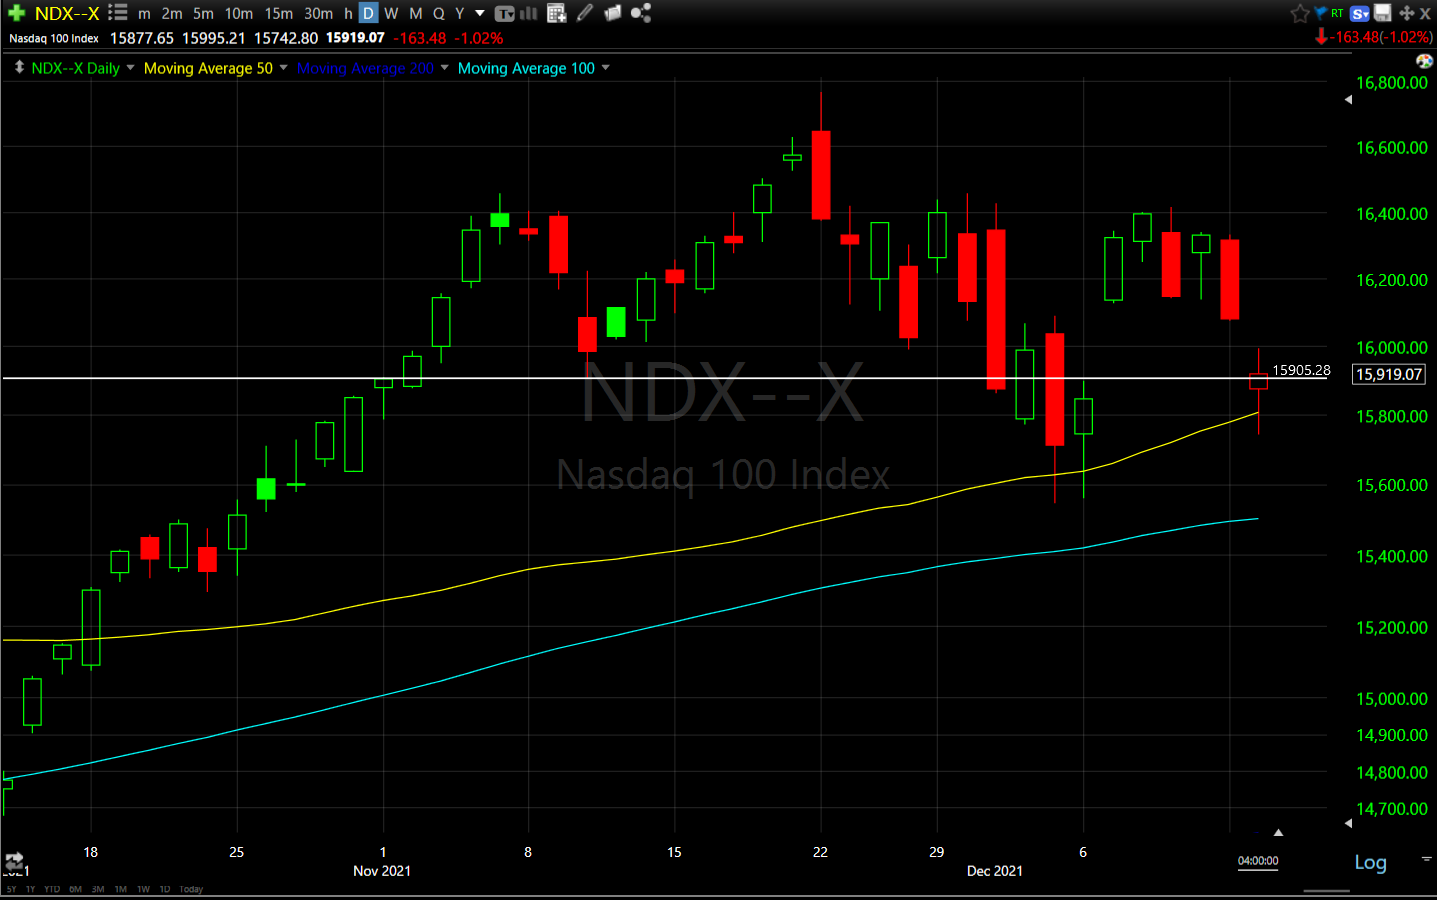 NASDAQ-100 (daily) holding its 50-day today
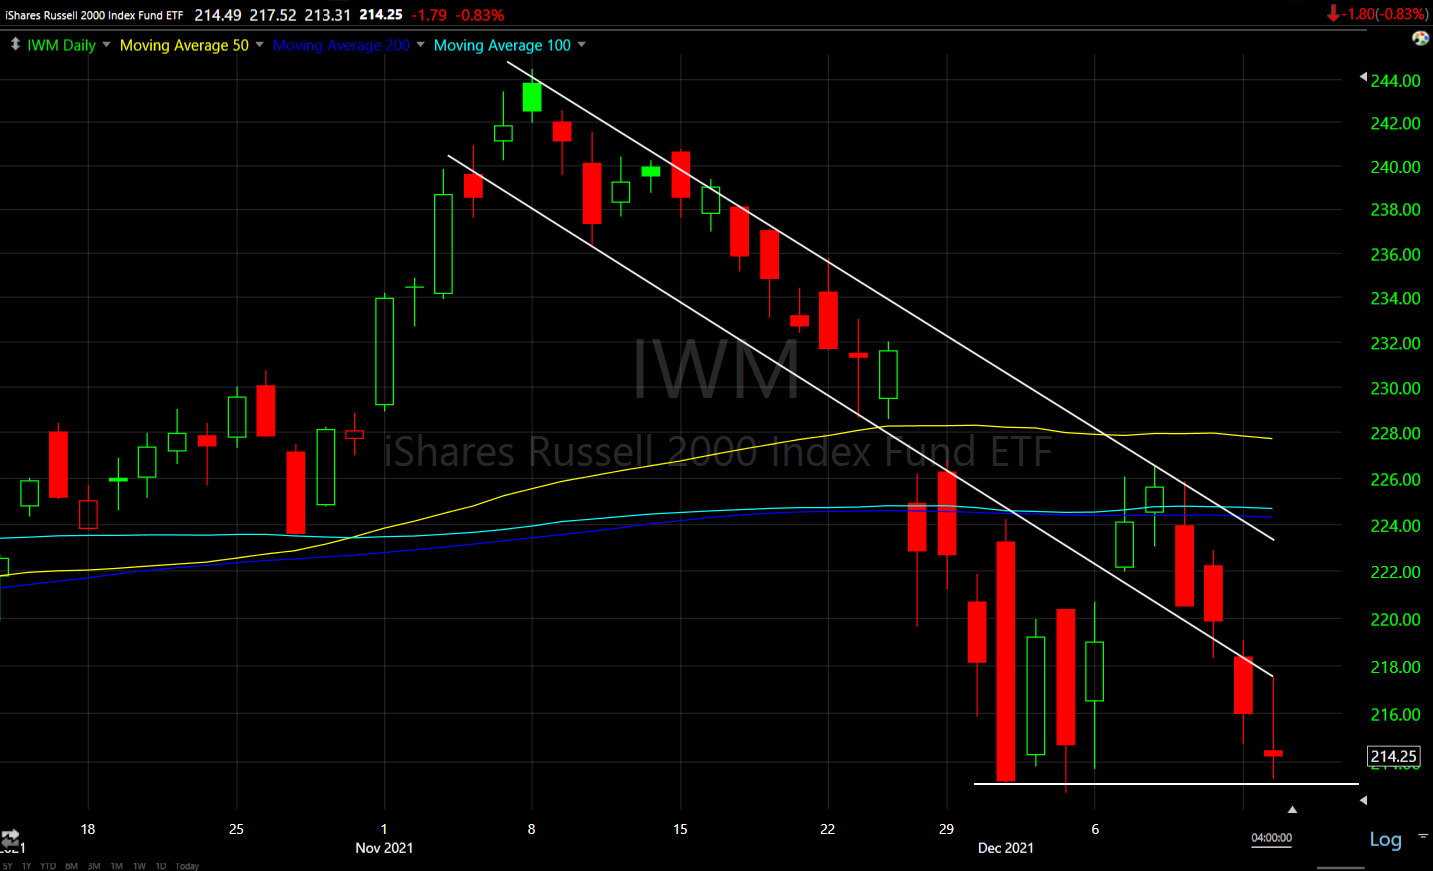 Small Caps (daily) tested down to the December lows.
Small Caps got some early support from short covering in the most shorted stocks, but in recent days Goldman Sachs basket of the 50 most-shorted stocks has slipped into a bear market for the first time since June giving short sellers the best three-day run in 17 months amid a 8.6% plunge in the most-shorted index during that time.
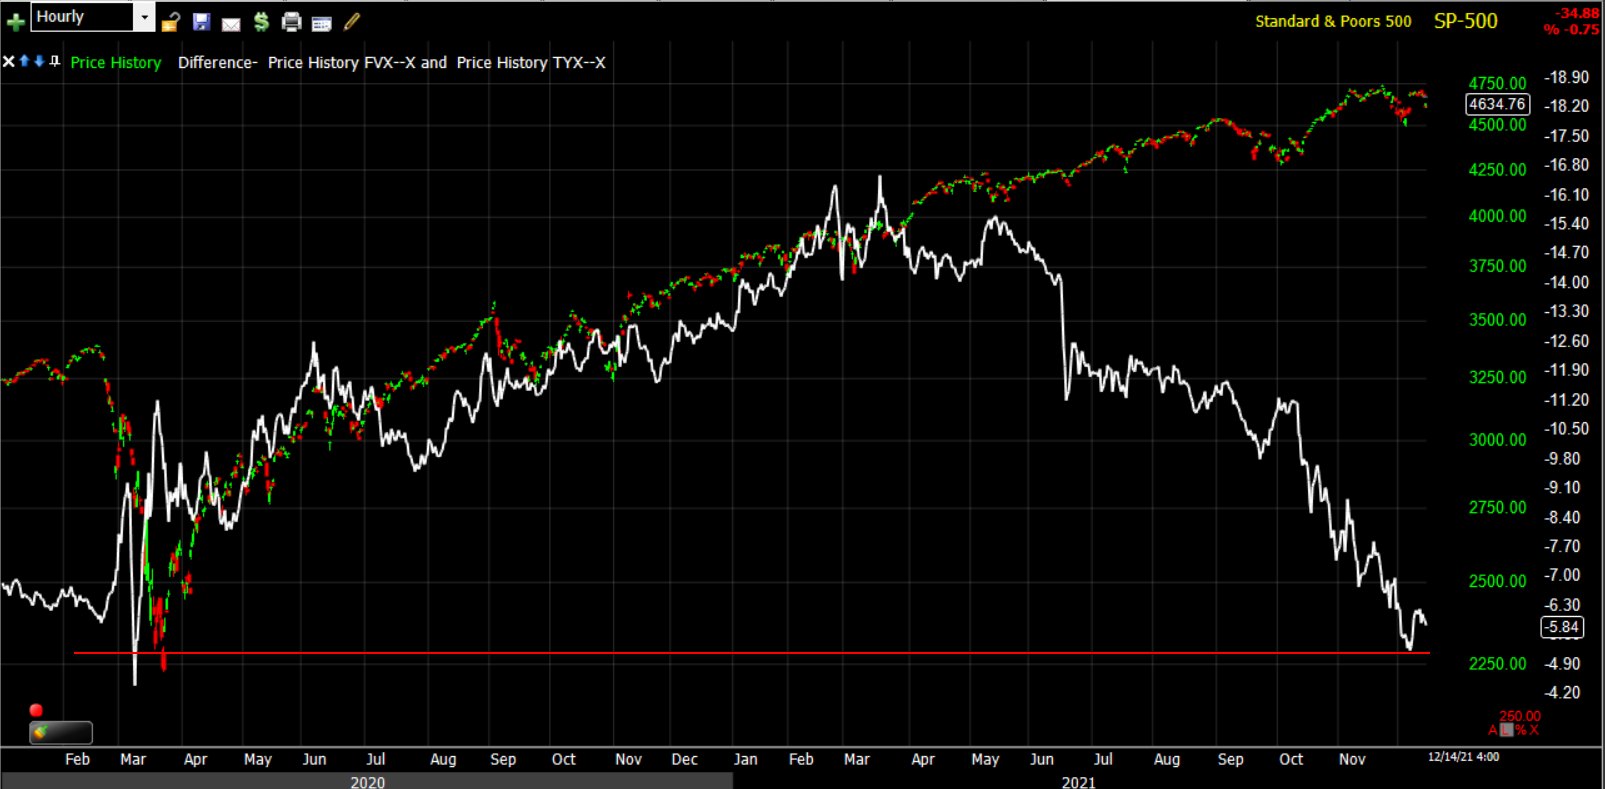
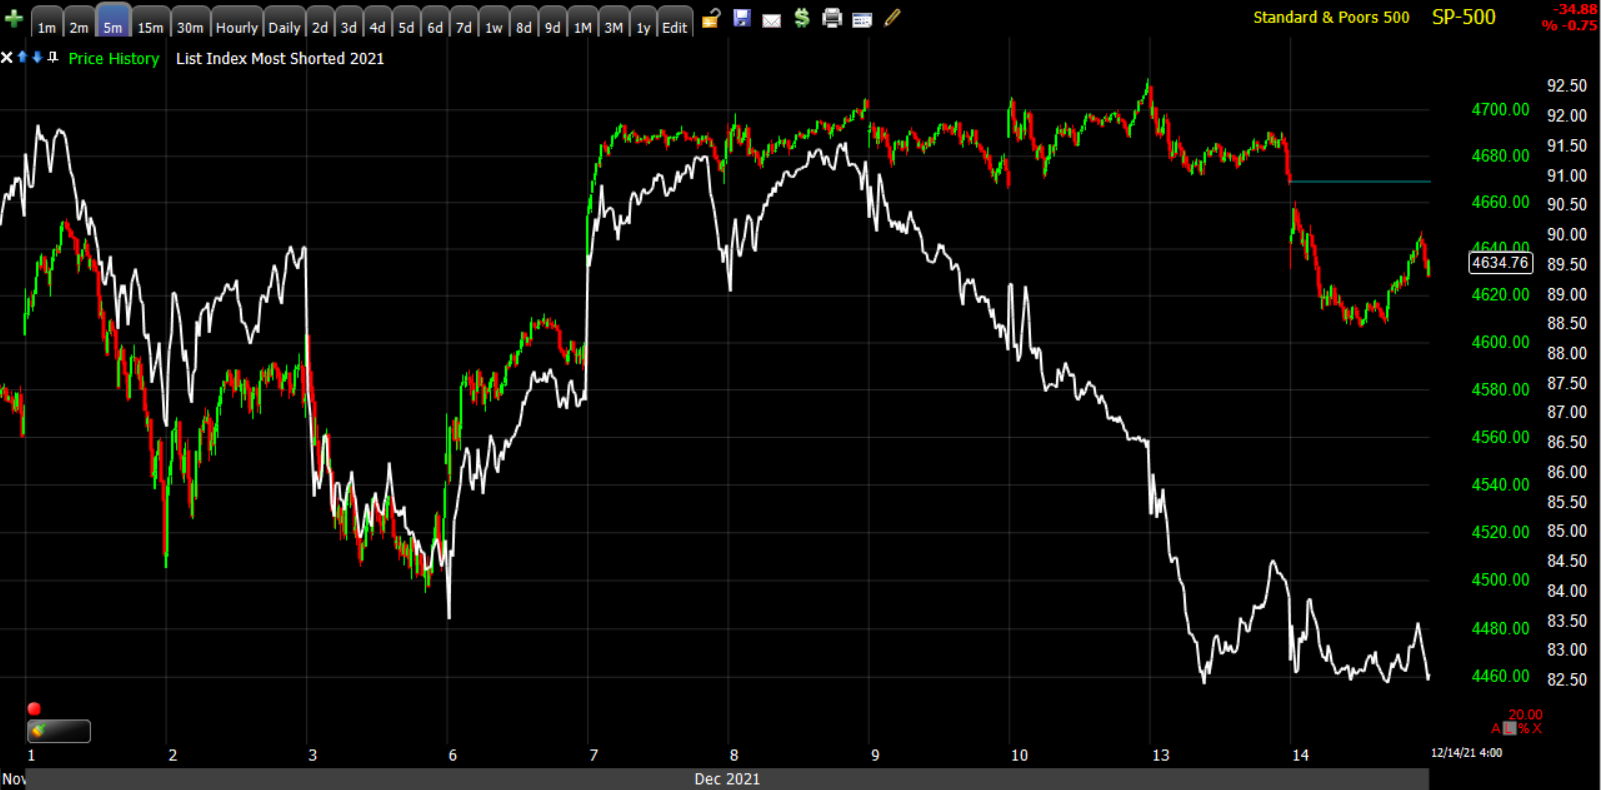 SP-500 (5m) and Most Shorted Index (white)
As for 3C charts, there hasn’t been much movement this week as the averages have largely consolidated sideways since filling gaps.
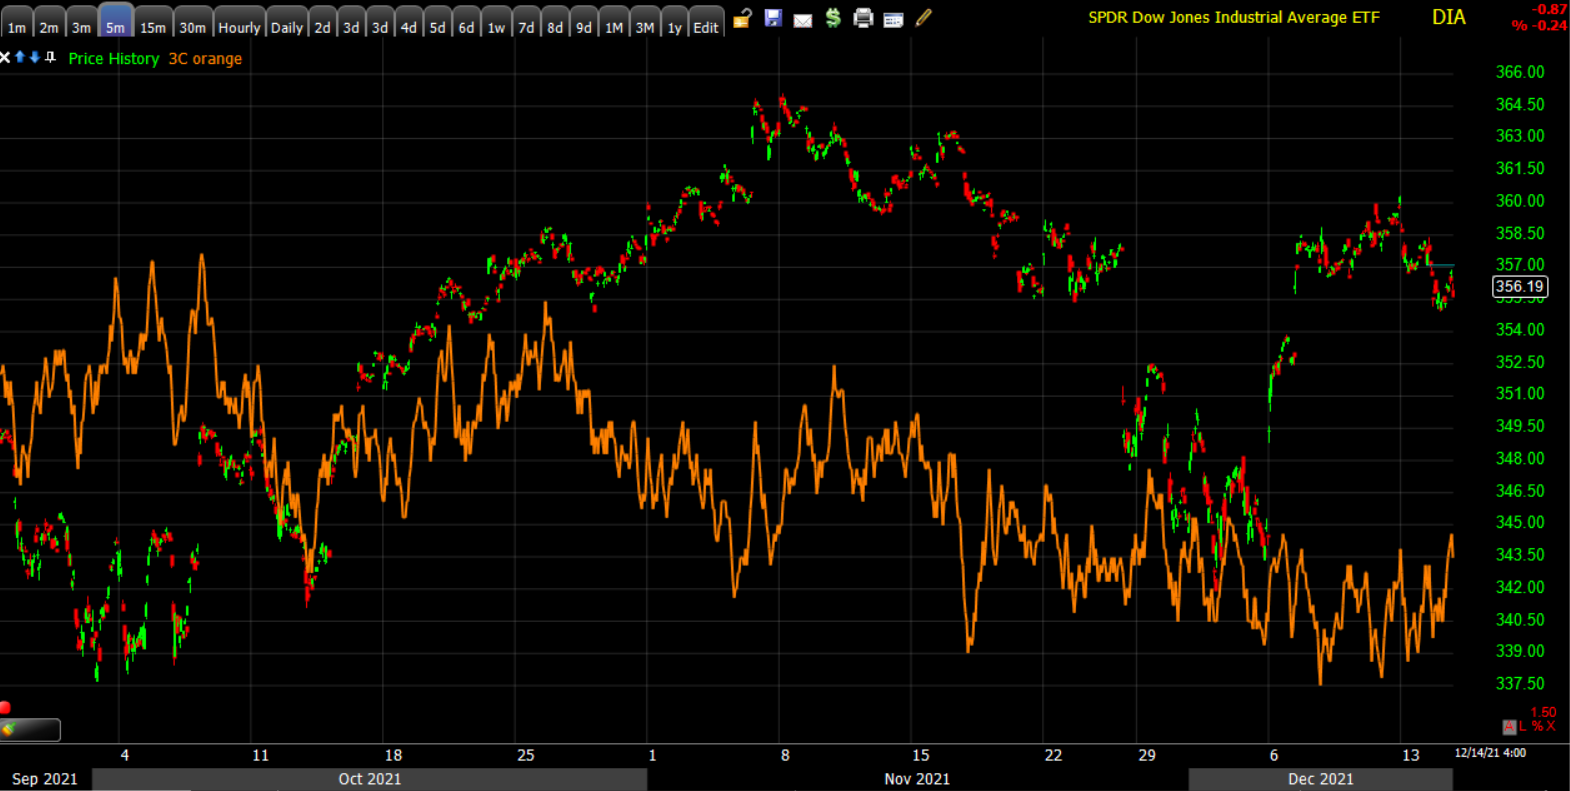 DIA (5m) – while there’s not much movement today, the lack of 3C confirmation of the gap fill rally suggests that smart or institutional money used the opportunity to sell into price strength, or what might be called, “distribution”.
Volatility came under the typical selling pressure this afternoon almost exactly 24 hours ahead of the FOMC. I’ve seen this dynamic for many years and I believe it’s a result of the New York Fed’s Open Market’s desk selling volatility in order to mitigate adverse market reactions to major Fed announcements as to not influence policy makers who may be worried about adverse market reactions to their policy directives. That’s my opinion, but what is fact is the selling pressure was evident around 1 p.m. ET (25 hours ahead of the FOMC policy statement) as posted this afternoon .
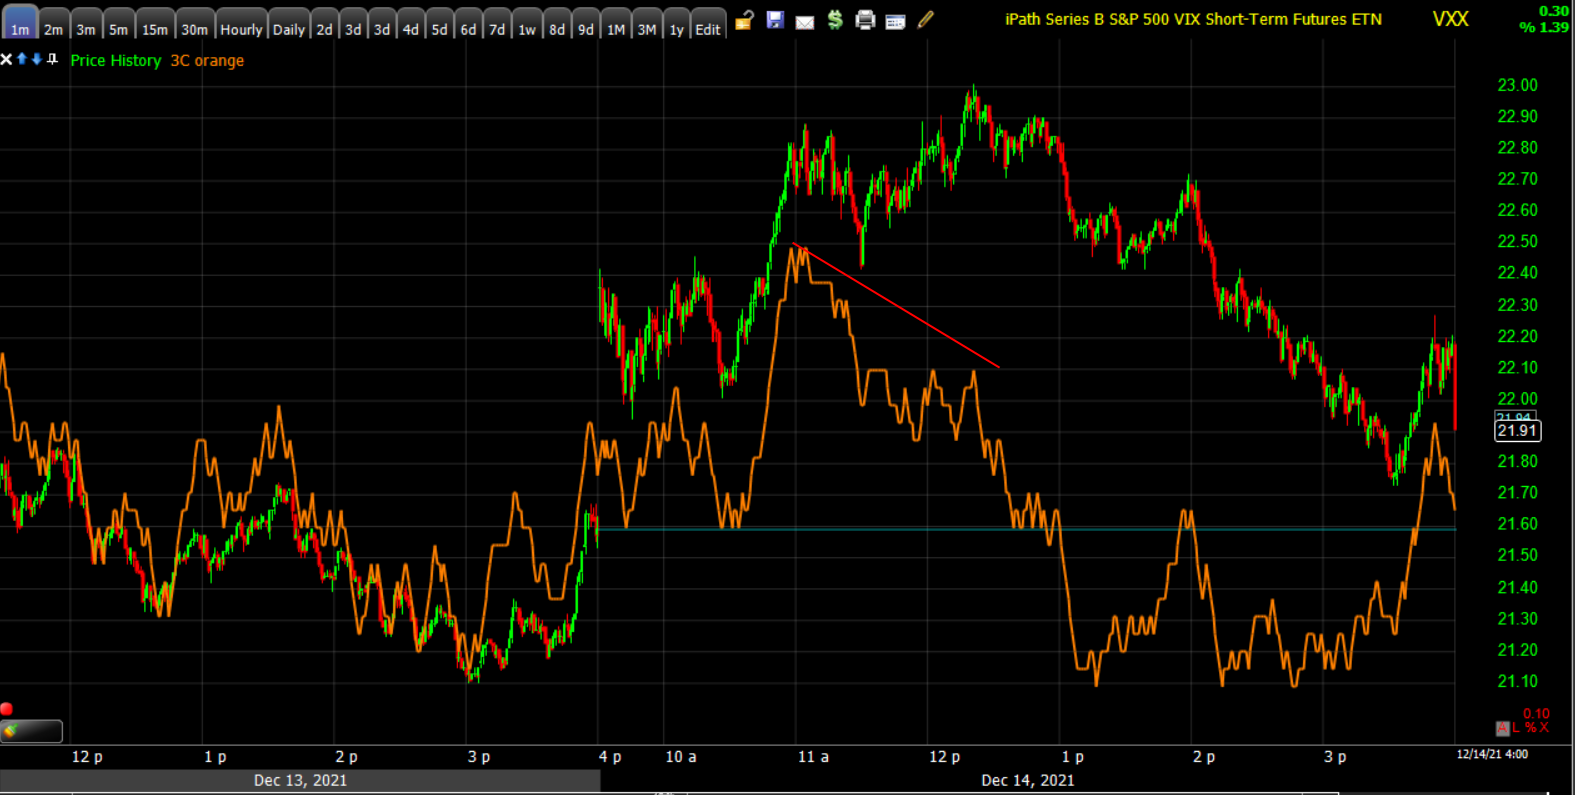 VXX (1m) negative 3C divergence into session highs today.
Furthermore, VIX (+7.8%) which has been acting normally the last week, did see some slight relative weakness today.
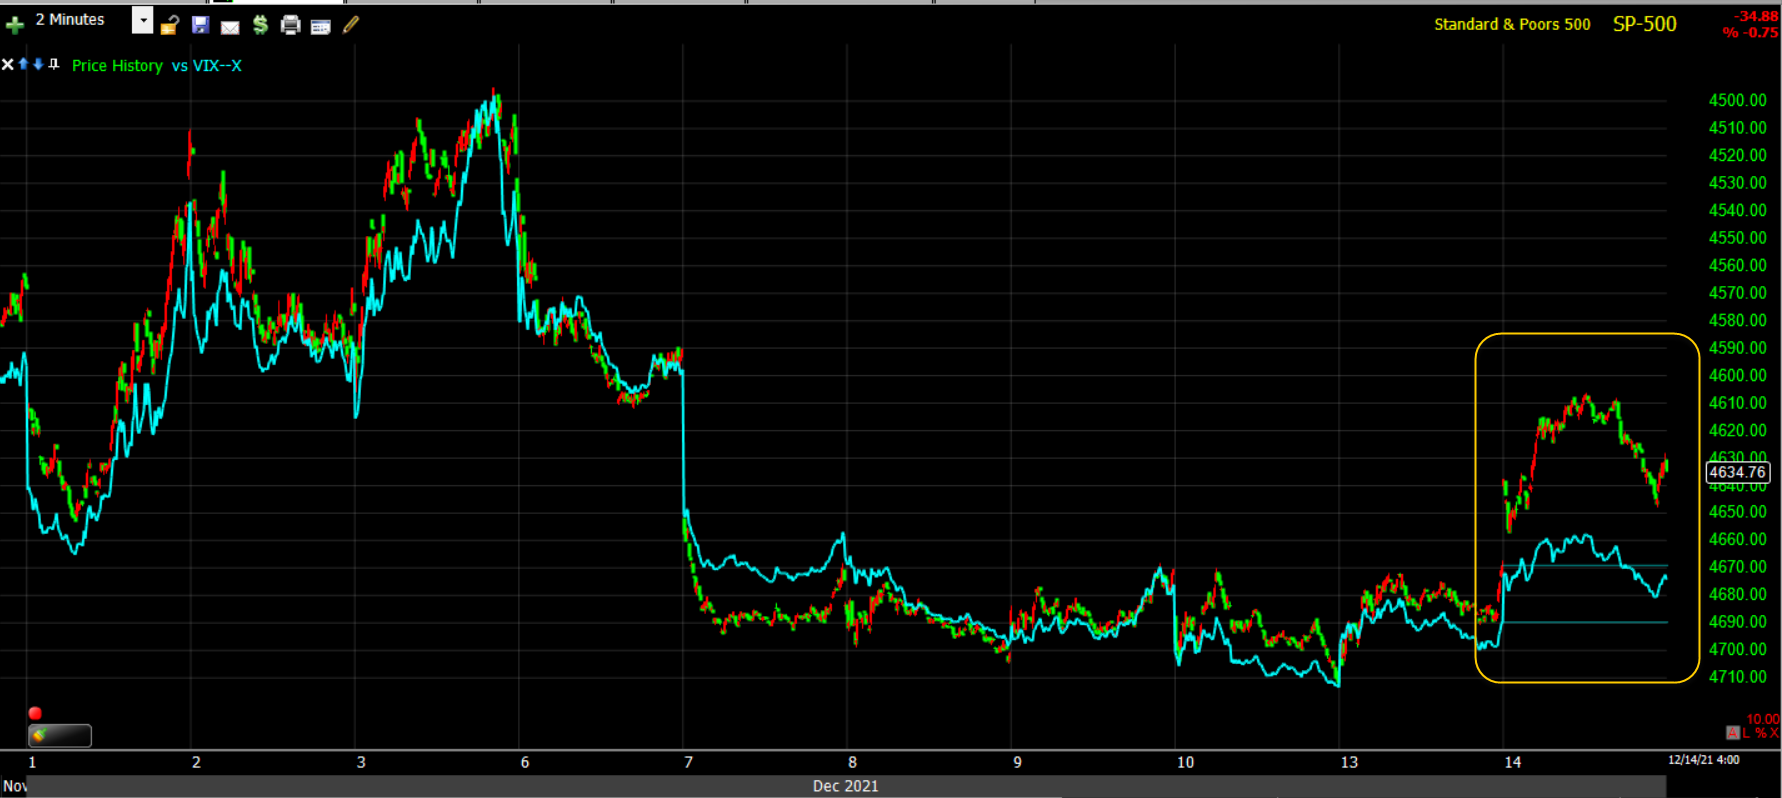 SP-500 (2m) inverted and VIX (blue) with a fairly normal relationship until today with VIX displaying some slight relative weakness.
S&P sectors
Only 2 sectors ended higher, one cyclical – Financials with higher yields, and the other defensive – Consumer Staples. The Technology sector led the retreat with influential weakness in large-cap Tech including Apple (AAPL -0.8%) — even though BofA Securities upgraded AAPL to Buy from Neutral, Alphabet (GOOG -1.2%), Adobe (ADBE -6.6%) — ADBE was downgraded to Neutral from Overweight at JP Morgan, and Microsoft (MSFT -3.3%). Microsoft saw its biggest drop since Oct 2020, testing its 50-day sma.
Materials ⇩ -0.10 %
Energy ⇩ -0.41 %
Financials ⇧ 0.60 %
Industrial ⇩ -0.95 %
Technology ⇩ -1.64 %
Consumer Staples ⇧ 0.07 %
Utilities ⇩ -0.60 %
Health Care ⇩ -0.40 %
Consumer Discretionary ⇩ -0.58 %
Real Estate ⇩ -1.10 %
Communications ⇩ -0.26 %
Internals
NYSE Decliners (2334) outpaced Advancers (970) by better than a 2-to-1 margin on Volume of 1 bln. shares.
The Dominant price/volume relationship leaned toward Close Down/Volume Up (typical 1-day oversold condition), but the relationship wasn’t that dominant, just a slight edge. Between S&P sectors, NYSE internals and the p/v relationship, today’s internals represent a weak 1-day oversold condition.
As the averages have largely consolidated sideways since filling the Thanksgiving gap, participation has fallen off evident in the NASDAQ Composite’s A/D line moving below the December lows.
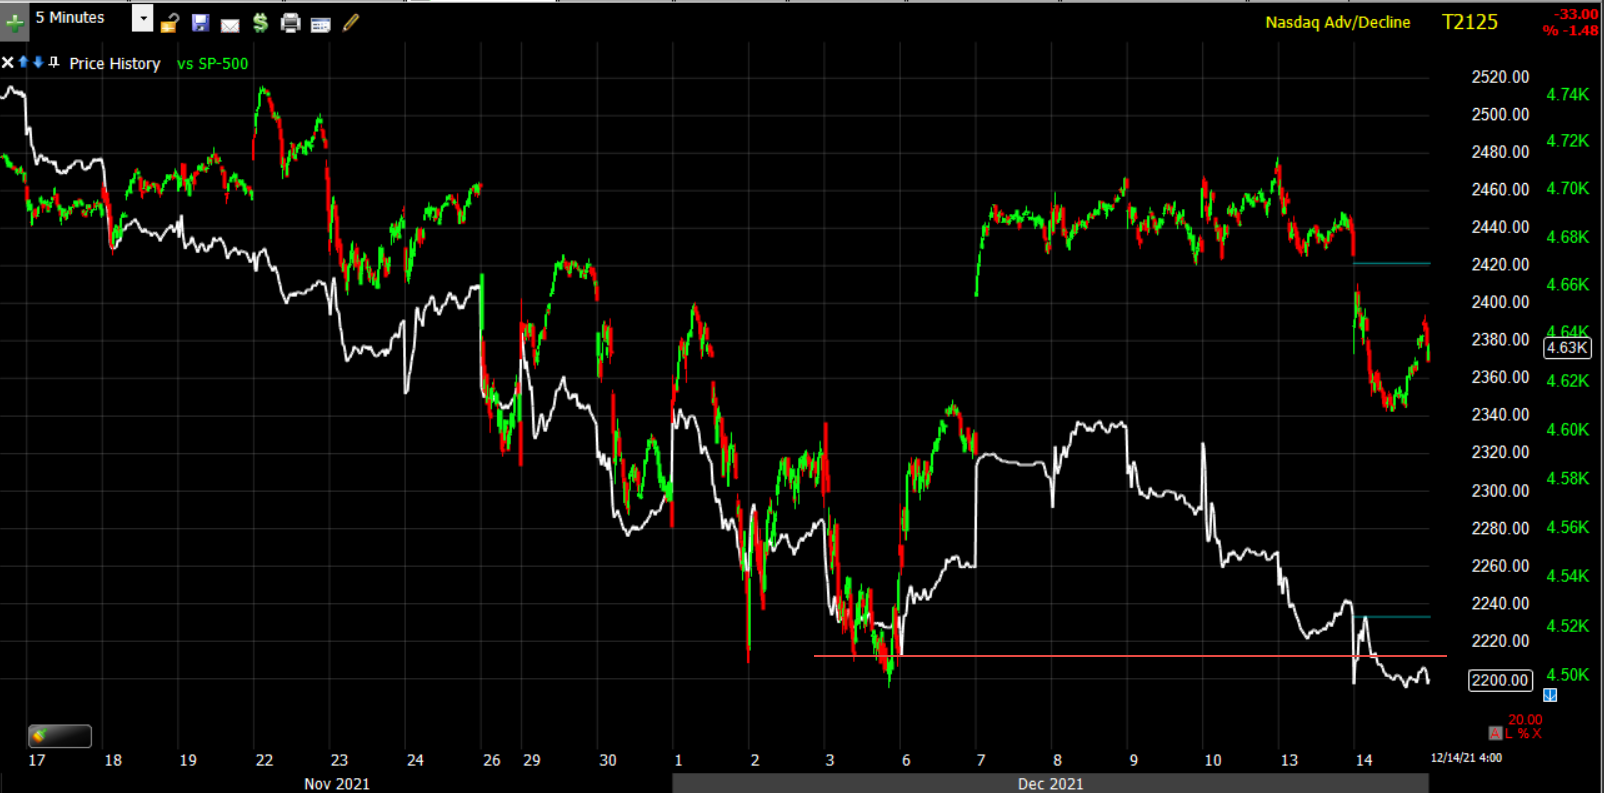 SP-500 (5m)
NYSE 52 week new lows rose once again, which is normal on a day the averages are down.
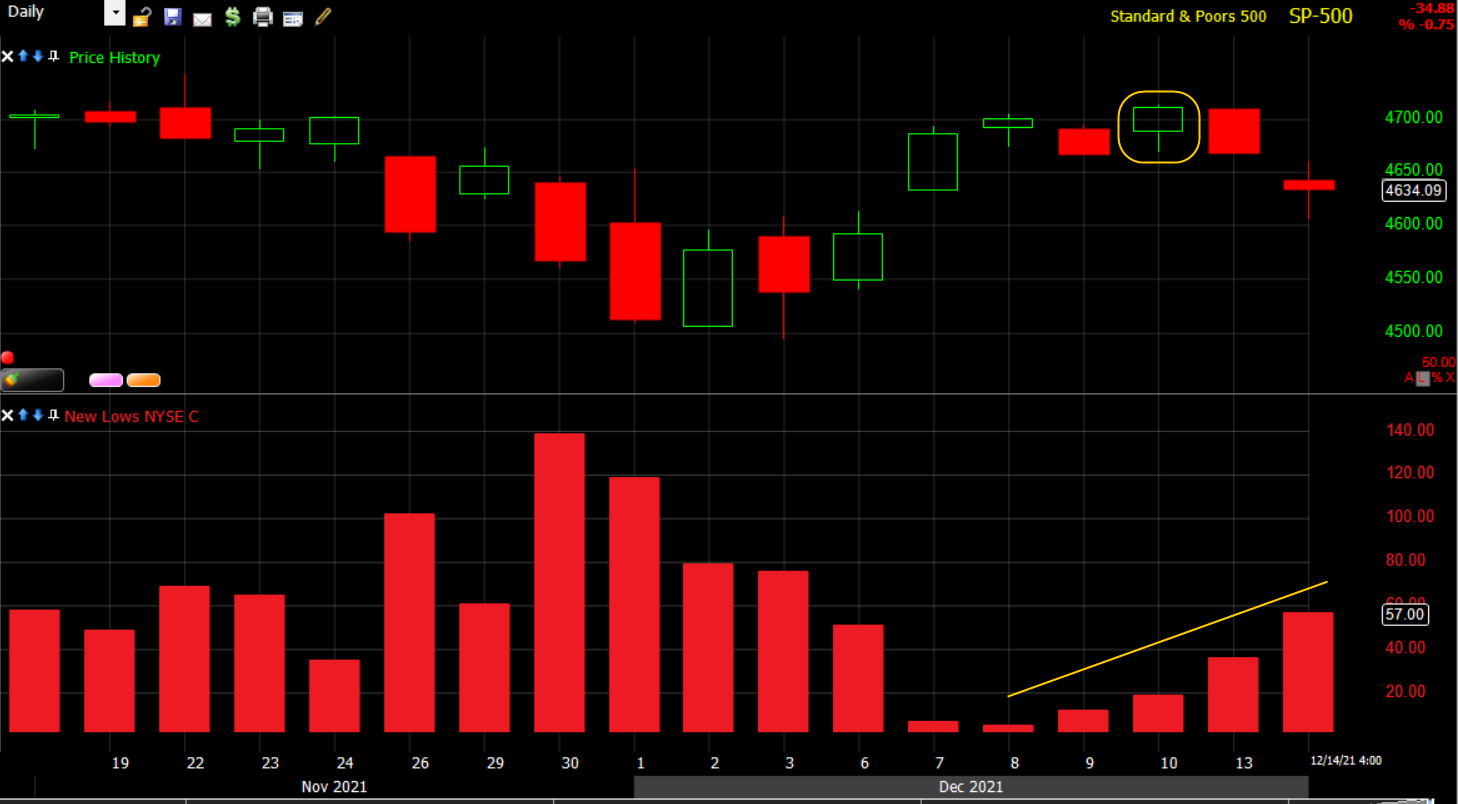 SP-500 (daily) the one day they should not have rose was Friday (yellow). As a reminder the highs of new lows in early December were the highest since the COVID crash.
Breadth Oscillators that were deep oversold at the start of the month reset to overbought on the initial rebound to fill the gaps, but are now back in oversold territory. This obviously is not a result of a deep market correction, but weakening market breadth/participation.
 SP-500 (15m) and NYSE 13 week new high/new low ratio at 10 (oversold territory).
Treasuries
The Fed-sensitive 2-year yield increased two basis points to 0.66%, and the 10-year yield increased one basis point to 1.44%. In my opinion the reaction in the Treasury market to the hot inflation data (PPI) was modest and a curious development. The gains in yields may have been capped by growth concerns. This seems to be a theme in the averages’ and S&P sector performance today.
Persistent yield curve flattening since the November FOMC has been sending the Fed a a pretty clear message, which may be why Powell finally capitulated on the “transitory inflation” narrative recently. The bond market just hasn’t been buying it, and with a 3rd Dot-plot likely to contradict Powell’s “transitory” mantra, he may have had little choice in capitulating to maintain some degree of credibility.
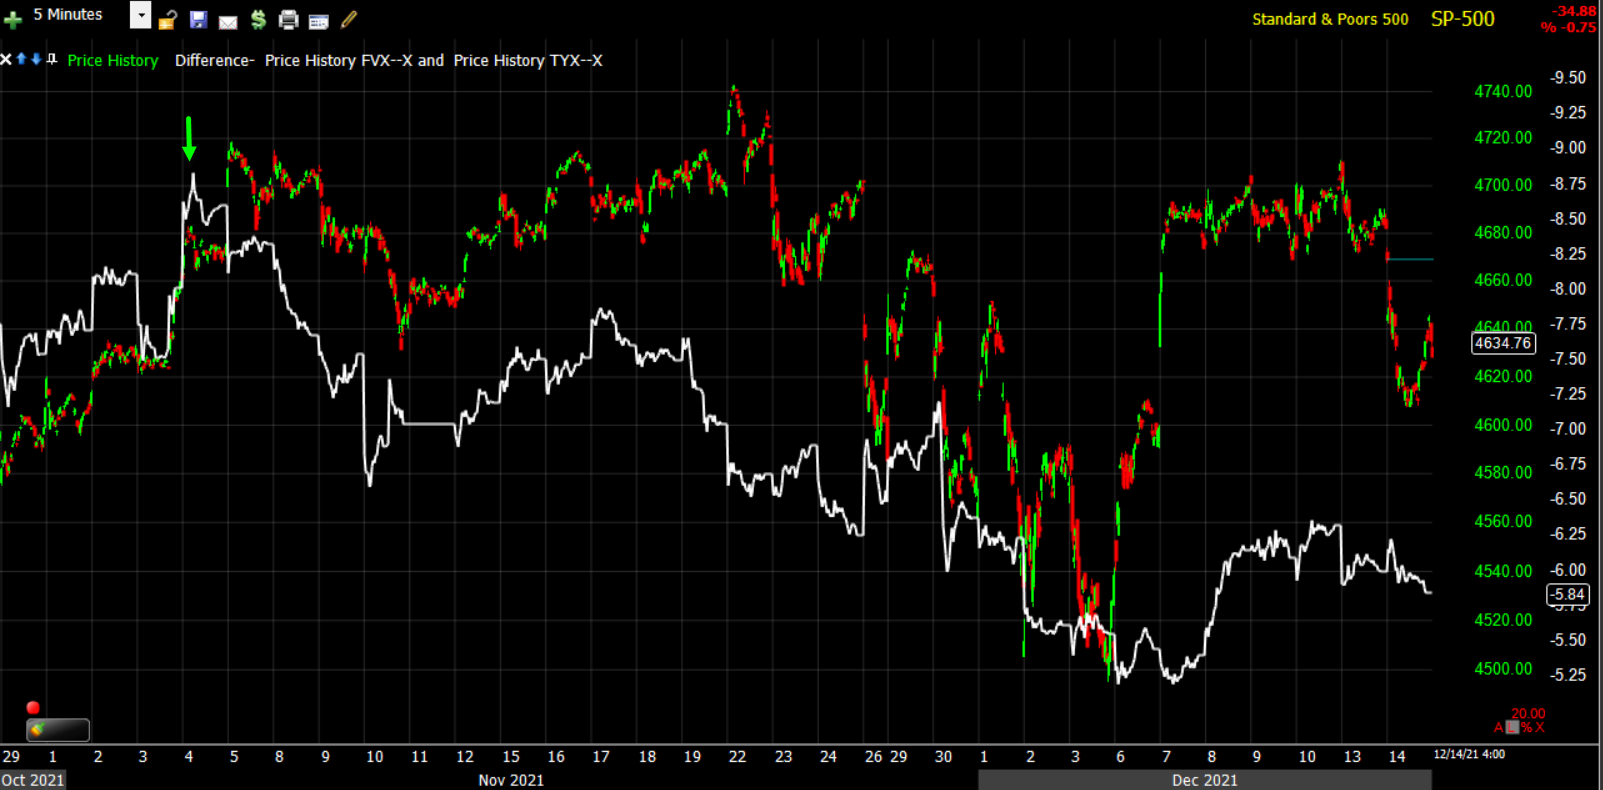 SP-500 (5m) and the 5s-30s curve since the November FOMC, and more to the point, a curve that has nearly hit the flattest since the COVID crash….
 SP-500 (60m) and 5s-30s curve. We’ve seen this flattening each week so it may not jump out as shocking, but viewing it with fresh eyes for the first time, this chart is screaming that the bond market has little faith in the Fed, which again is likely another reason Powell had to capitulate on the transitory narrative to maintain some shred of credibility.
Currencies and Commodities
The U.S. Dollar Index rose 0.3% with Treasury yields to 96.58
 U.S. Dollar Index (1m) retracing overnight losses on the PPI report (hawkish)
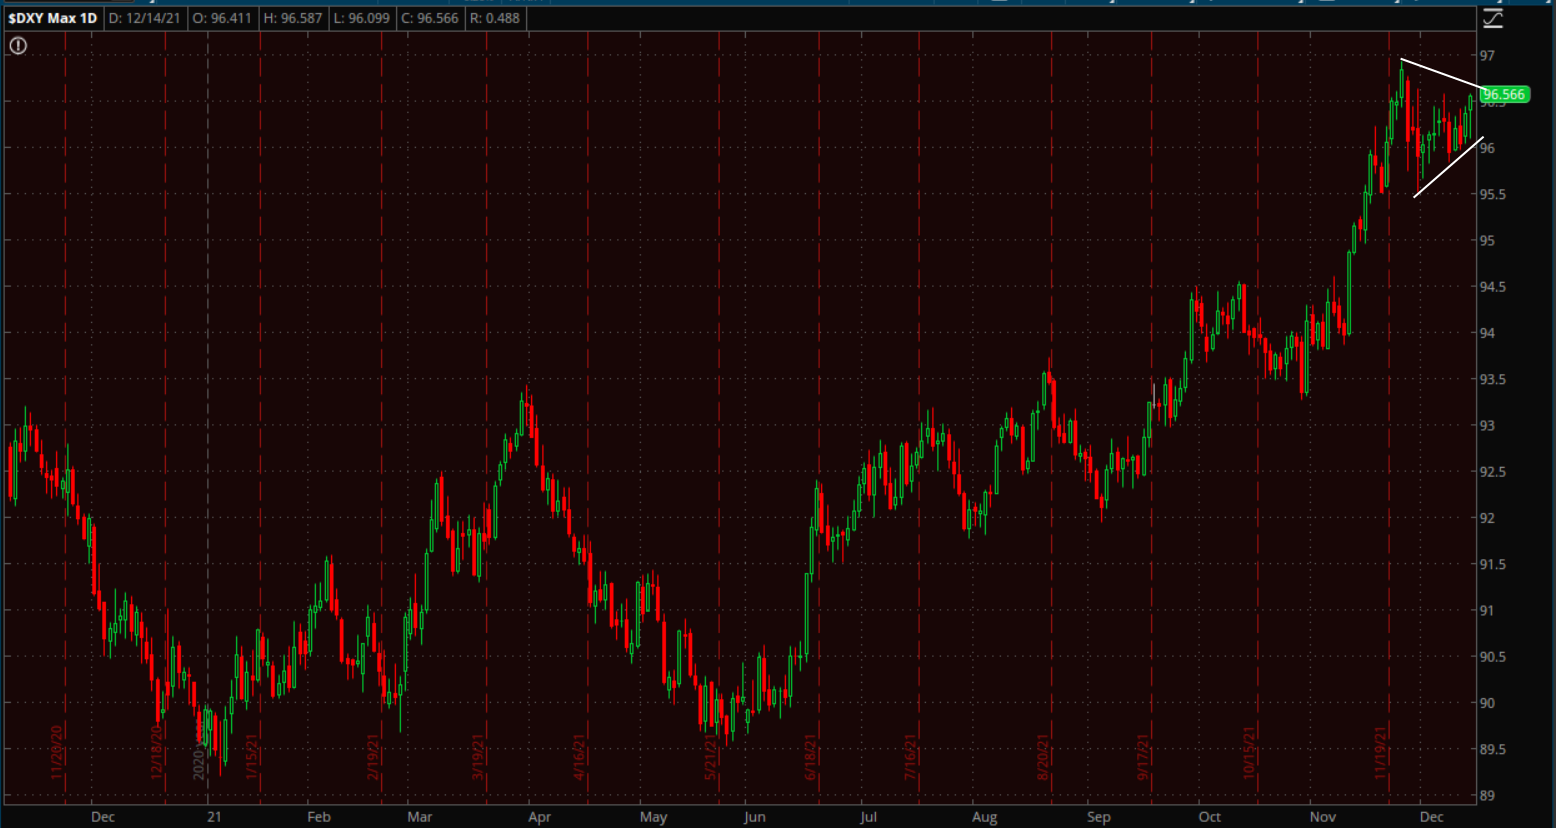 And more broadly the Dollar Index (daily) has been sitting in a bullish consolidation heading into the Fed.
WTI crude futures fell -0.9% to $70.57/bbl., but remain just above the 200-day. The International Energy Agency said the global oil market has returned to surplus, while some countries tightened curbs against the omicron variant.
 WTI (daily) w/ 200-day sma
Gold futures fell -0.9% to $1,772.30/oz, its lowest close in about two weeks, amid a modest rebound in the greenback.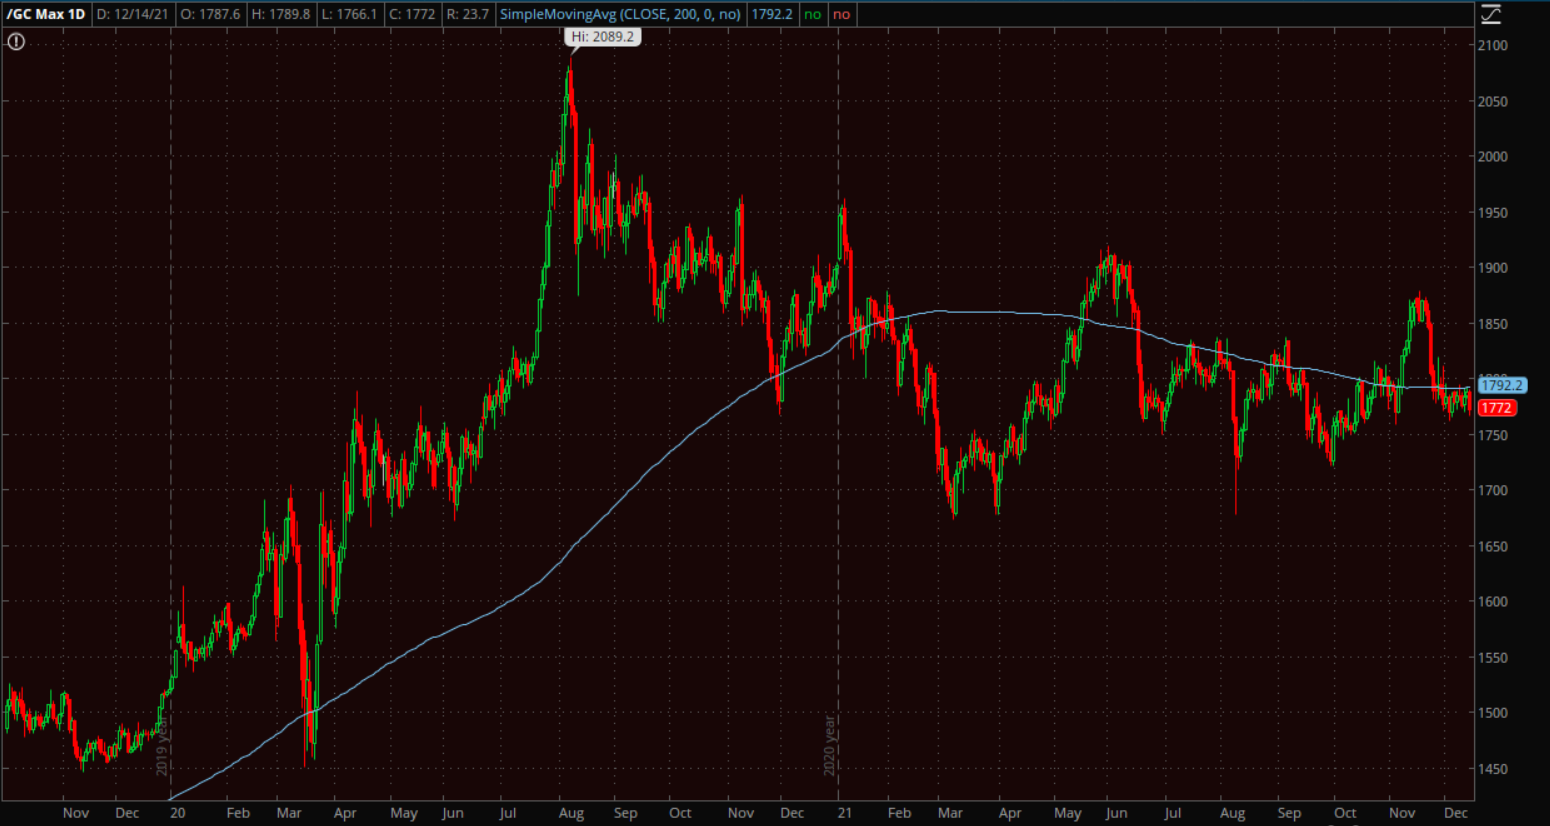 Gold futures (daily) remain below their 200-day sma
Bitcoin was relatively quiet today, holding its 200-day for a second day.
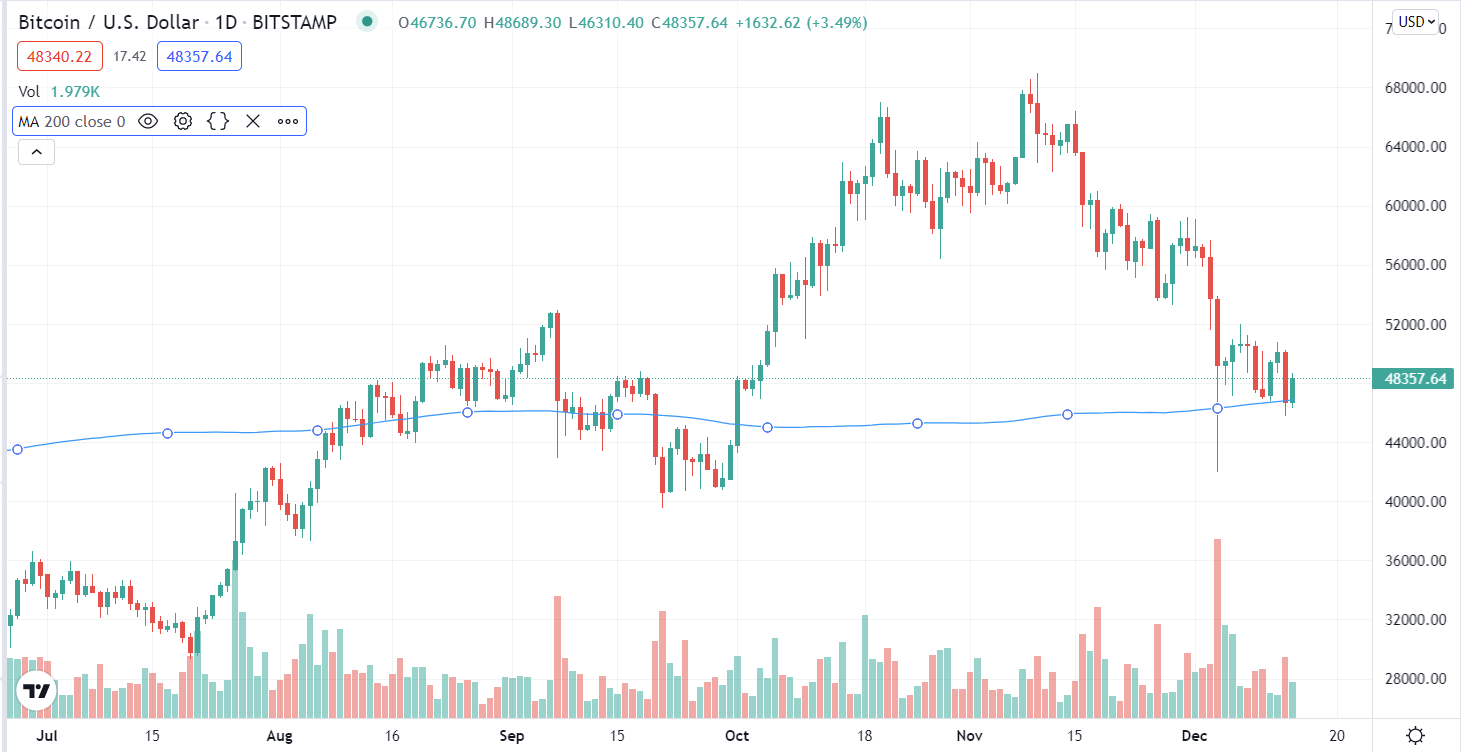 BTC/USD (daily)
Ethereum is just below its 100-day
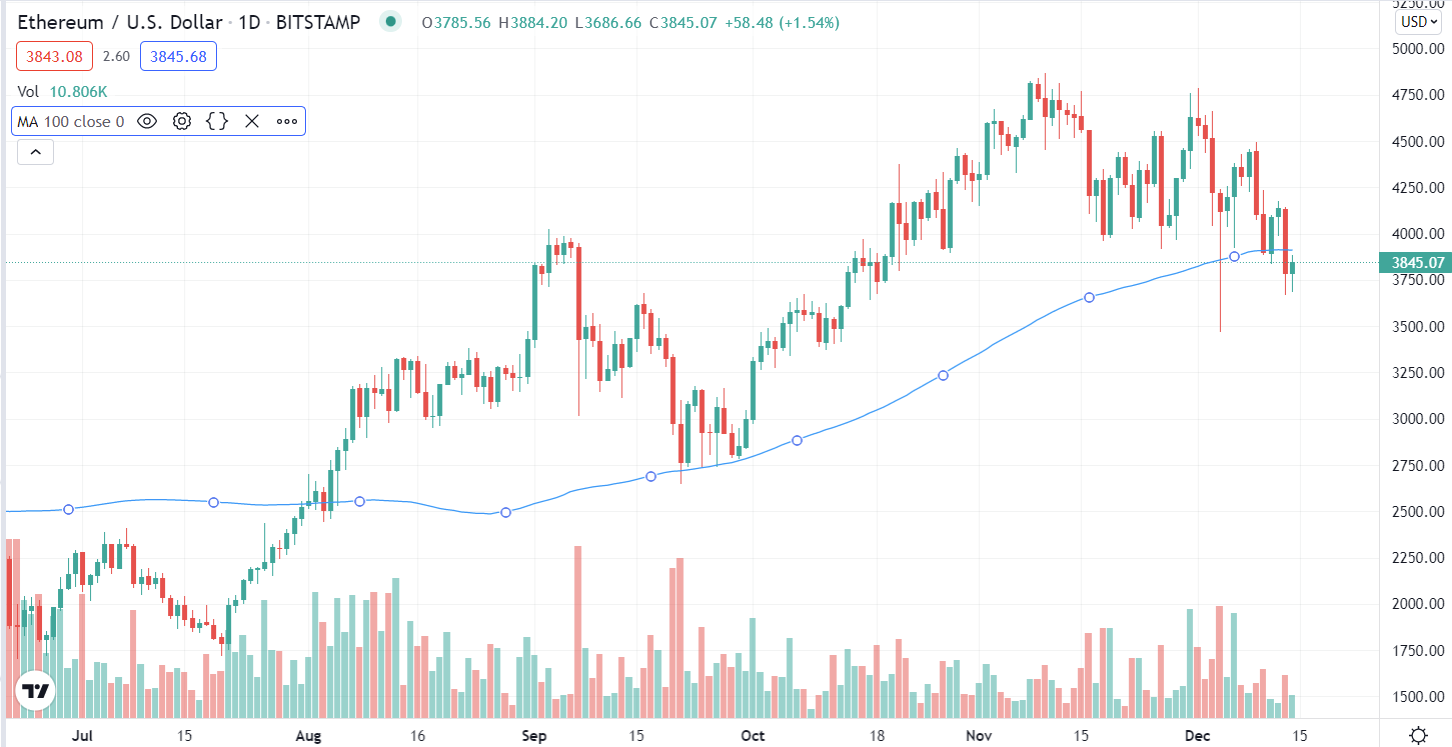 ETH/USD (daily)
Summary
On Friday, December 3rd in the closing Afternoon Update I said,
“My guess at this point is that we’ll see an oversold bounce to fill or try to fill last week’s gaps down between now and the December 15th FOMC meeting”
The Dow and S&P filled the gap (NASDAQ-100 didn’t have a gap to fill), but haven’t been able to push any further in upside follow through. As far as I’m concerned, the averages did what was expected in the window afforded.
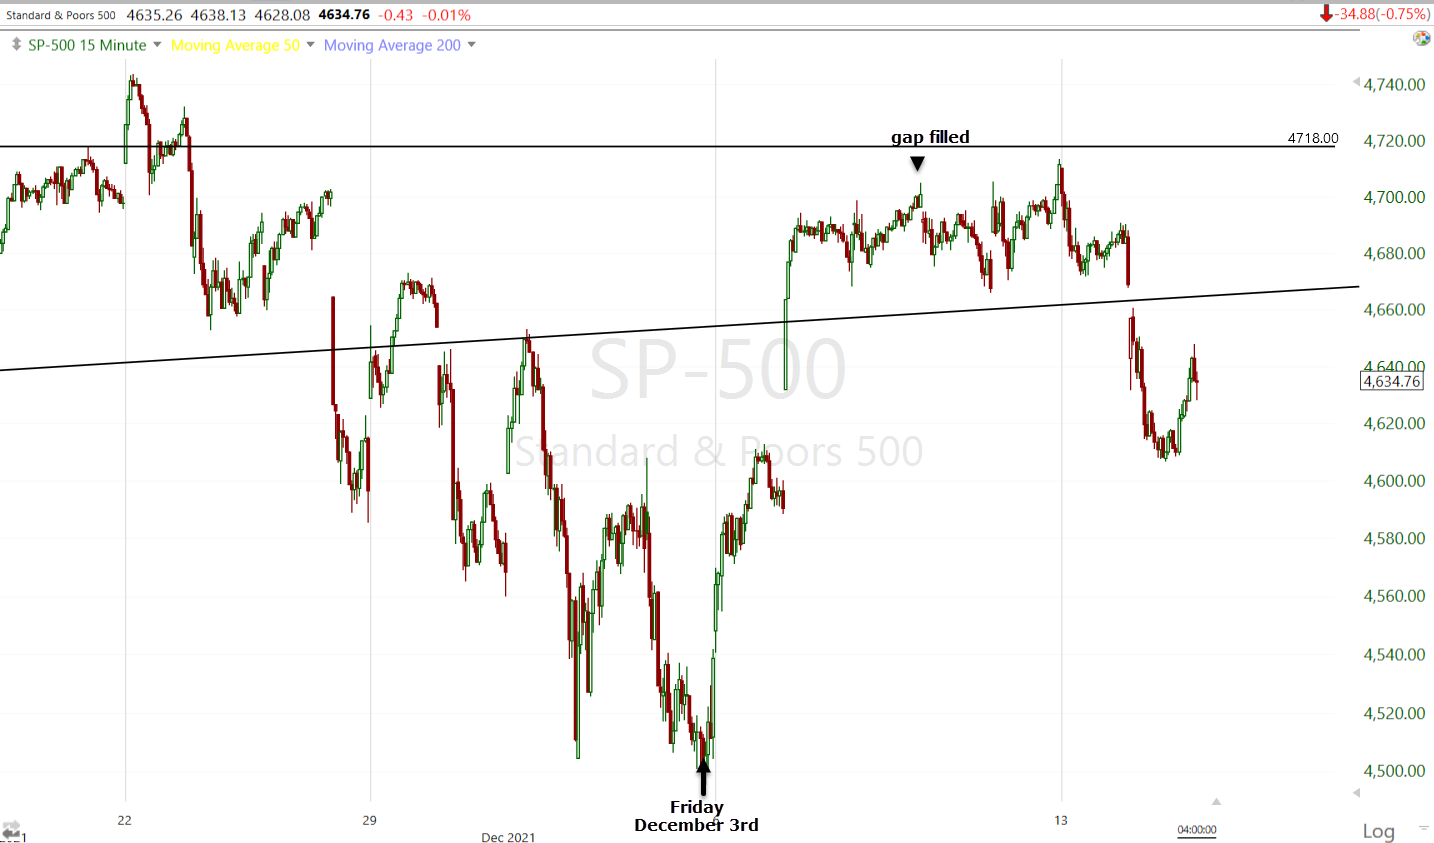 SP-500 (15m) filled the gap in short order, but wasn’t able to add anything beyond that as expected.
The only average that didn’t fill the gap was Small Caps, but they had further to go and a more challenging technical set of circumstances.
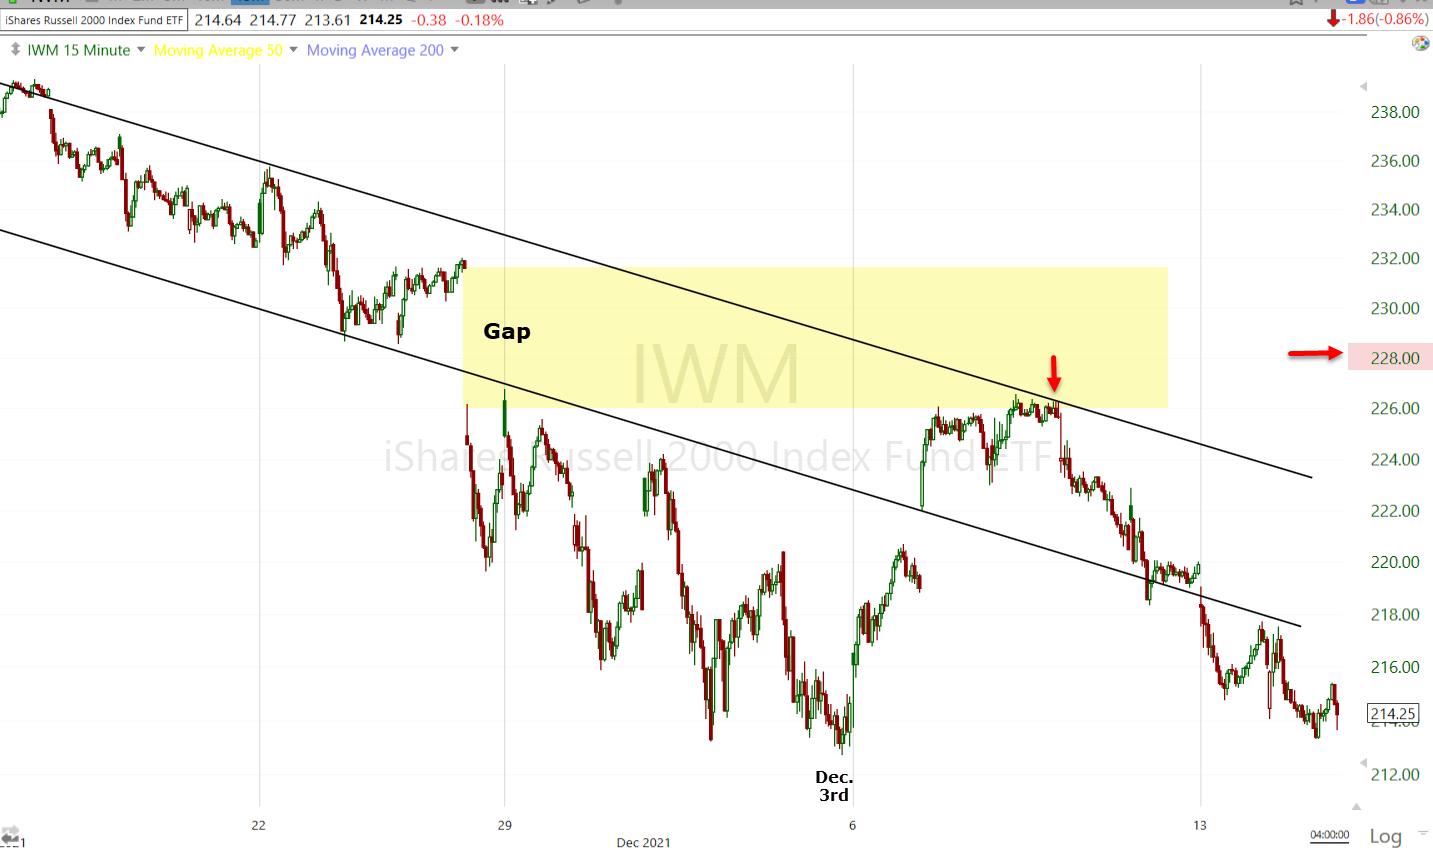
Small Cap IWM (5m) faced channel resistance before filling the gap, where prices ultimately stalled and fell as the initial short-covering rally subsided, and just above the IWM $228 zone which has been a clear area of sticky resistance.
Other than the fact that those same breadth oscillators are a bit on the oversold side after the last few days as fewer and fewer stocks participate, I see the market as a fairly clean slate going into the FOMC having filled the overhead gaps (which was a historical probability) , with the exception that mass psychology is still on the fearful side as represented by the Fear and Greed index.
Sector performance today illustrates two contrasting concerns, one being economic growth concerns due to the Omicron COVID variant as more restrictive actions are being taken by countries, as well as supply chain concerns. On the supply chain front reports today indicated that companies in a manufacturing hub in China suspended operations because of an outbreak in cases. It’s no secret that supply chain disruptions have greatly contributed to inflationary pressures. The second major concern is inflation, not to mention exacerbated growth concerns as a result of likely actions the Fed may take to try to tame inflation. Or said another way, stagflationary concerns (slowing growth in an inflationary environment). This morning’s hot inflation report with U.S. producer-price inflation hitting a record of almost 10% puts additional pressure on the Fed to announce a faster tapering plan and signal a more hawkish rate path tomorrow.
The Fed is widely expected on Wednesday to unveil a quicker tapering of bond purchases, paving the way for interest-rate hikes next year. The wildcard will be how much faster, and what the interest rate hike timing and trajectory looks like represented by the dot-plot which only comes out 4 times a year. In meetings that there is no dot-plot, Powell sets the (dovish) tone through his press conferences, but when the Dot-plot is included, we get a view of the thinking of other FOMC policy voting members that makes it hard for Powell to spin his typical dovish narrative which he recently started to capitulate due to hard data, which sets up tomorrow as a potentially very volatile, market moving meeting. It’s not coincidence that each of the last two meeting that included the dot-plot, the yield curve has virtually crashed.
There are numerous market-based indications that the Fed is actually well behind the curve.
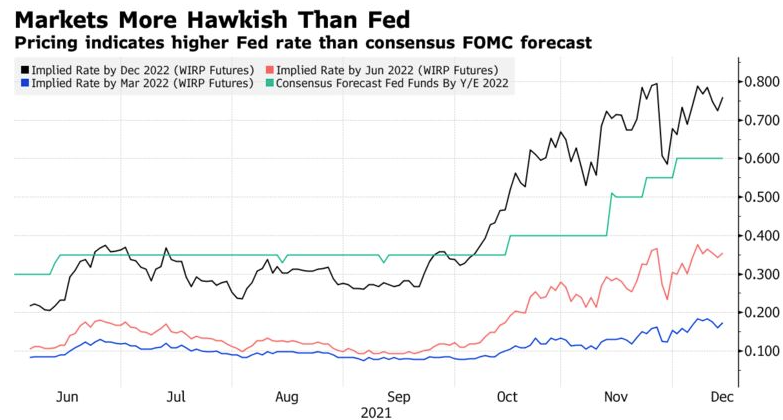 Source: Bloomberg
For a decade or more I’ve warned before every FOMC meeting to beware of knee jerk reactions in stocks They are common and more often than not, they are wrong. Watch the US. Dollar’s reaction (a stronger dollar represents a hawkish take, a weaker dollar represents a dovish take relative to expectations). See the Dollar’s daily chart above, it has been consolidating bullishly right into tomorrow’s meeting. Watch yields, especially the Fed sensitive 2-year yield, and the yield curve (flattening represents the bond market saying that the Fed is likely to make a policy error). We’re in a completely different environment (inflationary or potentially stagflationary) than most investors have seen unless they were around in the late 1970’s and early 1980’s, so there are few investors that have experienced and navigated this kind of environment. The currency and bond markets are much better informed than equities, which are almost always the last to get the message. While rate hikes aren’t likely until the end of the asset purchase taper sometime around the middle of next year (depending on whether and how much the Fed adjusts the rate of taper), I can’t recall a Fed rate hike cycle that didn’t lead to a recession. Of course this is a little different in the context of inflationary pressures that haven’t been seen in about 4 decades. What ultimately makes this market more dangerous is the extreme Fed easing since COVID as well as Federal government stimulus that’s stoked inflation and extremely rich valuations historically speaking. Many of us who watch the markets and the Fed’s increasingly extreme monetary easing over the years have wondered when the repercussions would come home to roost. Common sense would say that you can’t manipulate the markets with extreme easing forever with no adverse consequences. After more than a decade of increasingly extreme Fed intervention and no adverse inflationary consequences, I think we’re on the verge of seeing the consequences of artificially propped up markets with printing money out of thin air, money that ultimately goes straight into asset prices as “There is no alternative” due to Fed policy. The question is, do equity markets (the least sophisticated asset markets) realize this in a timely manner and start discounting to avoid severe consequences all at once, or do they ignore it until the bitter end, leading to a tipping point that leads to a severe reaction? My guess, based on more than 2 decades of experience is that equities ignore it until the bitter end and are punished severely.
If you’ve been with me for a couple years, then you know there were screaming signals 5 to 6 weeks before the 30-plus percent COVID market crash. Commodities, currencies and rates were all screaming major trouble ahead while stocks blissfully went on to make new record highs just days before the crash. Only some well-informed insiders (including several in Congress who received confidential briefings and traded what was in effect inside information) toward the end of January 2020 managed to avoid the crash. A similar situation occurred in 2018 in which bond, currency and commodity markets signaled major trouble ahead that led to a 20% crash in the S&P (which typically means the average stock lost twice that), and there were clear signs before the early 2018 market crash and 400+% explosion in volatility.
I’ve extensively studied markets going back to the early 20th century and have never seen anything like equity markets over the last 20+ years. What became clear after the Financial Crisis was equity markets and their valuations became more and more disconnected from reality and the reason was unmistakable… Fed liquidity. Some of you you may recall the day in August that the S&P doubled from the COVID crash lows, I pointed out that the very same week the Fed’s balance sheet expanded from $4.1 trillion to $8.2 trillion, the exact same percentage that the S&P doubled over the exact same period. For the first time in decades, the Fed’s easy money policy is being constrained by rising and broadening inflation. Equity investors who have known nothing else than a Fed willing to do whatever it takes to levitate markets through increasingly more extreme easing at the first sign of trouble, are about to be in for a rude awakening.
Overnight
S&P futures are unchanged tonight, coming off cash session lows as volatility came under pressure. Like the cash charts (i.e.- SPY), S&P futures’ 3C chart shows no confirmation of the gap fill rally.
 ES (1m 3C trend)
Conversely, here’s the trend of 3C for VIX futures that I’ve been commenting on each day, especially since the Dow first filed the Thanksgiving gap.
 VIX futures (1m) – I find that contrasting/confirming signals between S&P and VIX are some of the strongest signals revealing what’s taking place beneath the surface of price action.
Bitcoin futures are bouncing off the 200-day.
Looking ahead to Wednesday, investors can expect the FOMC Rate Decision, Retail Sales for November, the NAHB Housing Market Index for December, Import and Export Prices for November, the Empire State Manufacturing Index for December, Business Inventories for October, and Net Long-Term TIC Flows for October.
Other key events this week include:
- China releases November industrial output, retail sales data, Wednesday.
- BOE rate decision, Thursday.
- ECB rate decision, Thursday.
- U.S. housing starts, initial jobless claims, industrial production, Thursday.
- BOJ monetary policy decision, Friday.
- S&P Dow Jones Indices quarterly rebalance effective after markets close, Friday.
- “Quadruple witching” day in the U.S. market, when options and futures on indexes and equities expire, Friday.