Stock Market Daily Wrap
Yesterday’s market bounce was not that impressive, but it wasn’t expected to be. It was potentially the start of the whimper rally, the last phase of the short set-up seen developing last Thursday and Friday. Still, I’m almost surprised how weak the market is and was today. The S&P is down 5 of the last 6 days. In most cases it’s so weak it can’t even pull off the whimper rally short set-up which is characterized by weakness.
The day did not start that way though. The day had begun on a high note with S&P futures up +0.5% in pre-market. The positive early market reaction was due to Johnson & Johnson (JNJ +0.2%) advancing its COVID-19 vaccine candidate to Phase 3 trials and Nike (NKE +8.8%) blowing past quarterly results and raising its FY21 revenue guidance.
I say, “I’m almost surprised how weak the market is” because the reason for the weakness is something on my radar since at least August, something I have brought up every week since seeing the potential – the U.S. Dollar.
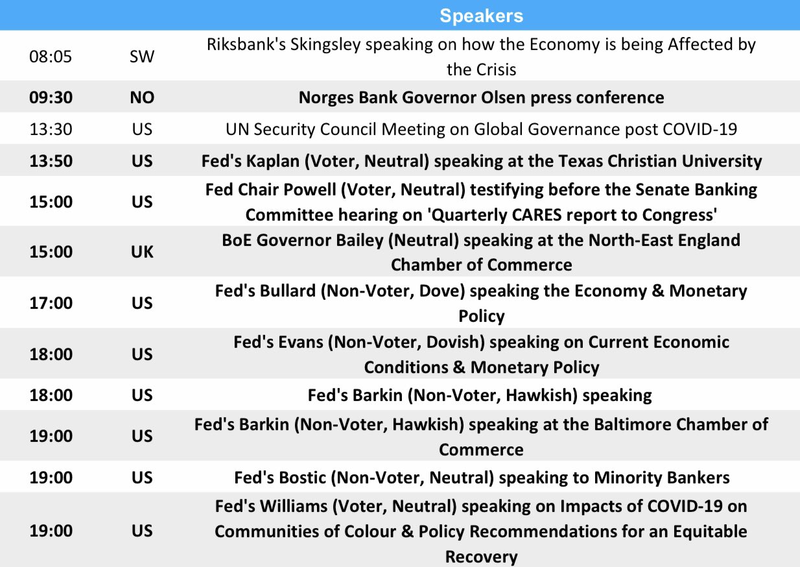
It wasn’t just stocks on sale today, also commodities, precious metals, even Bitcoin were all down on Dollar strength. “Sell everything, buy the Dollar”. Since the end of March, the U.S. Dollar and the stock market have had a strong inverse correlation that has done nothing but get stronger. The 90-day (inverse) correlation between the S&P and Dollar Index recently reached an incredible 95%, higher than even dollar-denominated commodities.
 SP-500 (daily) with UUP/Dollar (white) and the 90-day correlation below. Keep in mind that the Dollar’s relationship to stocks changes constantly depending on a number of macroeconomic and even safe-haven factors. To the far left there’s a dwindling positive correlation. Since the market crash the negative or inverse correlation has been increasing. That has been very helpful for stocks while the Dollar did nothing but fall from March highs, but it cuts both ways.
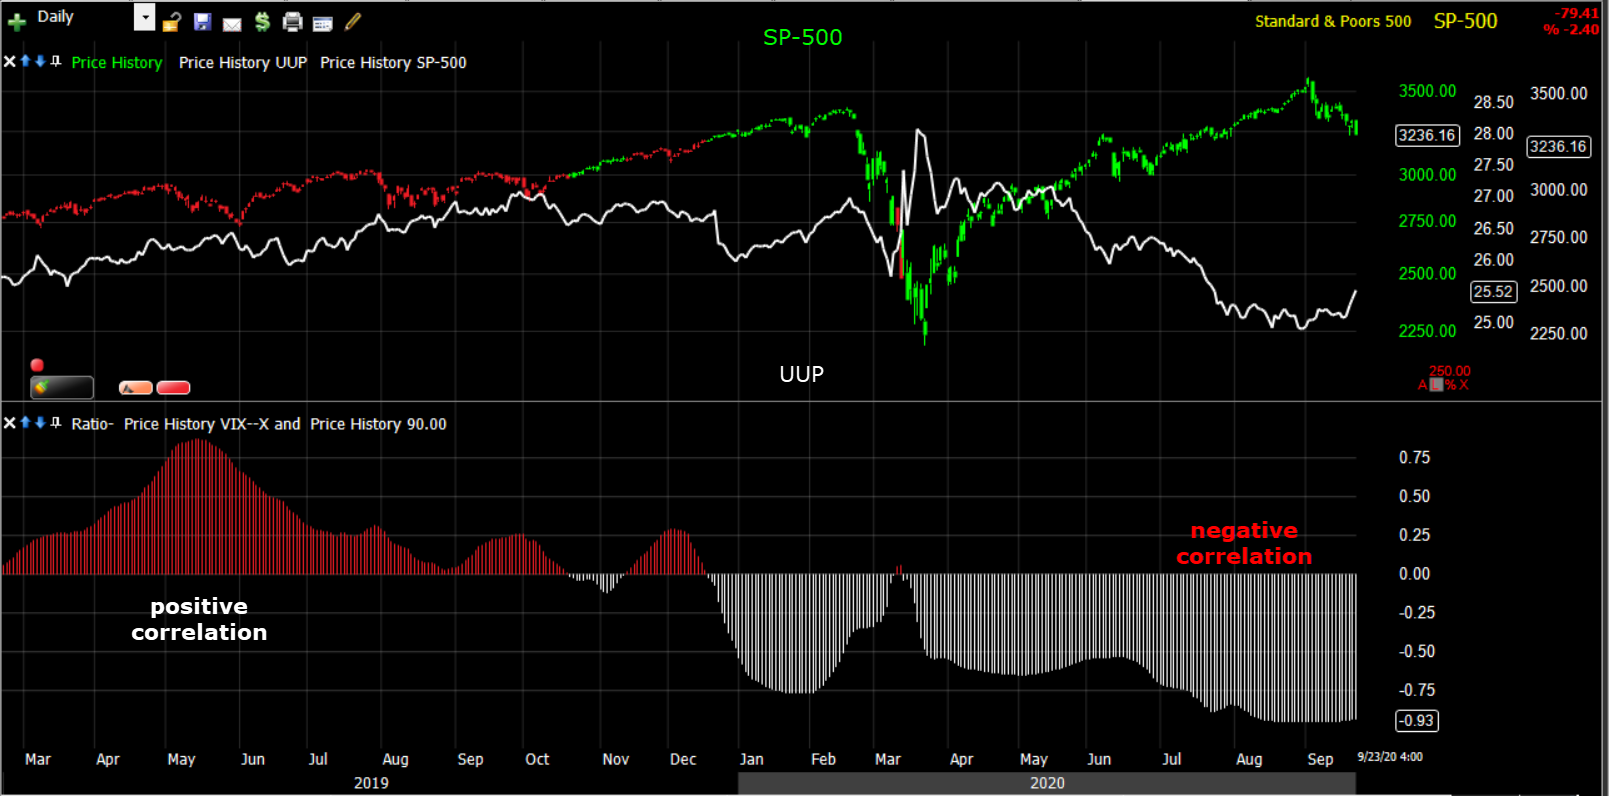
Here’s another way to view the dynamic…
 SP-500 (60m) and UUP (inverted in white) After the crash there’s a very strong inverse correlation – Dollar down, stocks up.
I’ve been warning since August that there’s a rising probability the Dollar turns and ends up squeezing dollar shorts, and that it could be a big problem for equity investors/traders caught by surprise.
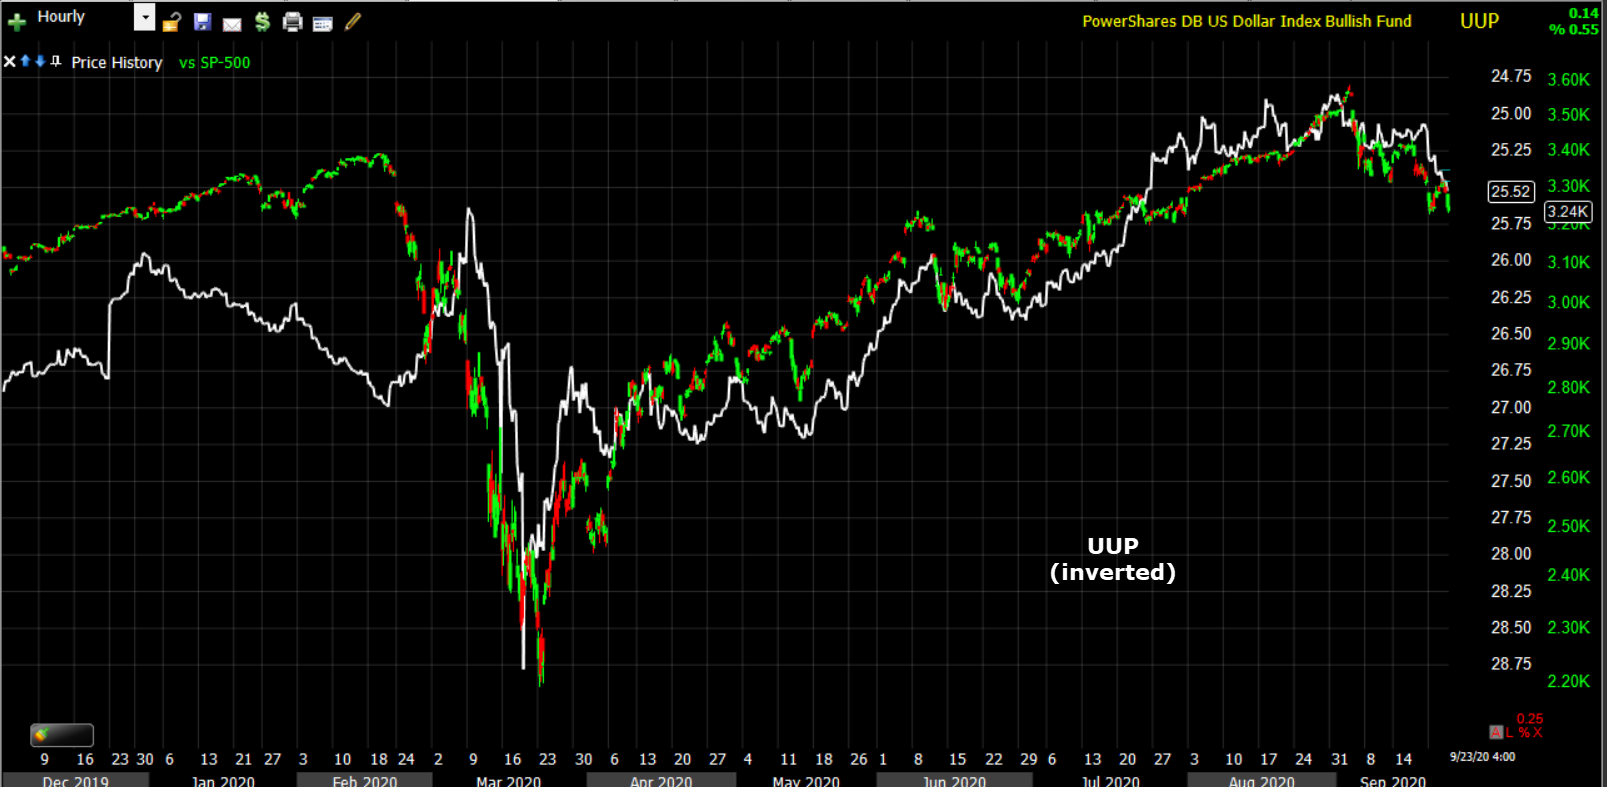
What changed for the Dollar? You may recall the FOMC last Wednesday and the Dollar’s initial reaction. From last Wednesday’s Daily Wrap,
“…the (Dollar) advance into the close to session highs suggests the market’s take on the FOMC was “Not dovish enough”.
U.S. Dollar Index (15m) since the FOMC (Wednesday) the Dollar index broke out of its September consolidation, and above the resistance trend from August. The S&P has been down 4 of the last 5 days since the FOMC meeting, that’s not coincidence.
Earlier today I thought, “I should have sold my UPRO calls yesterday for an 80% gain”, but the truth is, despite yesterday being a weak bounce as expected, price action suggested more upside was probable; there was nothing wrong with 3C charts (they weren’t screaming either way); USD/JPY was still supportive of risk sentiment; credit had weakened a bit Monday, but was still at a higher low; as were yields. The troubling area that I remarked on last night was, “the intraday price action is bullish for the Dollar.”
S&P futures started the morning up +0.5% on track to add to the bounce. The chart below makes clear what happened, although I bet you can guess.
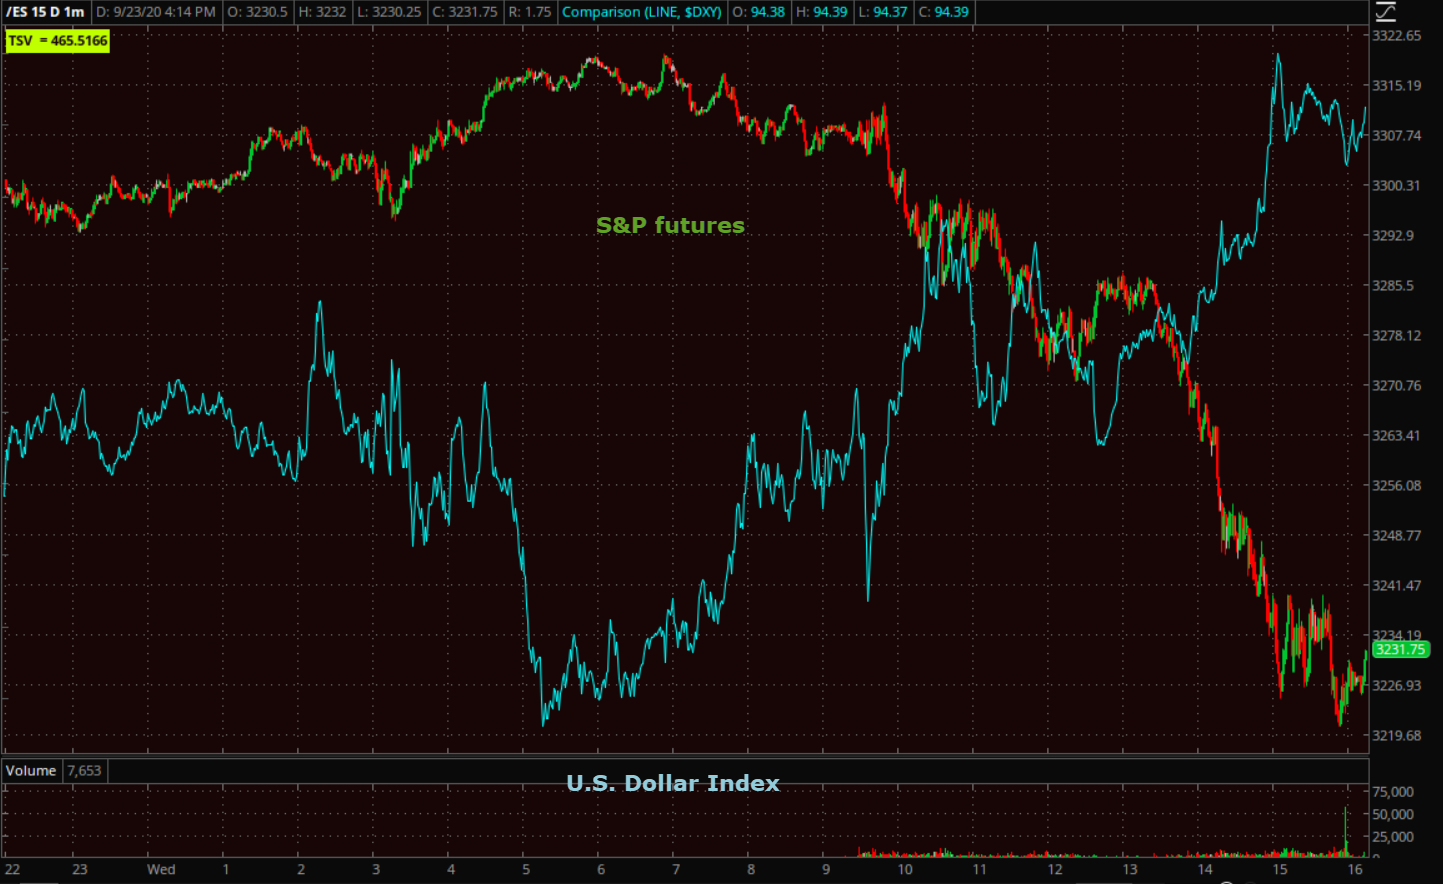
S&P futures (1m) and U.S. Dollar Index (blue).
Index futures hit overnight highs as the Dollar pulled back to overnight lows. As the Dollar came off the lows in pre-market, S&P futures started giving up overnight gains (the strong inverse correlation). The Dollar gained more after the U.S. PMI report this morning because U.S. Composite PMI is still higher than Euro-area PMI, and the euro accounts for some 60% of the Dollar index, far more than any other currency. That sent the Dollar even higher in the early cash market.
Elsewhere, the mega-caps started the session weak after leading yesterday’s bounce. Mixed S&P sectors with no leadership were apparent by the Early Update . The rotation to value/cyclicals that market pundits and managers have been longing for is not happening, even though ealy news/conditions were favorable for them. As the afternoon went on, losses were spread across all 11 S&P sectors and even style factors – “Sell everything”. Every time I’ve talked about the Dollar since early August I said that a dollar rally had huge potential to disrupt numerous asset classes, and it was something few would see coming.
Interestingly, traditional safe-haven assets didn’t see safe-haven flows today – Gold for the same reason that stocks were down, but Treasuries surprised me, as did the lack of a safe-haven bid in the Japanese Yen. As mentioned in today’s updates, volatility didn’t look too concerned either, except before the cash open as VIX futures put in a positive 3C divgernece (at the same time the Dollar was rising off session lows), but during most of the cash session VIX futures didn’t see much underlying accumulation.
Averages
The fact that NASDAQ-100 and Small Caps were the worst performing illustrates there was no rotation, there was no leadership. The Dow was down the least, in large part because Nike (NKE +8.75%) added +60 points to the Dow, although compare to the Dow falling -800 points from session highs.
The S&P fell back to Monday’s low, or back to -10% correction territory.
S&P 500 ⇩ -2.36%
NASDAQ ⇩ -3.16 %
DOW JONES ⇩ -1.92 %
RUSSELL 2000 ⇩ -3.04 %
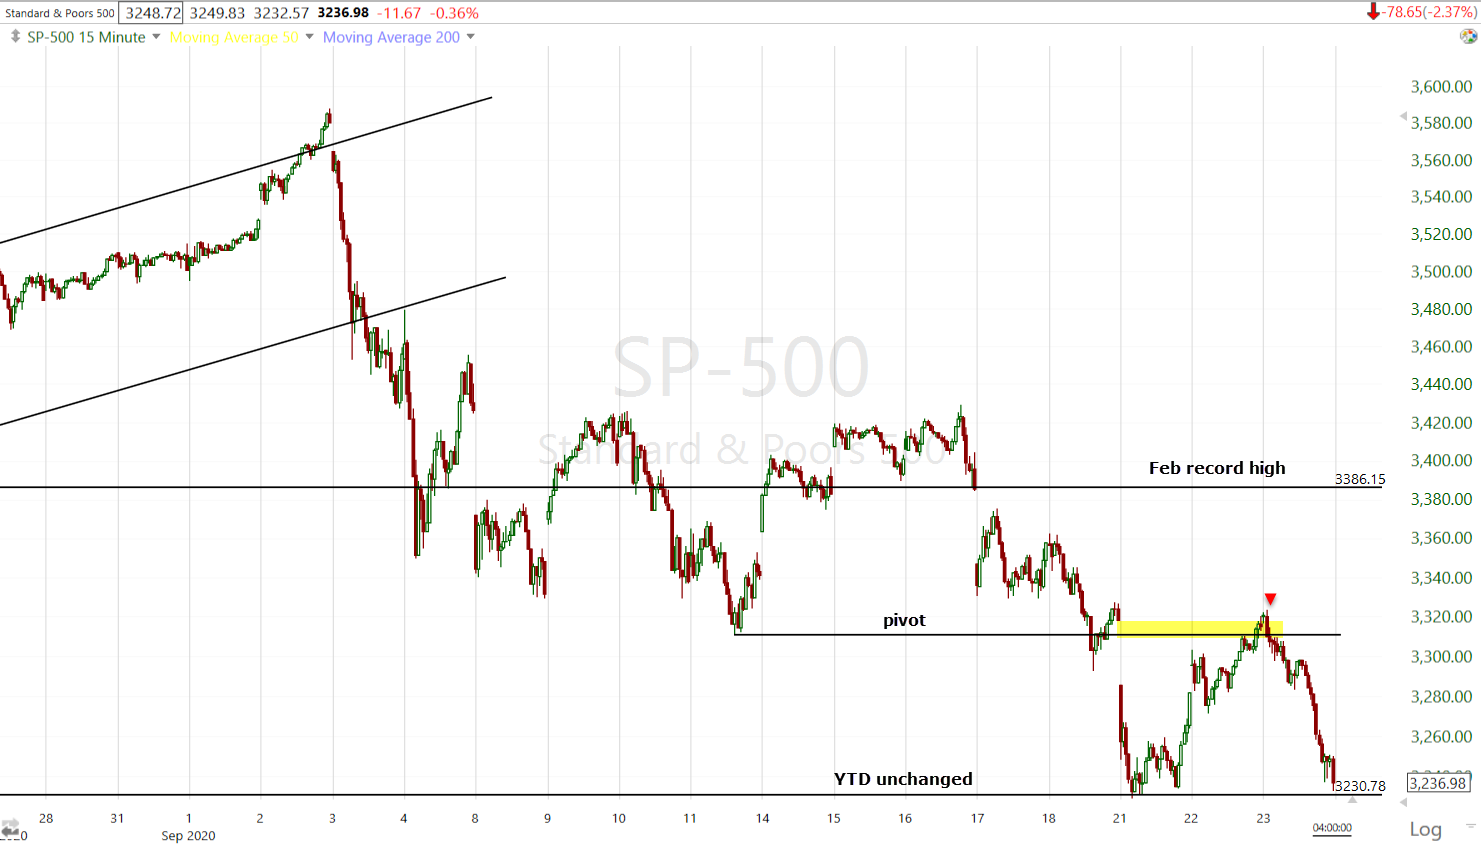 SP-500 (15m) met resistance early today at Monday’s gap (red arrow), which is also the pivot that prices would have to bounce above to set the whimper rally, but so far the market is too weak to even do that. The decline picked up this afternoon and price fell back to Monday’s low.
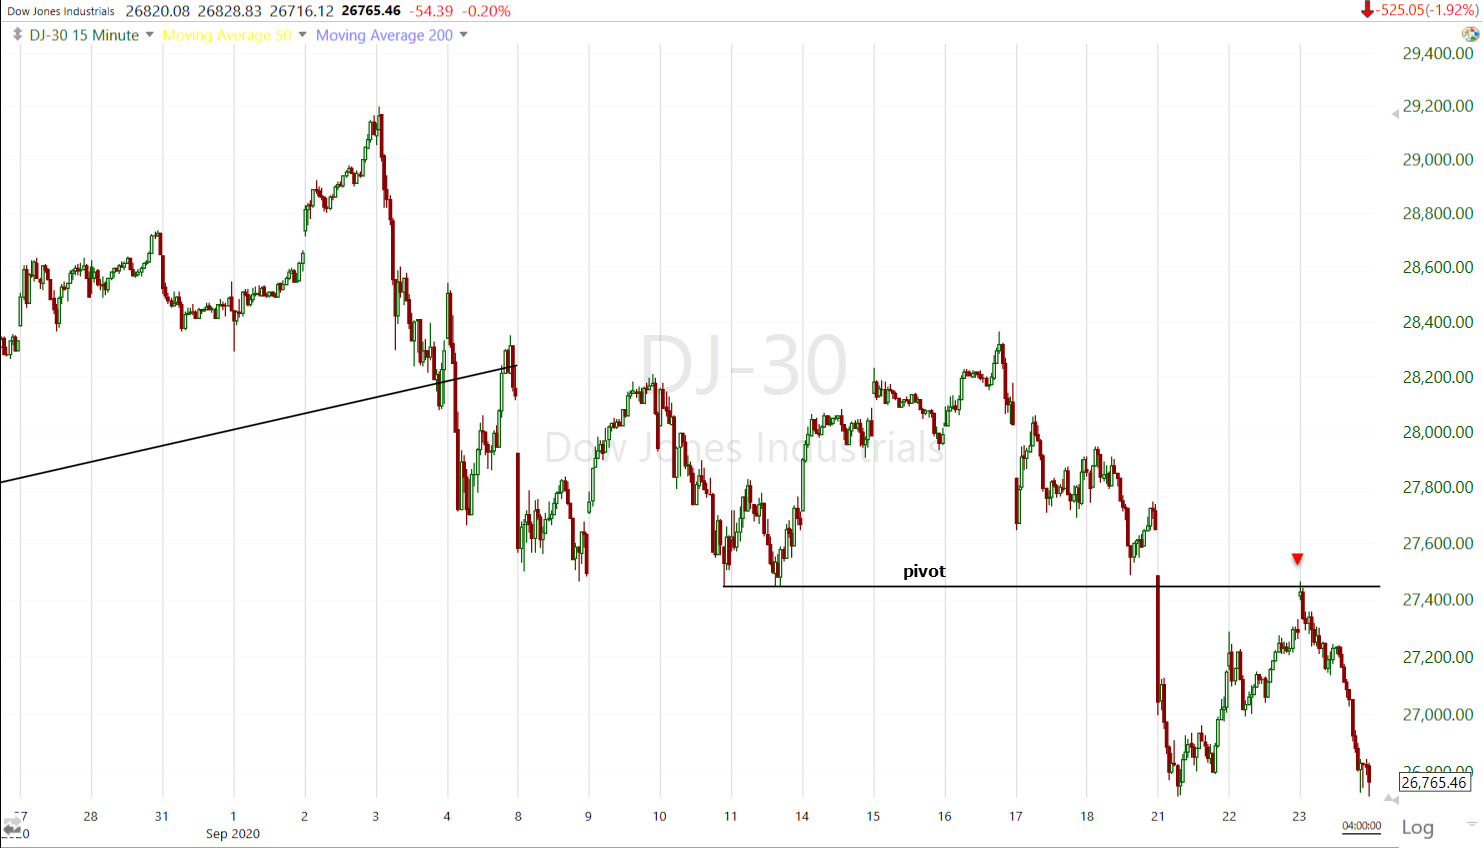 Dow (15m) met resistance at the pivot of the short set-up developing at the end of last week. Like the S&P, the Dow came down to Monday’s low.
It should be noted that S&P and Dow did hold at Monday’s low. That said, the averages closed at or near session lows which is always bearish in my book.
NASDAQ-100 is a bit different and may be considered to have put in the short set-up with a whimper rally. Recall that the NASDAQ was the first major average to display the sequence of the historic short set-up last Thursday. S&P joined on Friday, and Dow/Small Caps as well as all S&P sectors joined Monday.
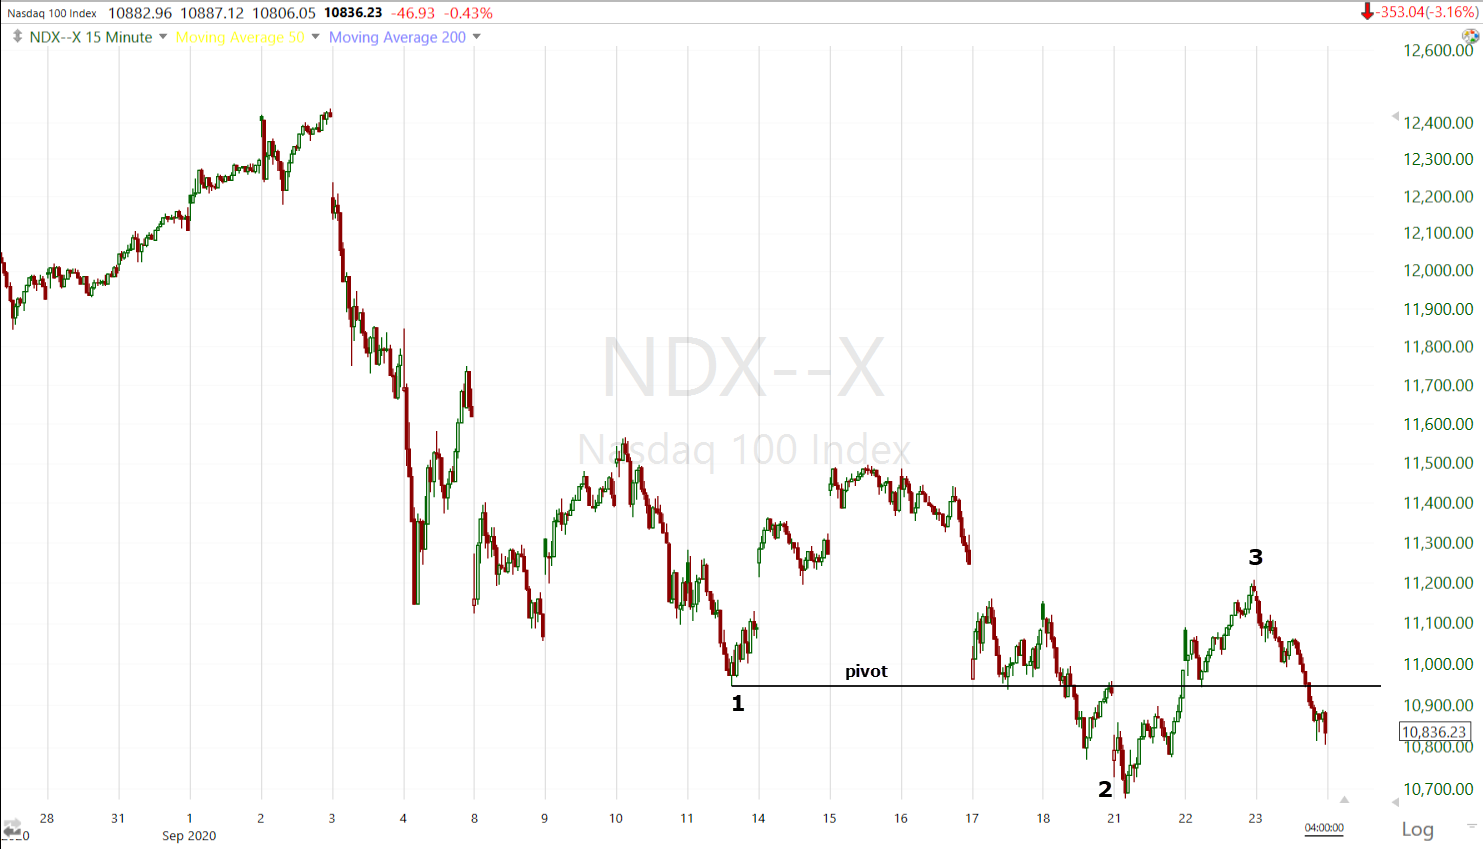 NASDAQ-100 (15m) traded below the Sept. 11th low, then bounced above (potentially the whimper rally at #3). Although it was the worst performing today, it did not retrace down to Monday’s low.
Small Caps are completely different and reflect the weaker price action of some of the cyclical sectors.
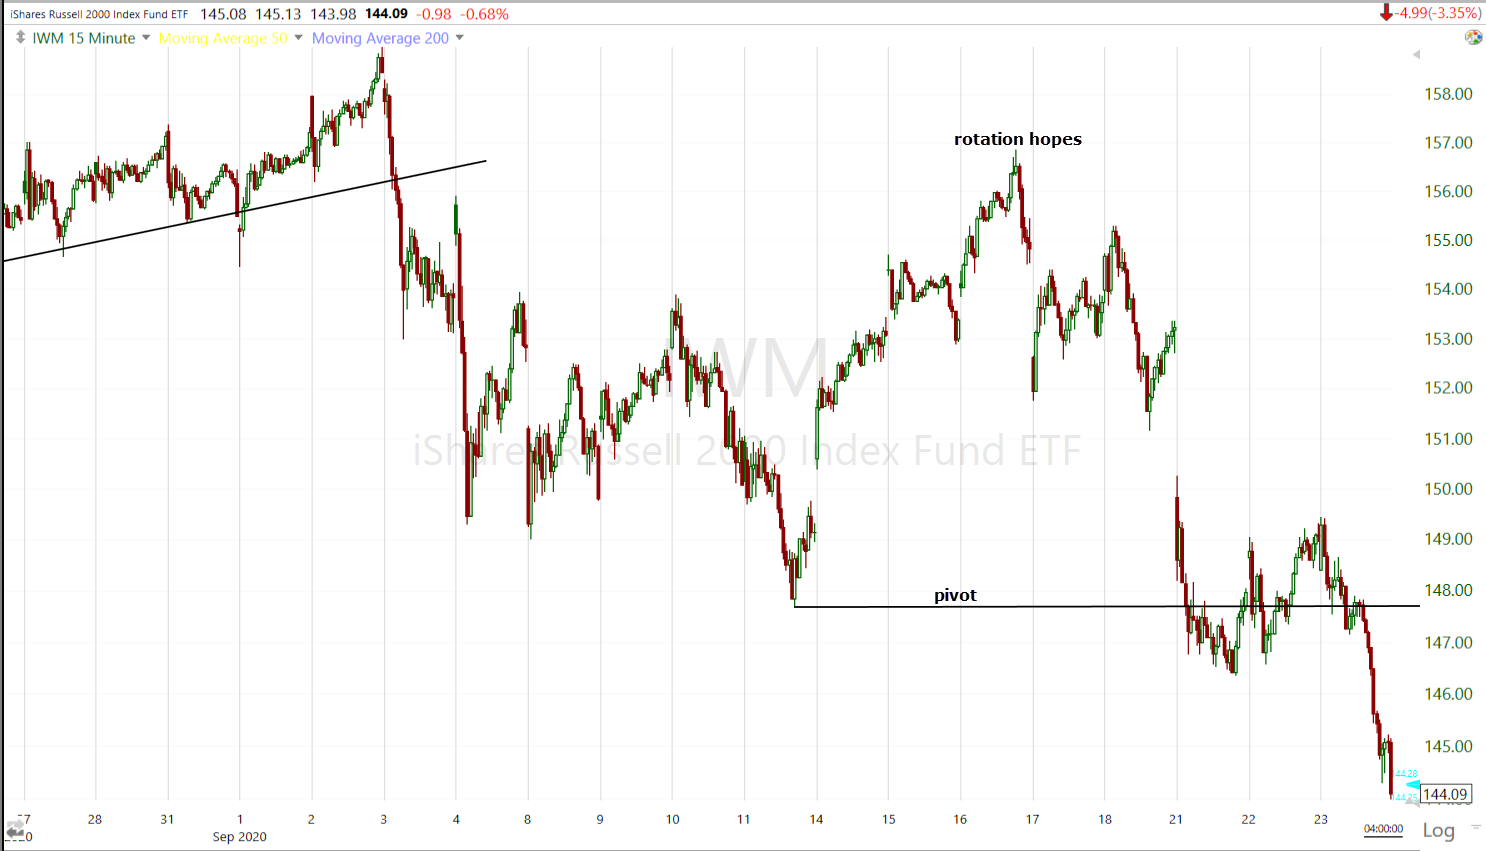
IWM (15m) recall that last week it was the mega-caps, Technology and NASDAQ that were the worst performing, while growth sensitive cyclicals outperformed. IWM even closed up +2.8% last week, sparking enthusiasm that rotation from Tech to cyclicals was underway, but as we saw last week, it was weak at best. IWM made the lower low (below the pivot) needed for the short set-up on Monday, but got nowhere near Monday’s gap yesterday and blasted below the week’s low and below its 200-day today.
Volatility was not very responsive most of the day, that is until the NASDAQ crossed below the pivot (September 11th low).
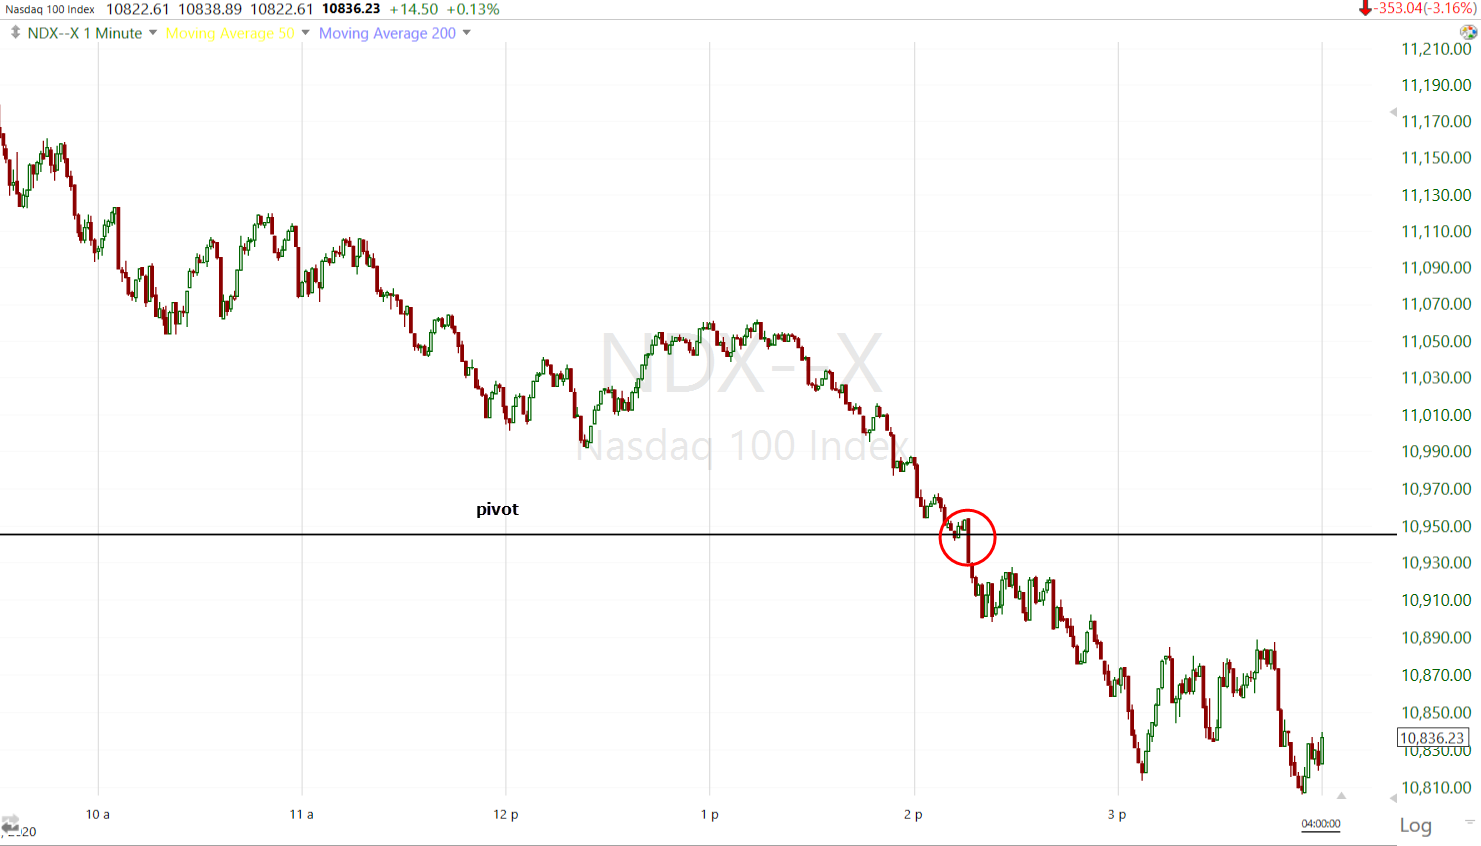 NASDAQ-100 (1m today) – there may be some margin call selling dynamic considering when selling picked up and NASDAQ broke this key pivot (margin calls 2:30 p.m. ET).
At that point, volatility exploded across the board.
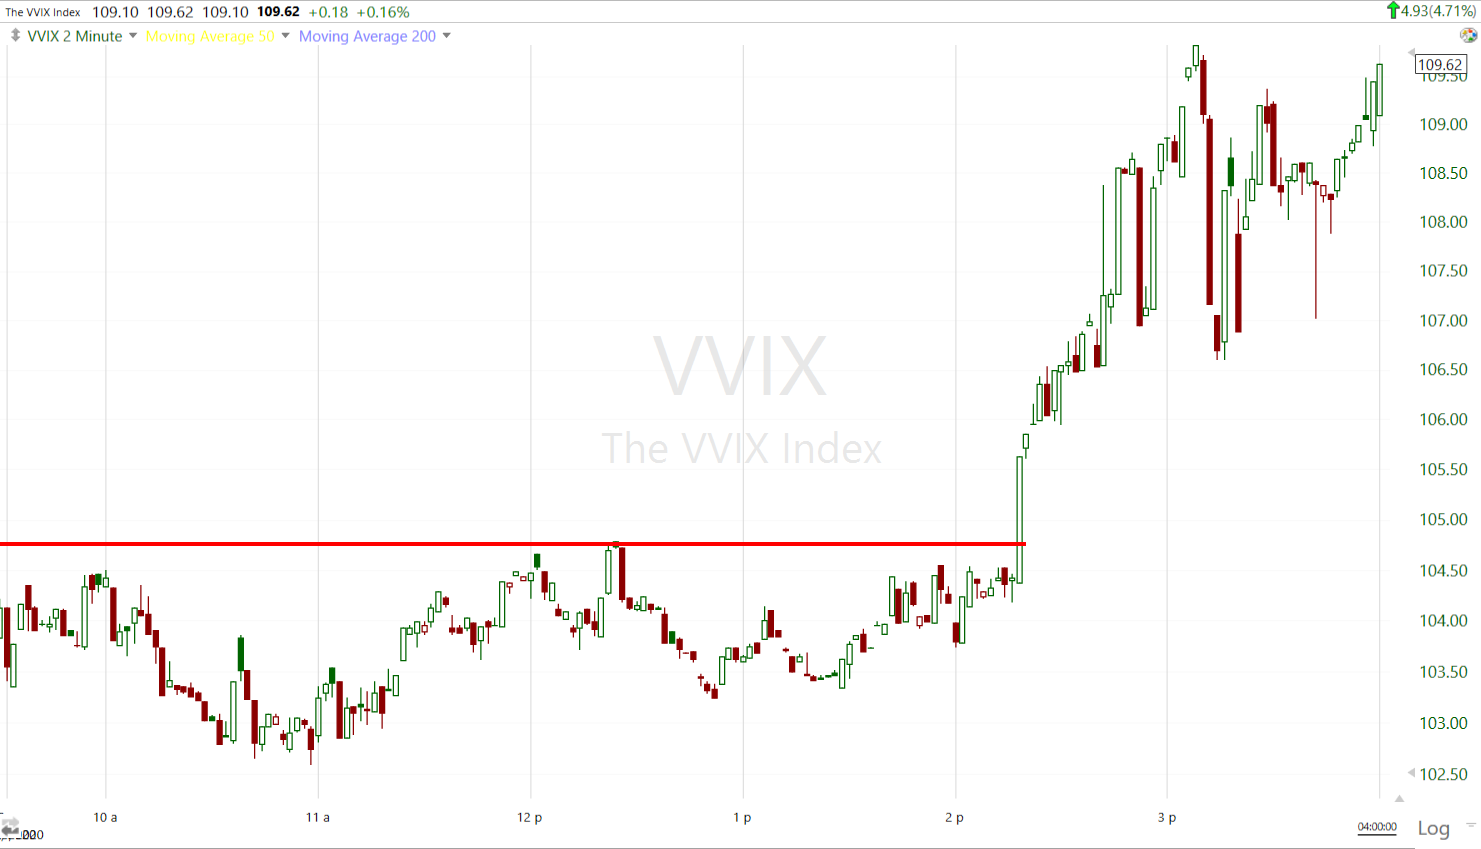
VVIX (1m today) very subdued despite the averages falling, until NASDAQ broke under its pivot, volatility exploded higher at the same time.
From a wider perspective…
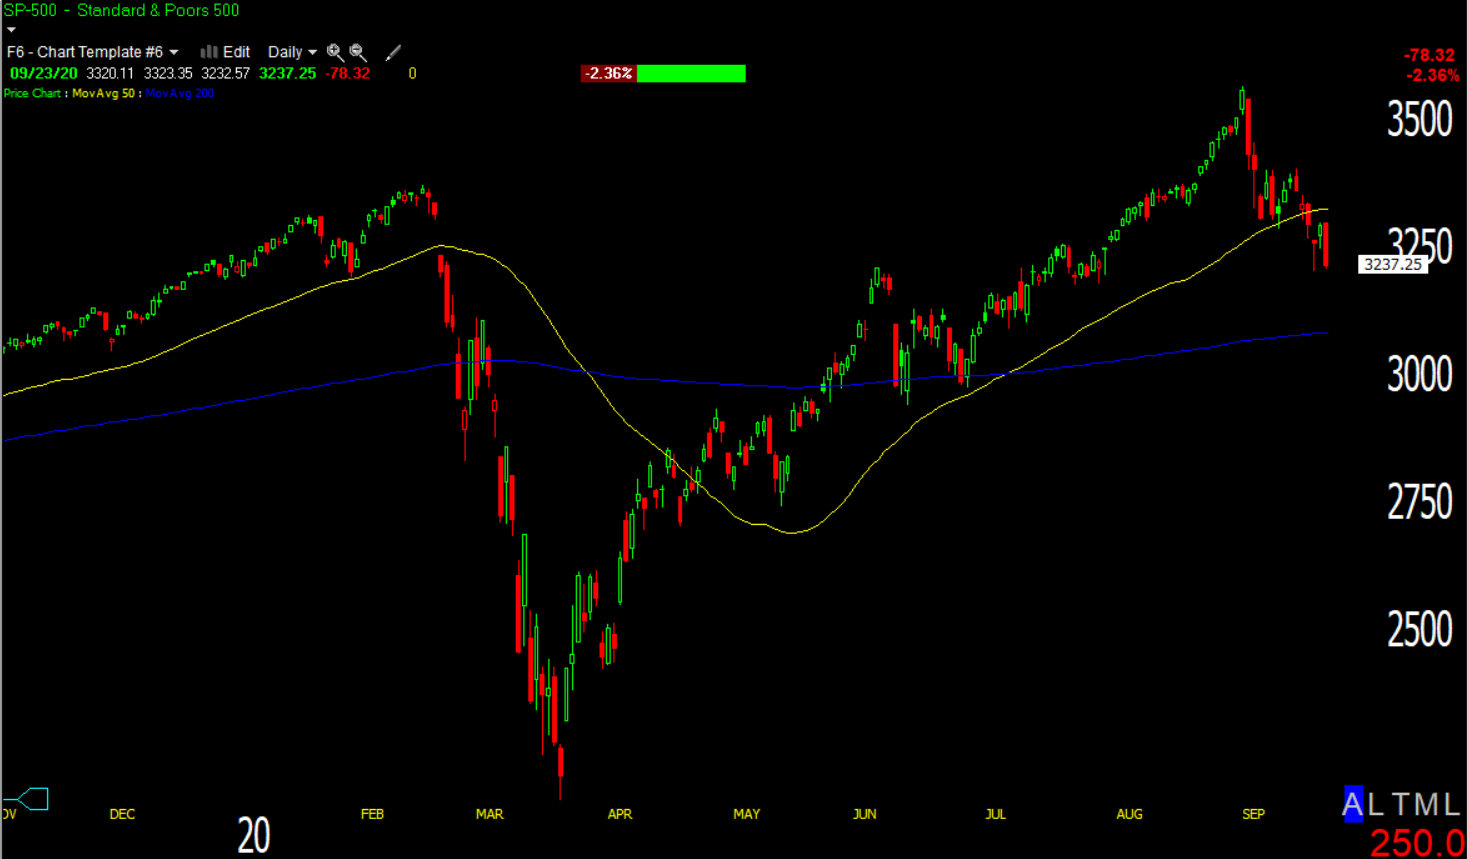 SP-500 (daily) w/ 50-day sma (yellow) and 200-day sma (blue). This is a bearish engulfing candle and a close near session low, although it held the week’s low.
As a reminder the recent market decline started one day after the S&P reached the Broadening Top’s upper trend line.
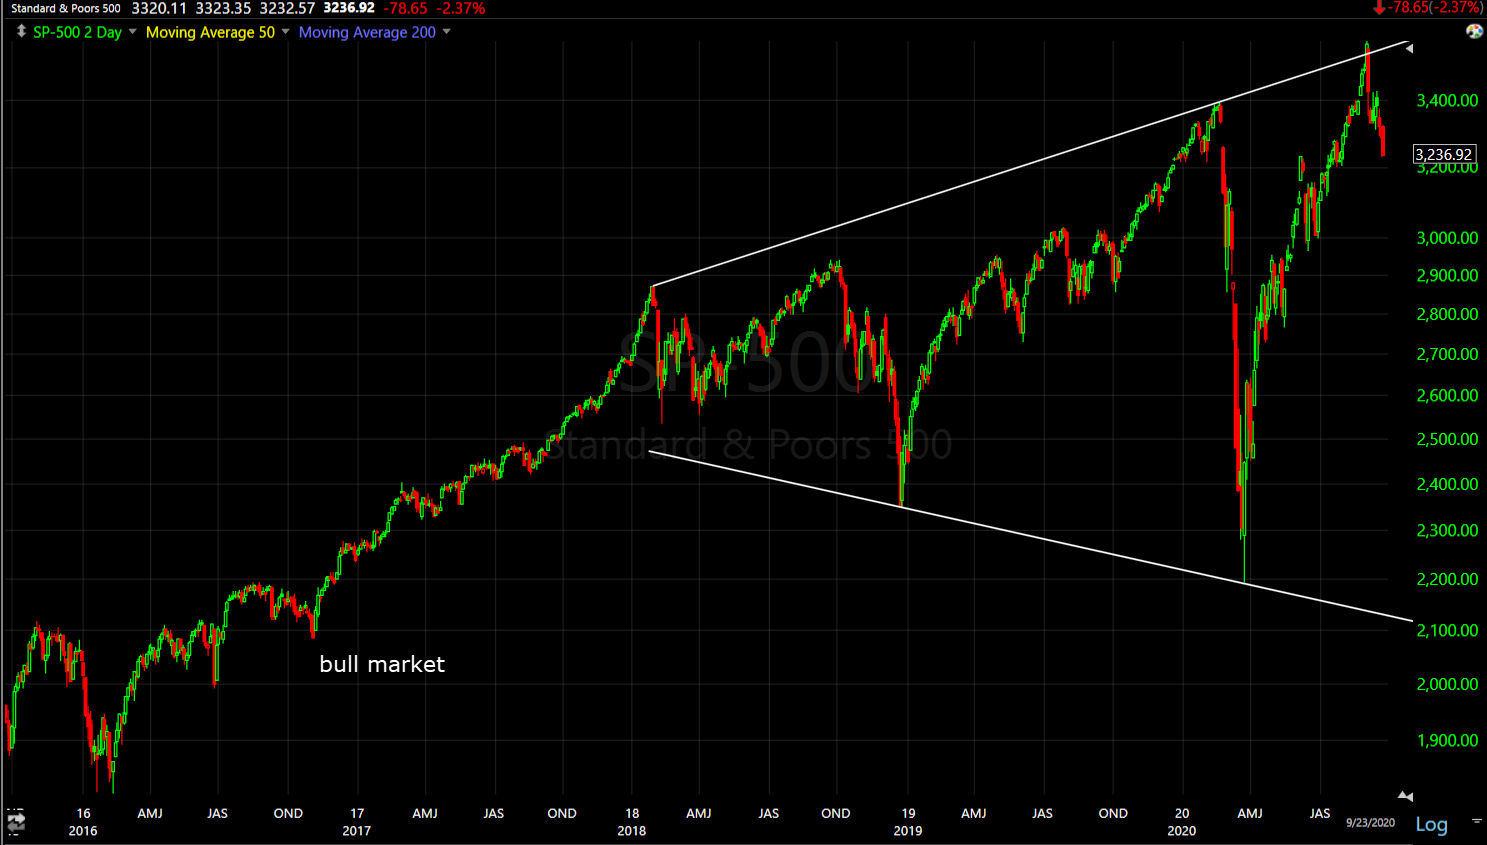 SP-500 (2 day). The price trend of 2017 is what a bull market looks like, not this huge, chaotic broadening formation.
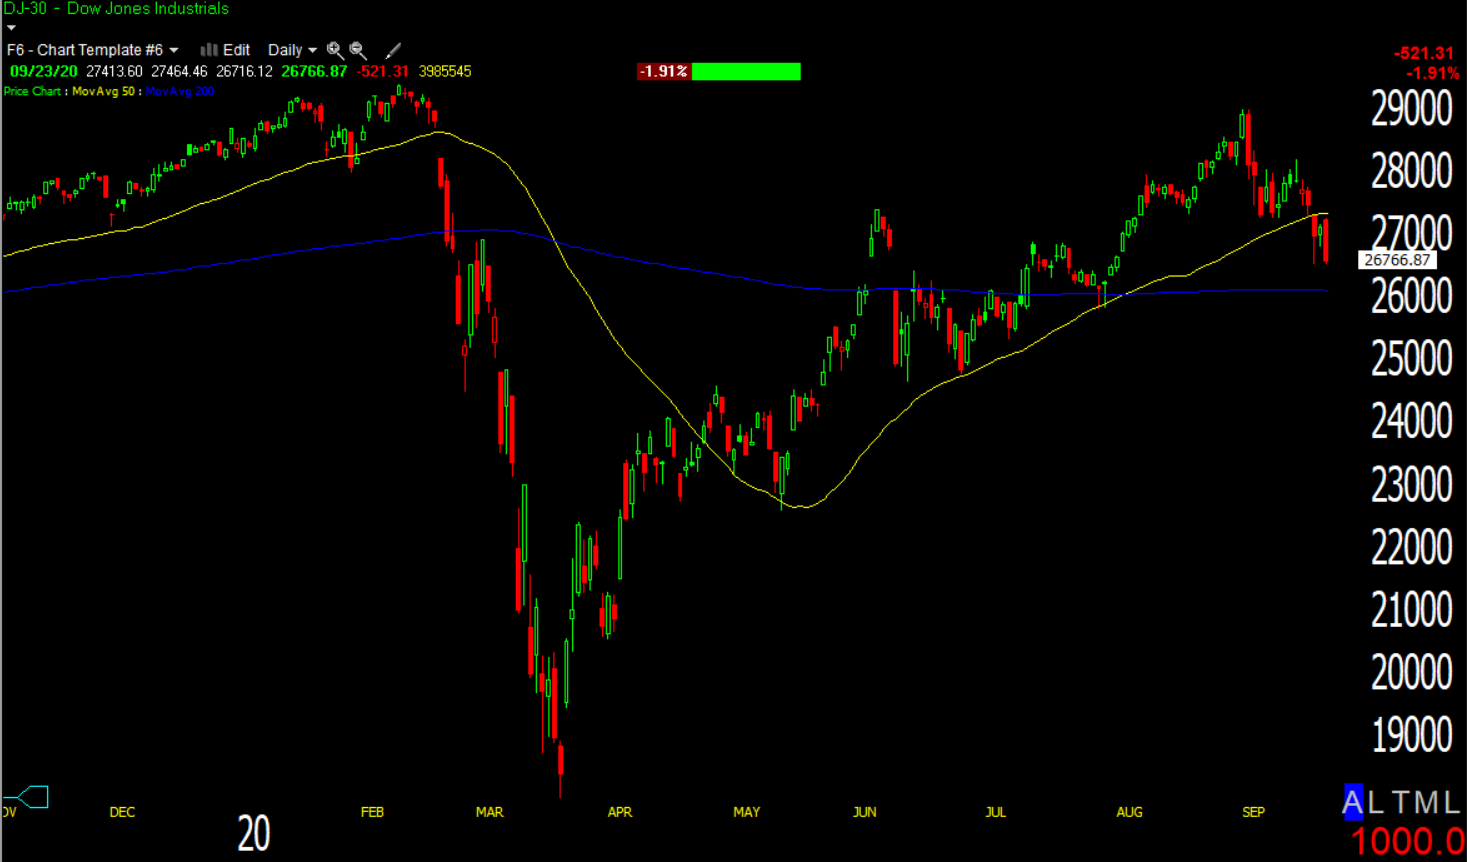 Dow (daily) another bearish engulfing candle closing near the low with the 50-day acting as resistance, but Dow did hold the week’s low too.
I’ve never seen a broadening top as big as the S&P and Dow’s in any asset, much less a major market average. The Dow’s Broadening Top (below) is a fairly typical in that the last rally often falls short of the upper trend line and rolls over.
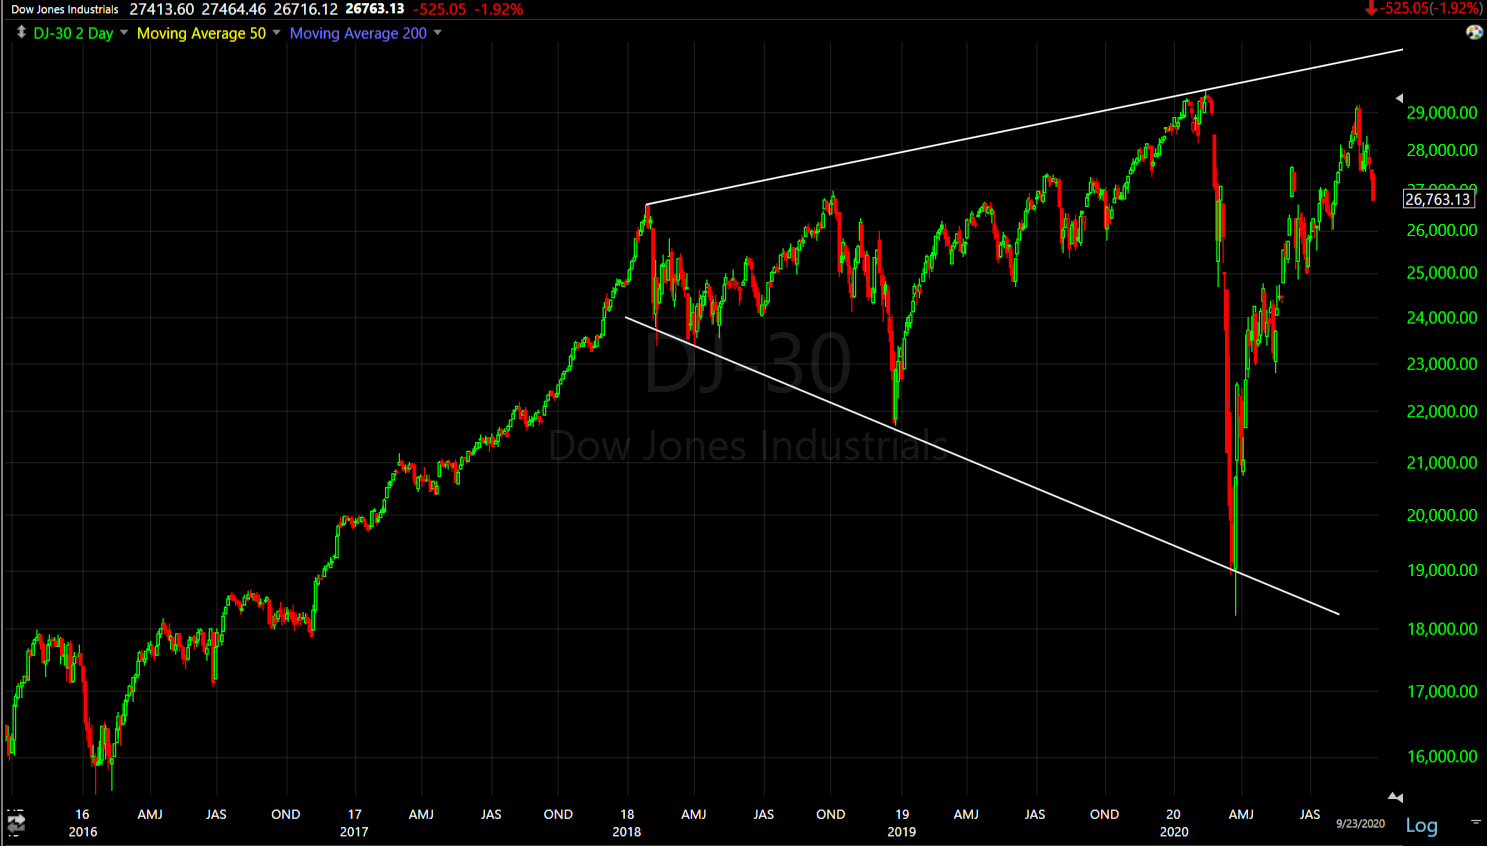 Dow (2 day)
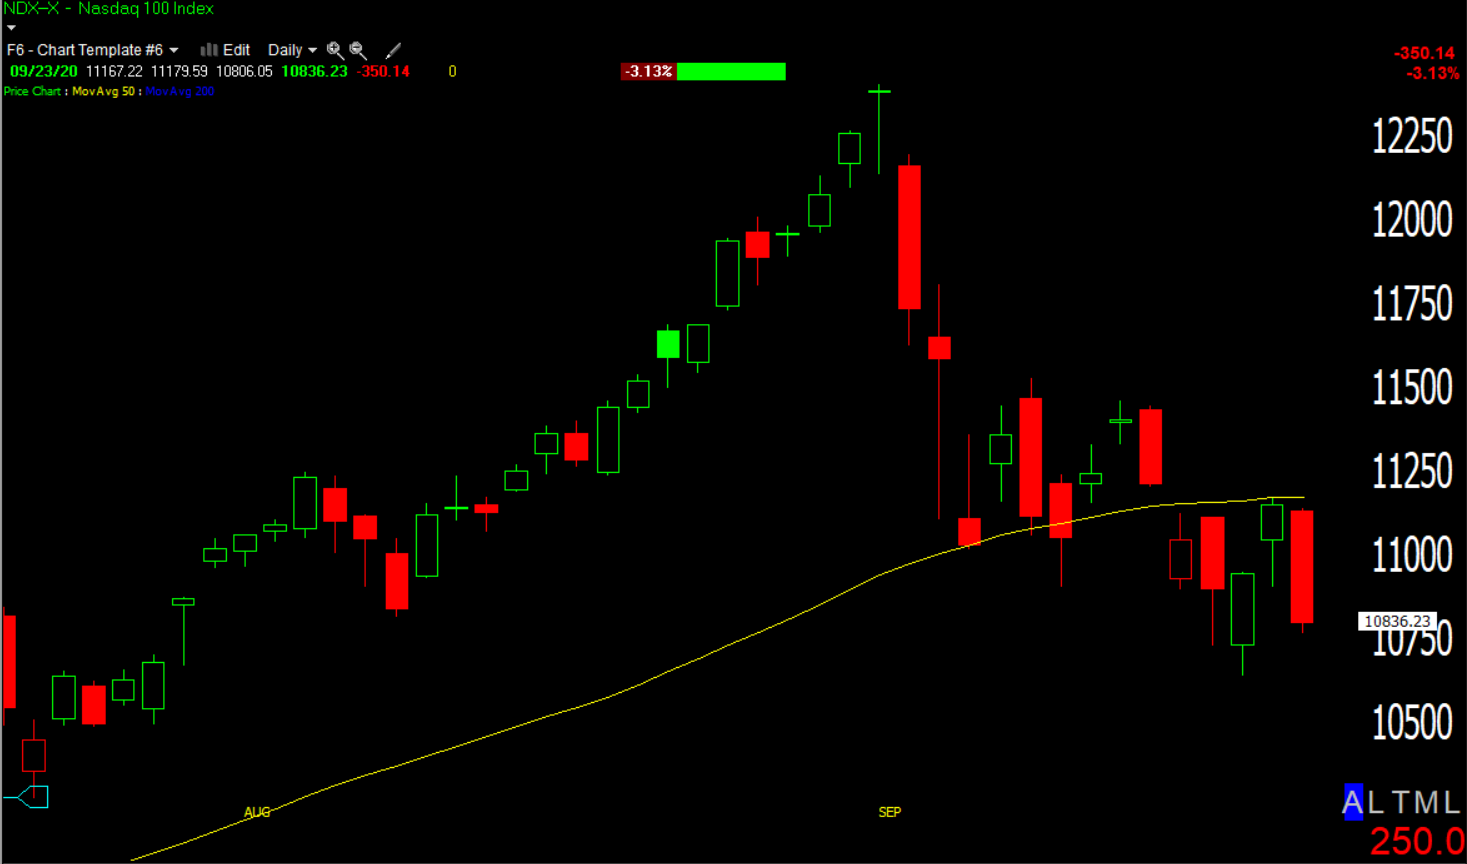 NASDAQ-100 (daily) started the day below yesterday’s close so this is not a true bearish engulfing candle. The 50-day sma is clearly acting as resistance, as was the 20-day ema before. And another close near session lows, but above the week’s low.
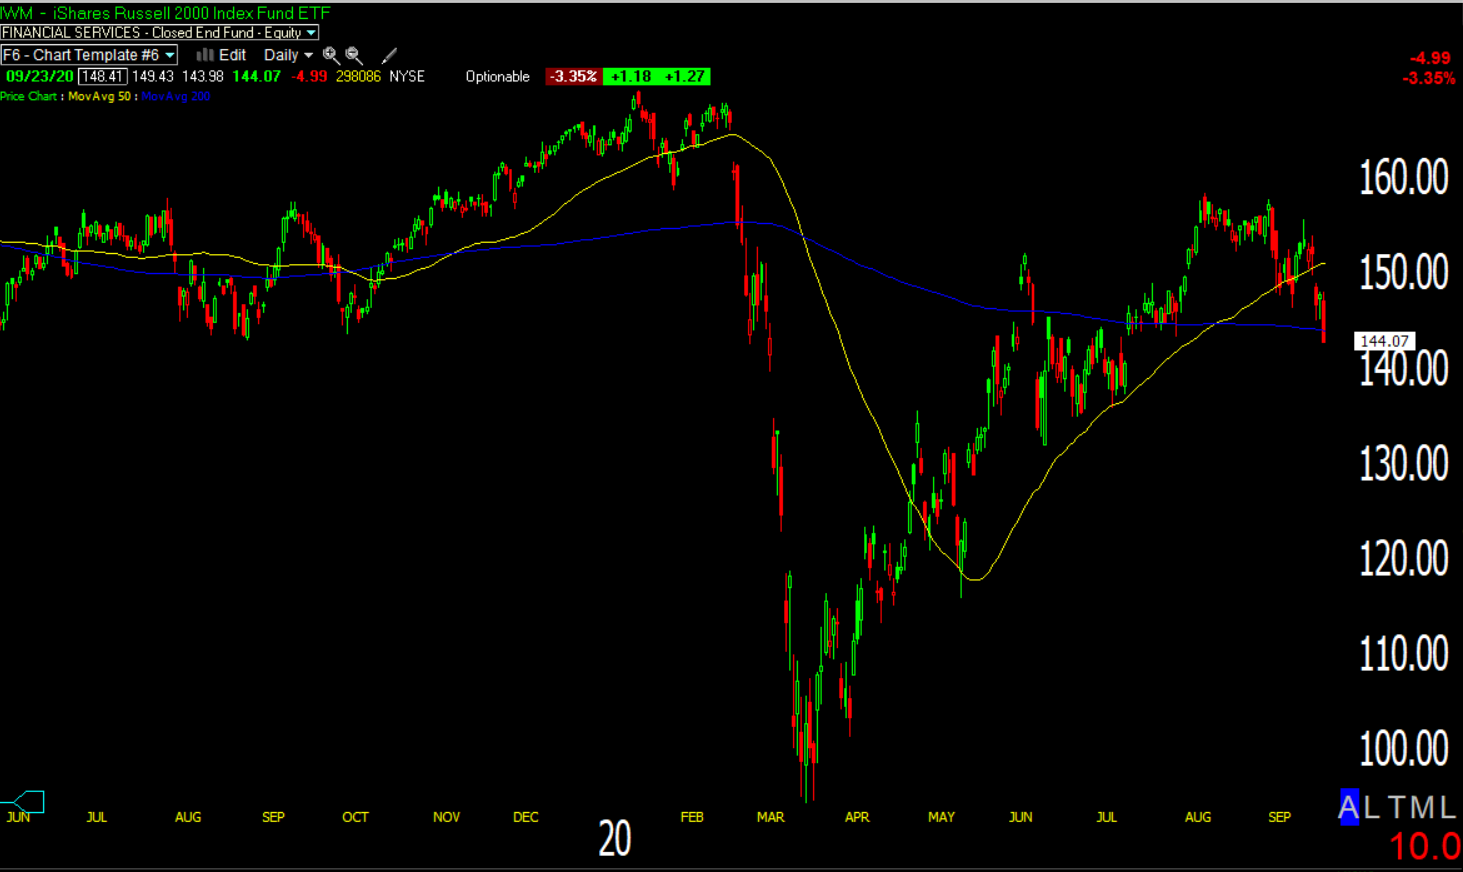 Small Caps/IWM (daily) has the worst close in my opinion, slicing below the week’s low to a lower low for the decline, and below the 200-day moving average (blue).
I do have a longer term Small Cap short, but I haven’t added to it recently.
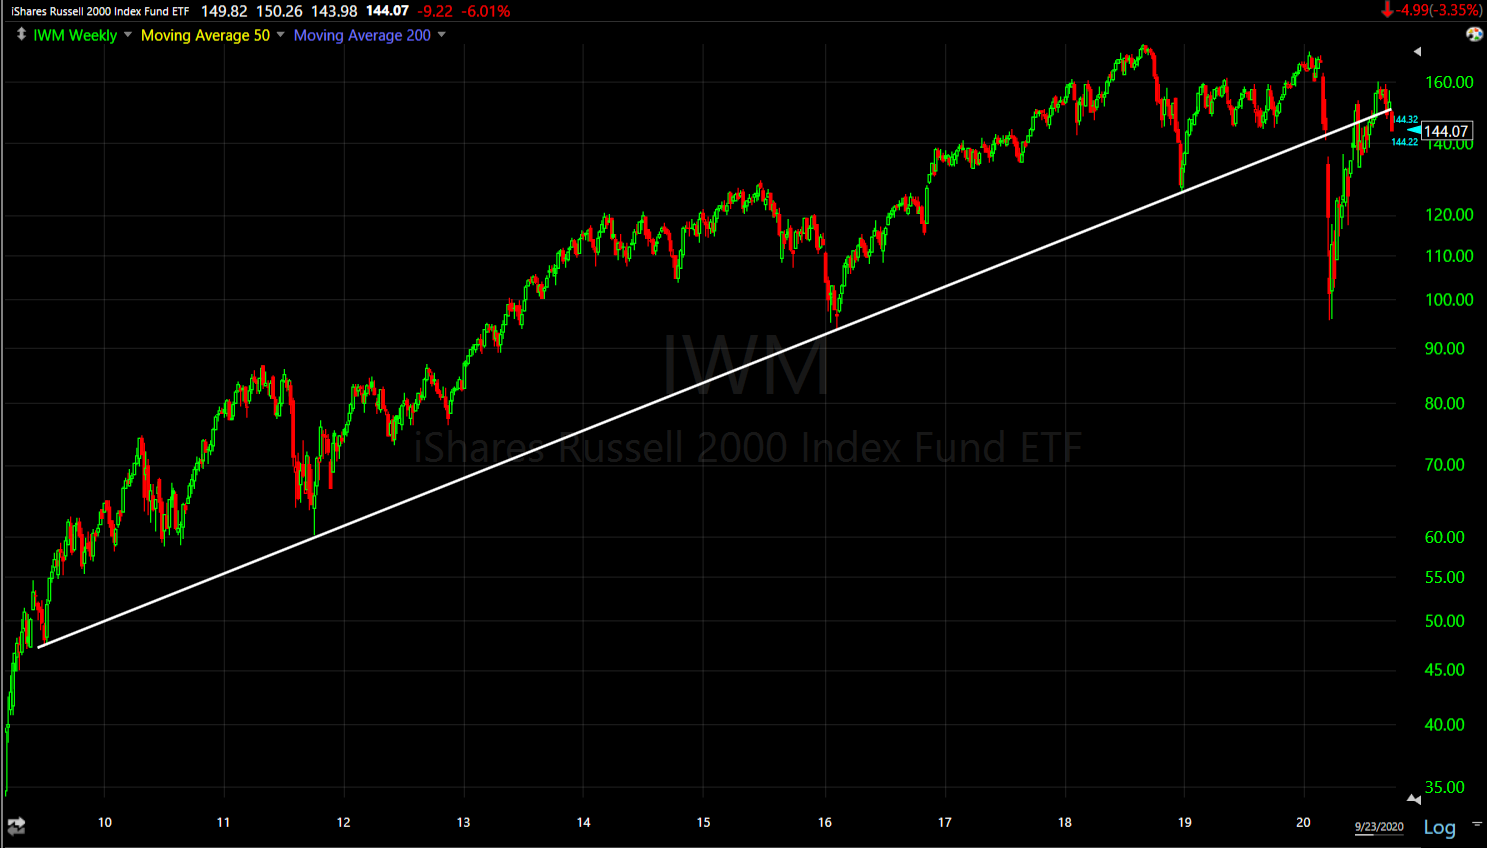 IWM (weekly) also moved back below the primary bull market trend. It had moved above in early August as the market tried to rotate to cyclicals/value, then just sat there doing nothing while mega-caps lifted the other averages to new highs in August. The domestically-focussed Small Caps are in a primary down trend or bear market as they’ve made a series of lower highs/lower lows since the economic cycle turned in Q3/Q4 of 2018. This is why my small caps short has been a long term position for me. I anticipate the trend continues and prices will turn down to make a new lower low.
S&P and Dow are trading in huge Broadening Tops (broadening formations or mega-phne tops), while domestically oriented Small Caps are in a primary down trend since their high in 2018. Don’t forget that the Dow 2020’s crash and counter-trend rally (thus far) is incredibly similar to the Dow’s counter-trend rally off the initial 1929 crash.
The chart below was posted in the August 28 Weekend Update. The Dow’s high was 3 days after this post, it’s down 8% since.
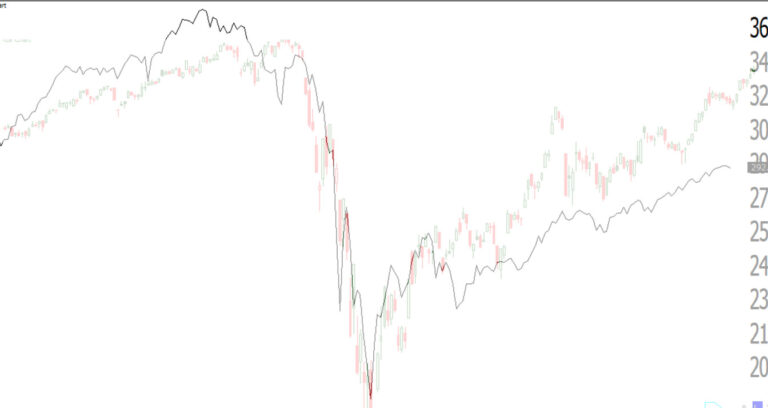
Dow 1929 crash and counter trend rally (black line) and Dow 2020 crash and counter trend rally (candlesticks).
S&P sectors
Selling was broad-based with all 11 sectors down at least 1%, but initially sparked by mega-caps, all of which are below their 50-day sma: Facebook (FB -2.25%), Apple (AAPL -4.2%), Amazon (AMZN -4.1%), Netflix (NFLX -4.25%), Alphabet (GOOG -3.4% at 200-day), Microsoft (MSFT -3.3%). I’ve watched Tesla (TSLA) as an indication of speculative risk sentiment, TSLA fell -10.3% today.
The worst performing sectors have a little of everything – Technology, defensive and rate-sensitive Real Estate, economically-sensitive cyclicals Energy and Materials, both of which made a lower low like Small Caps.
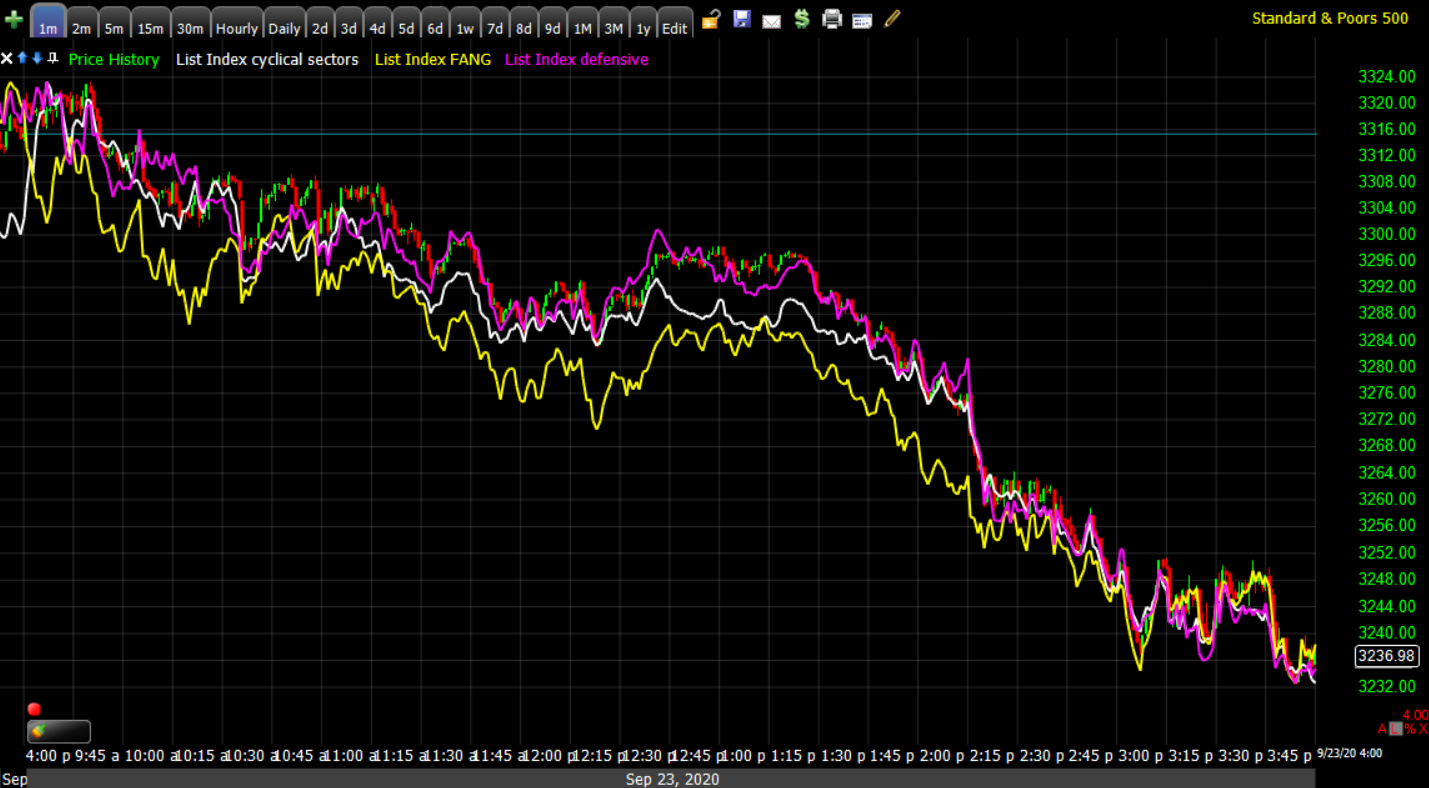 SP-500 (candlesticks 1m), cyclical sectors (white), mega-cap FANGs (yellow) and defensive sectors (pink)- sell everything.
Even style factors were all dumped – Momentum -2.9% , Growth -2.9% and Value -2.6% to name a few.
Materials ⇩ -2.94 %
Energy ⇩ -4.52 %
Financials ⇩ -2.23 %
Industrial ⇩ -1.79 %
Technology ⇩ -3.12 %
Consumer Staples ⇩ -1.50 %
Utilities ⇩ -1.53 %
Health Care ⇩ -1.03 %
Consumer Discretionary ⇩ -1.64 %
Real Estate ⇩ -2.87 %
Communications ⇩ -2.39 %
Several cyclicals made lower lows for the market decline from record highs, similar to small caps. The first two are not influential as far as weighting, but do say something about the economic picture, the third is more influential and also says something about the deteriorating economic outlook.
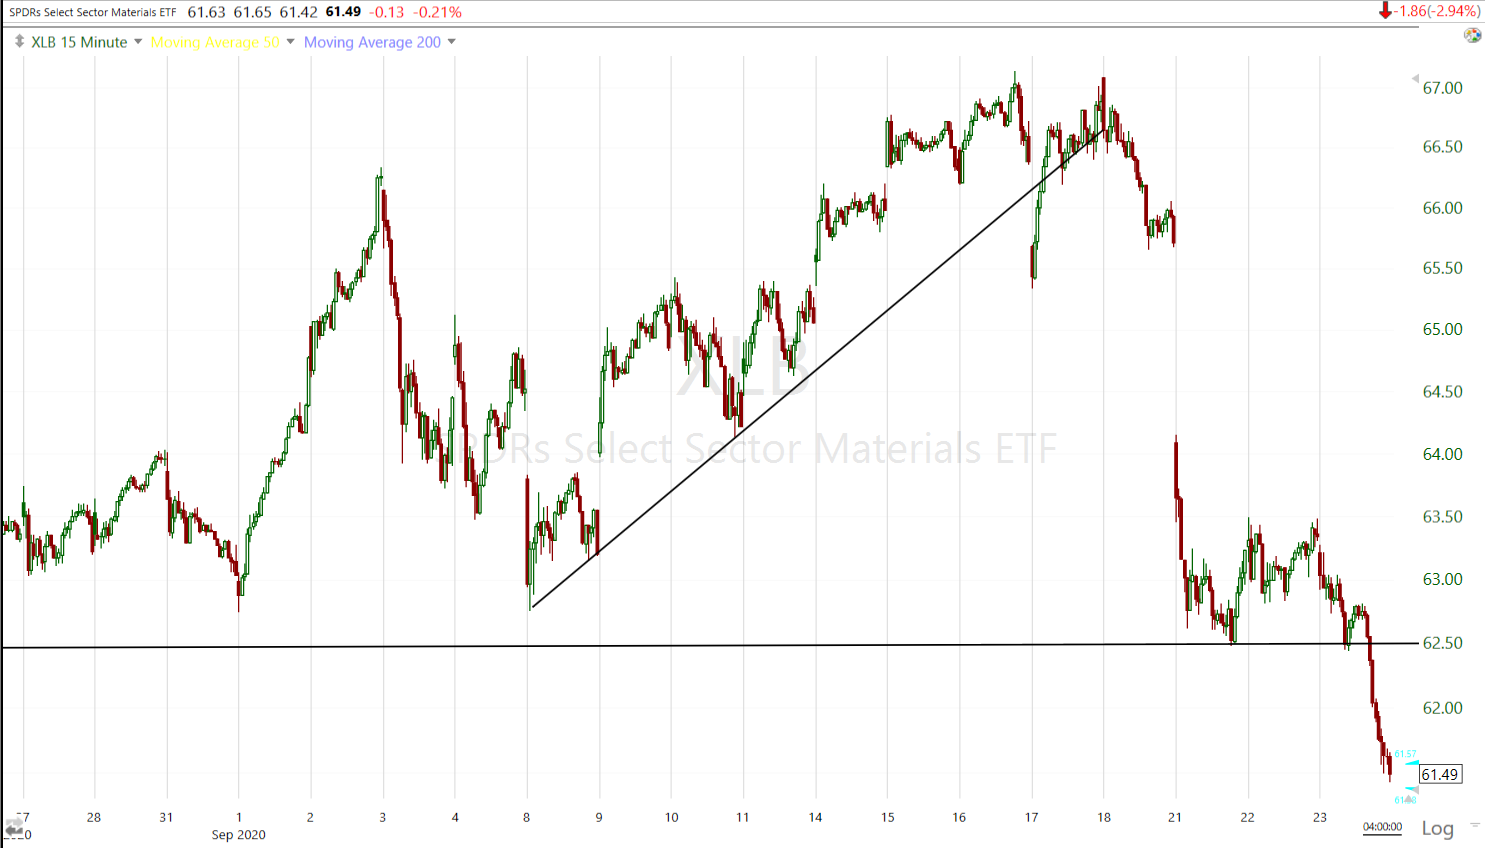 Materials sector (15m) – extremely lightly weighted, but a bellwether for the economic outlook.
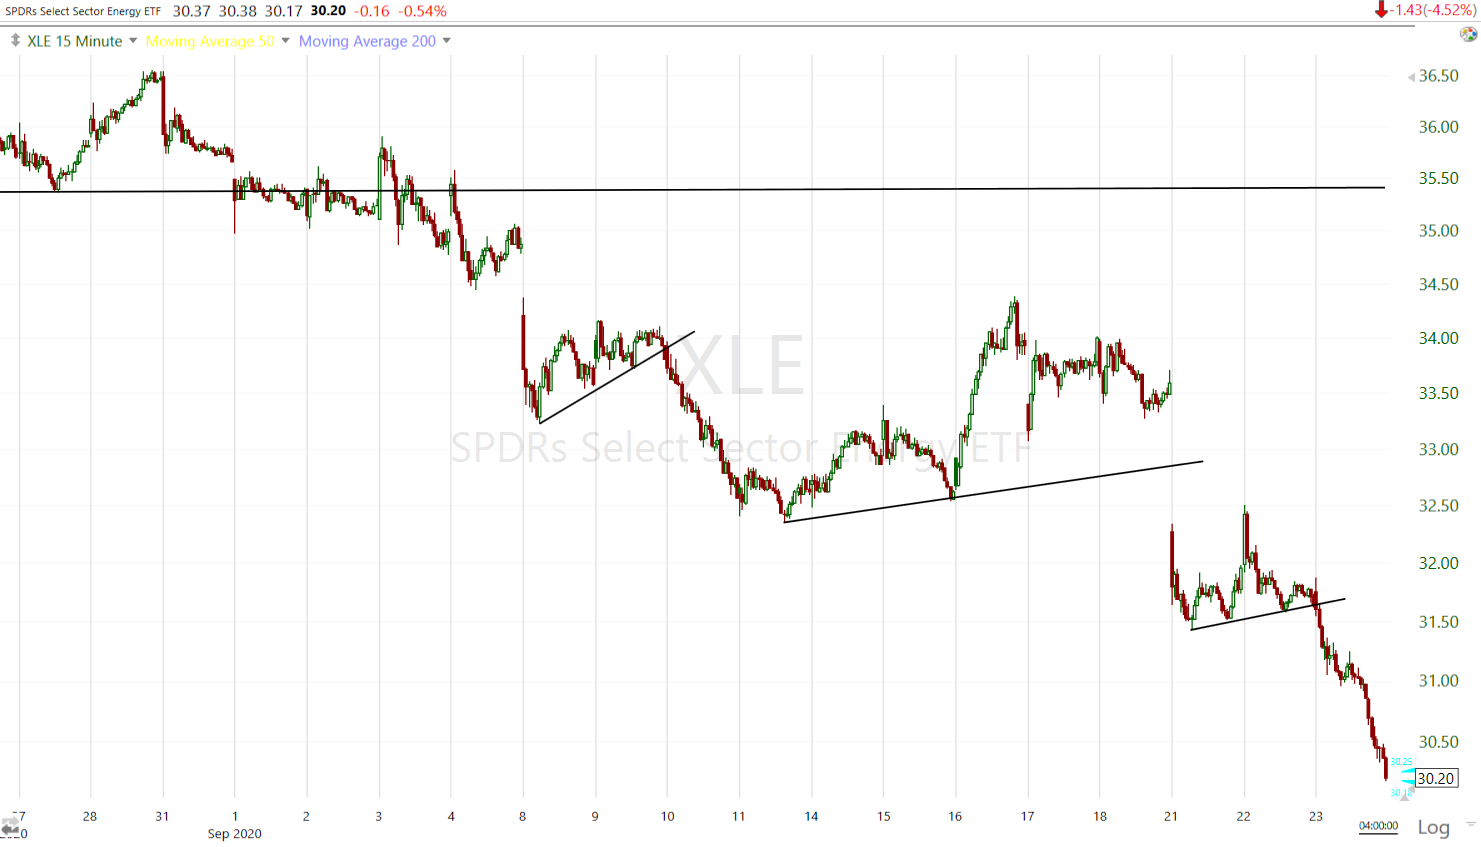 Energy sector (15m) -what can I say, I’ve been pointing out these bear flags for a while and prices keep falling.
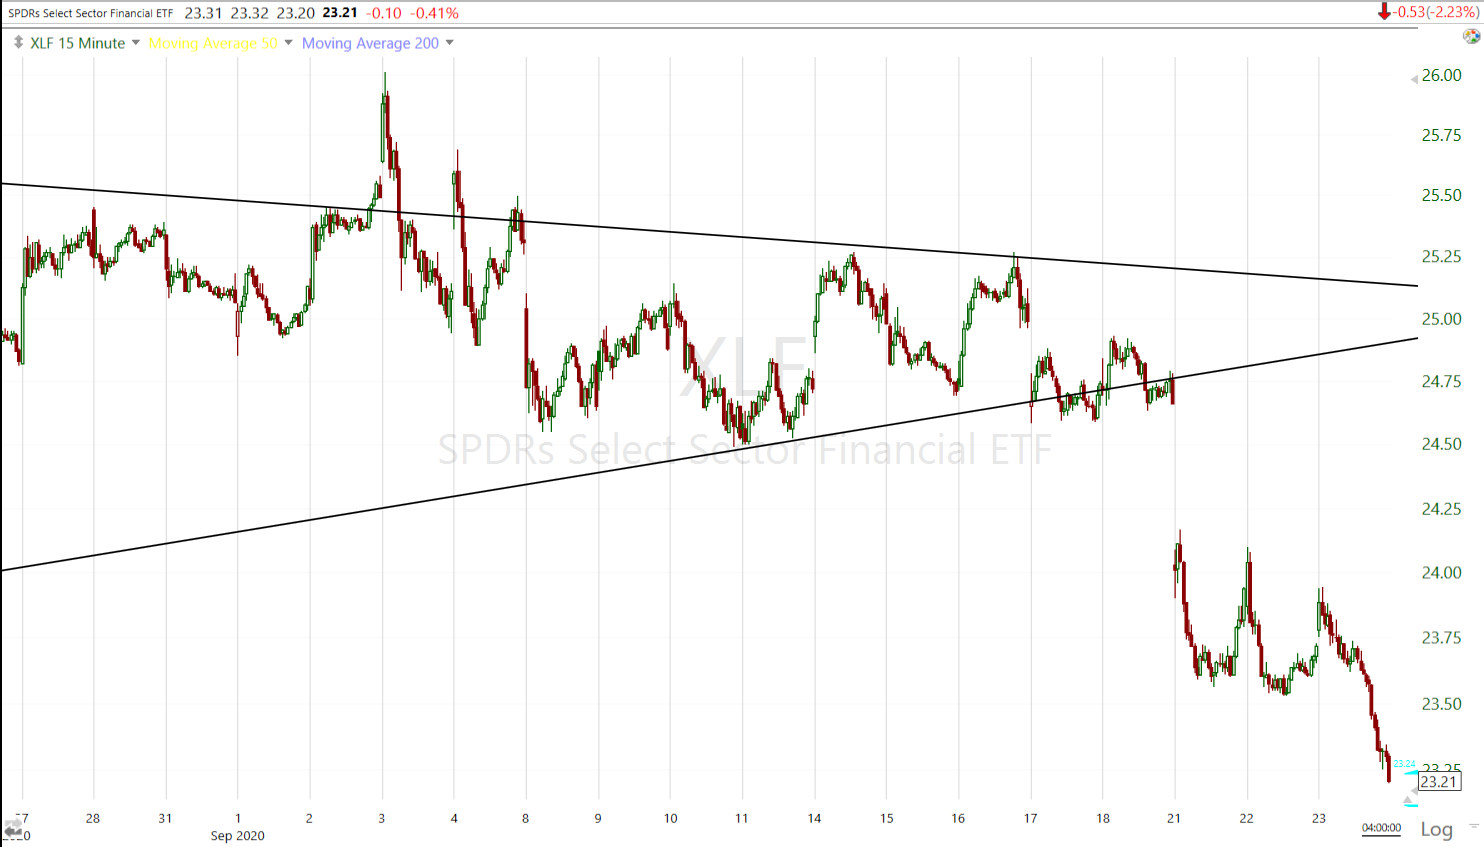 Financial sector (15m) broke below its consolidation and its 50-day, now trading to a lower low.
When you hear the CNBC talking heads gushing about the rotation to cyclicals and value, remember these charts.
There are more influential sectors, like Technology, that are below their pivot point, but still at a higher low on the week.
Internals
NYSE Decliners (2684) dwarfed Advancers (318) by more than an 8-to-1 ratio on heavier Volume of 1 bln. shares
The Dominant price/volume relationship is Close Down/Volume Up, often marking a 1-day oversold condition.
With the dominant p/v relationship, all 11 sectors down and decliners more than 2-to-1 over advancers, today is as solid of a 1-day oversold condition as you can expect.
As you might imagine, breadth oscillators are deep in oversold territory.
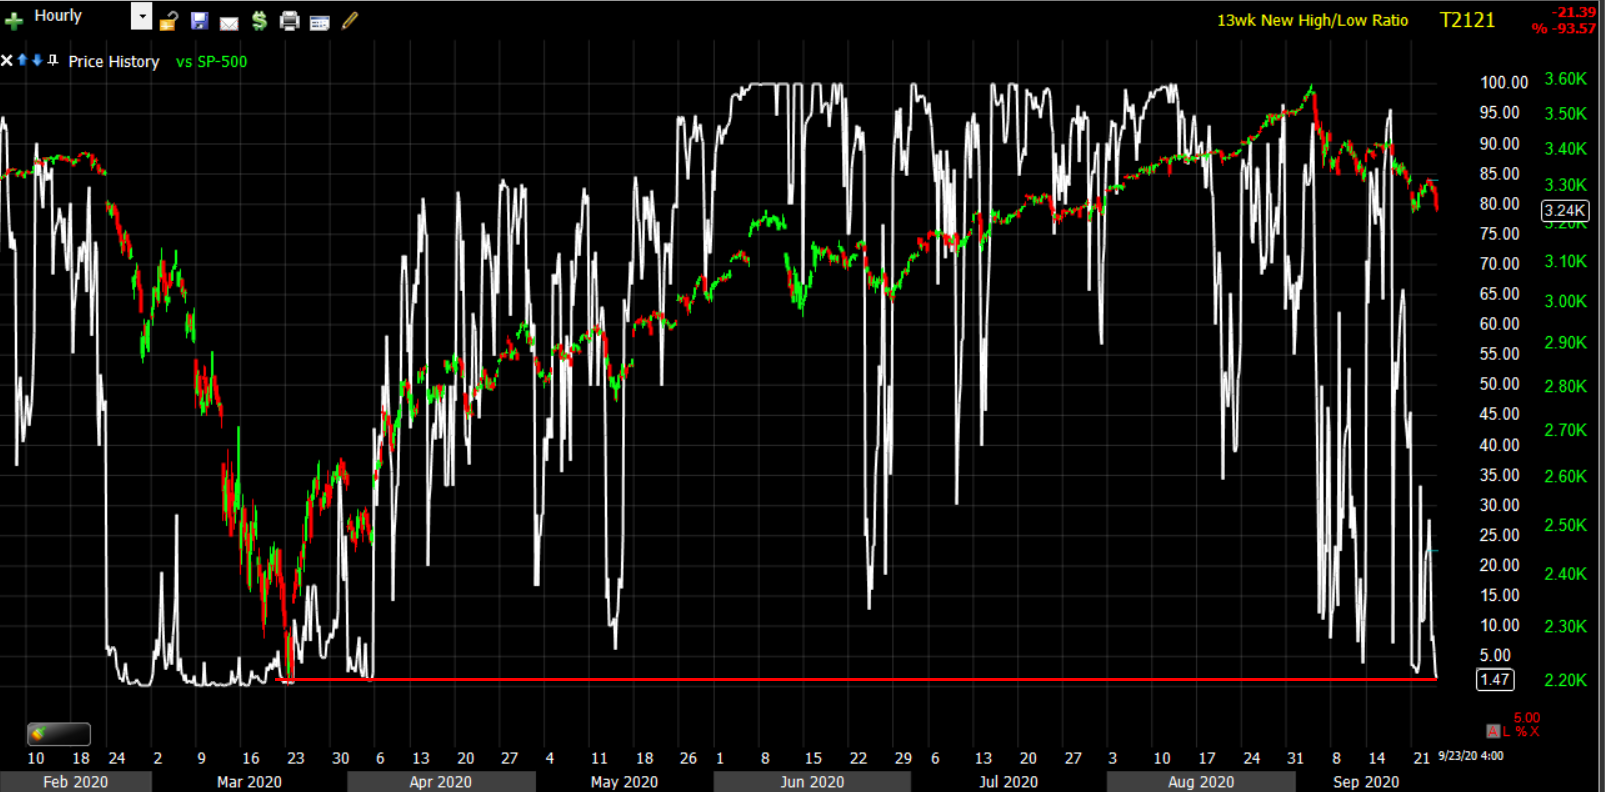 SP-500 (60m) and NYSE 13-Week New High/New Low Ratio at an even deeper oversold reading today, the deepest since the crash.
Volatility
Volatility was suppressed and dull most of the day. There was a positive divgernece in VIX futures at overnight lows, but in the cash session there wasn’t even 3C confirmation. Even after the NASDAQ broke below its pivot this afternoon and volatility responded, it was still subdued. VIX’s +7.9% is a relatively modest gain considering.
The Fed’s Jay Powell, and other Fed presidents, were speaking yesterday, today and will be tomorrow. Volatility is often suppressed around Fed events. That may be the reason why volatility was subdued. Recall that volatility relative strength led the sell off in stocks from record highs, and relative weakness led to the consolidation phase last week. Volatility signals are not essential, but they’re an added bonus. From the looks of vol today it seems the market was caught off guard, then again that is what I’ve thought was likely if the Dollar were to rally – traders would be caught off guard.
Treasuries
U.S. Treasuries were dull as previously mentioned, and finished near their flat lines. The 2-year yield was unchanged at 0.13%, and the 10-year yield increased one basis point to 0.68%. I’m a little surprised that with the intensity of selling as the day went on that there was no flight to safety into the long bond. I would have expected to see that, and perhaps we still will. No other traditional safe-havens were bid, except maybe the Dollar.
Currencies and Commodities
The U.S. Dollar Index gained +0.4% to $94.35 weighing on stocks, commodities, precious metals and bitcoin.
WTI crude futures bucked the trend and gained 1.0% to $39.94/bbl, but retraced those gains after the settlement time.
Copper was down over 3% and traded below the psychological/technical $3.
Gold futures ended lower by -2.1% to $1,868.40/oz, under the psychological $1900 and near a two-month low, pressured once again by today’s firming in the dollar. Real Yields ended at their highest in a month, and that’s another point of pressure for gold which has been moving opposite Real Yields.
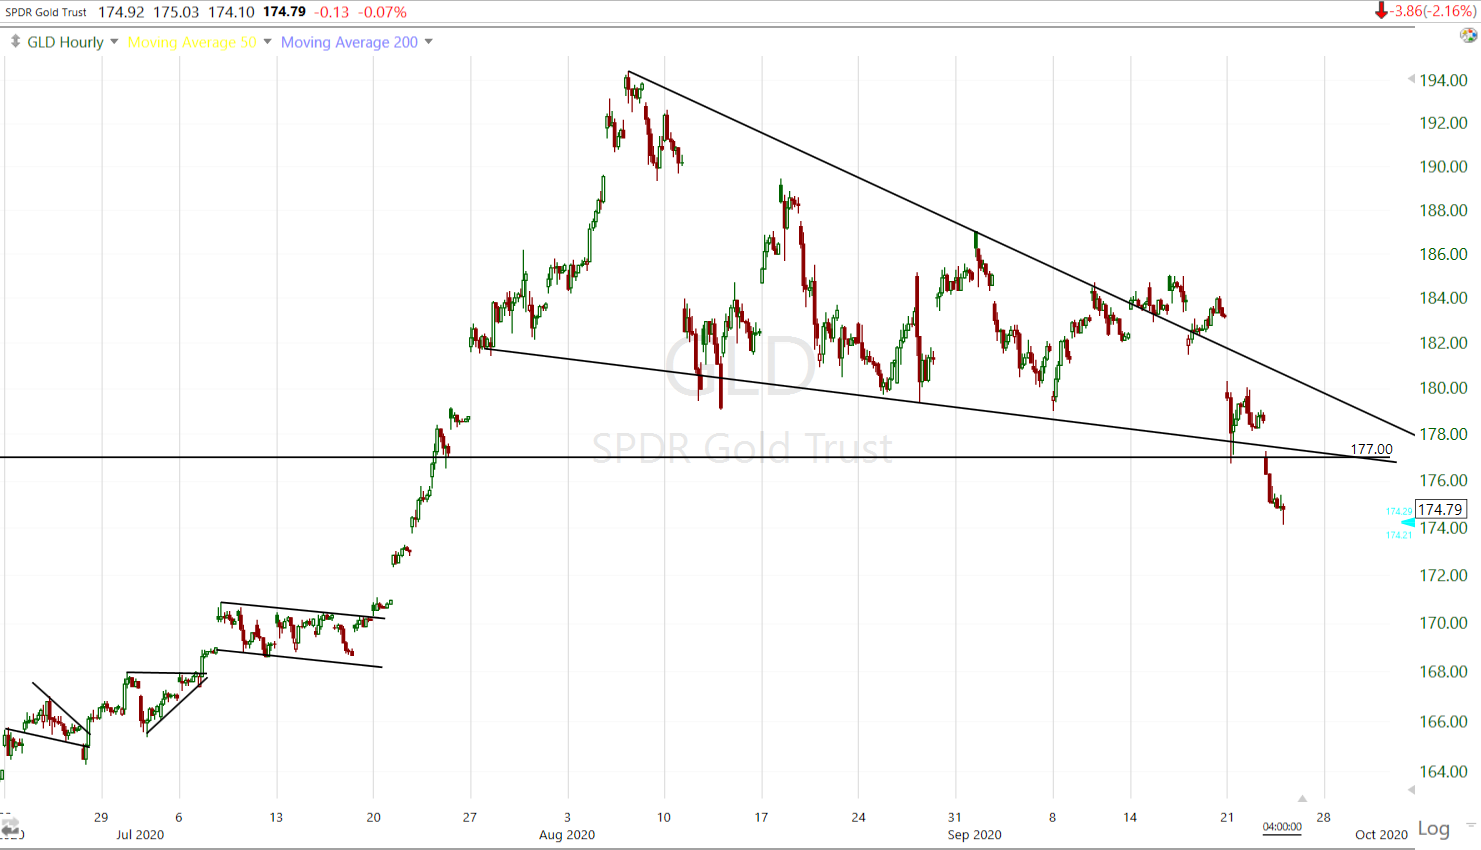 GLD (60m) came down to the $177 area where I was interested in a long position, but price action in gold, silver and gold miners had not stabilized yesterday. It’s more apparent on SLV’s chart below.
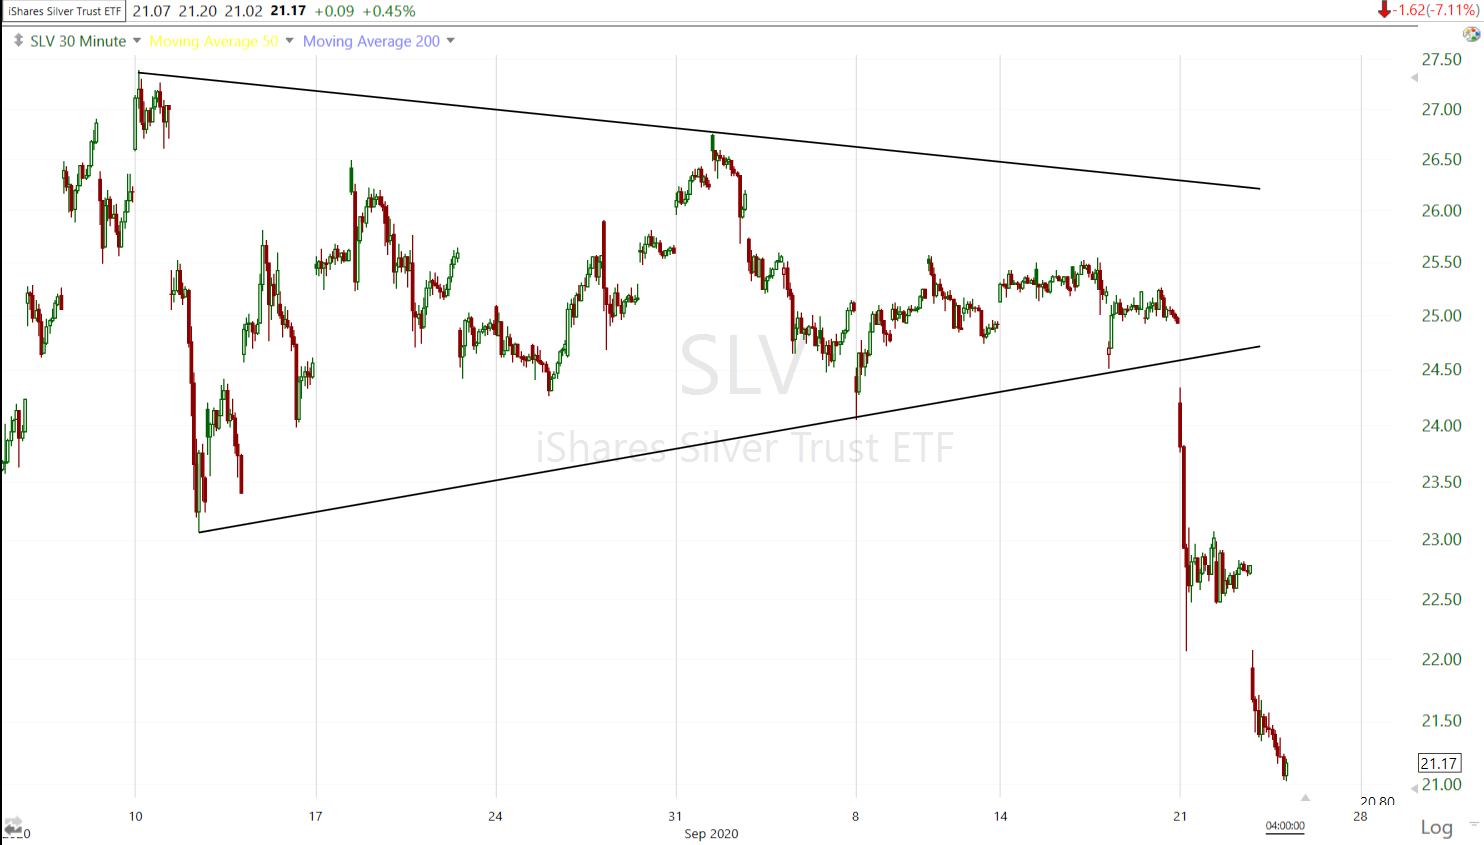 SLV (30m) broke its consolidation triangle and ended yesterday with a small bearish consolidation before falling more today. Prices still have not stabilized in either silver or gold.
Summary
I am a little surprised how quickly the worm turned today, but I did see an important market signal in the Early Update…Investment Grade Credit was leading the S&P lower. By the afternoon high yield had broken down too. Credit was in fairly good shape on a short term basis just Friday, so the deterioration today was extreme. Credit is one of the market signals I have mentioned I’d be on the lookout for and it was jumping off the charts today. I am surprised how quickly it happened, and it’s not like credit was being pressured by yields, it just went risk-off and fast.
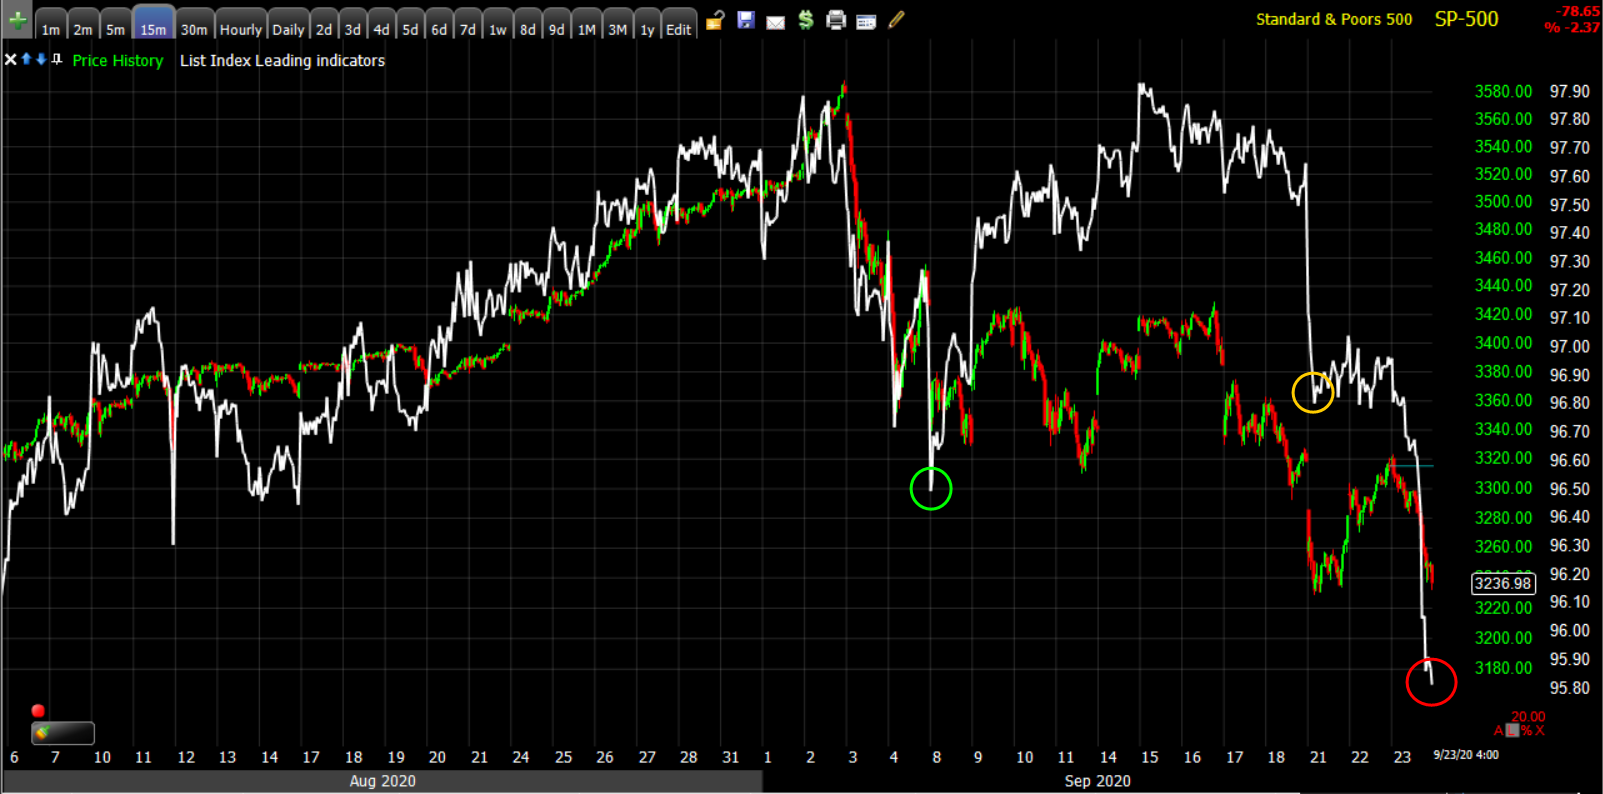 SP-500 (15m) and an index of multiple credit assets (white). Credit had made higher lows last week as the S&P started trading sideways. There was some deterioration Monday, but still at a higher low (yellow relative to green). Today the bottom fell out (red), leading the market lower. In my view, this is a more bearish signal than anything that happened in stocks today.
Finally USD/JPY (don’t confuse with the Dollar index, this pair reflects how the safe-haven Yen trades relative to the Dollar). USD/JPY led the market lower over a week ago, and it was one of the only signals leading into yesterday’s market bounce. I said last night that I thought it would trade up to $105.50 and backtest the broken trend (below is risk off). That’s exactly what it did today.
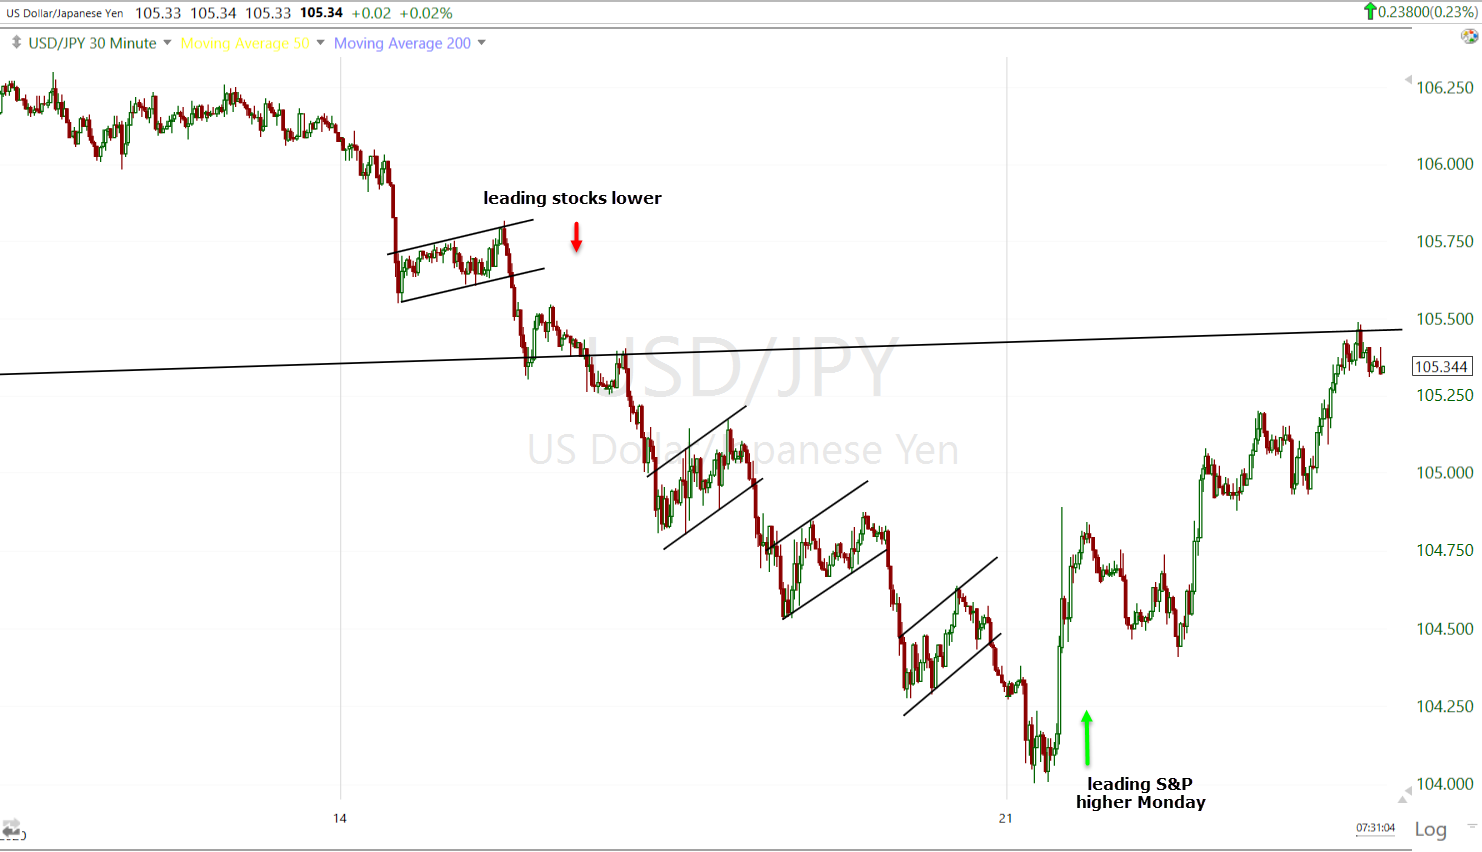 USD/JPY (30m) leading stocks lower (red), turning risk-off below $105.50, and leading the S&P’s bounce yesterday (green). The pair traded higher today as price suggested was likely, right to the trend line at $105.50. Again, I’m surprised we didn’t see any flight safety (USD/JPY lower) today.
Had the S&P traded up to $3360-$3370 while credit turned down as it did today, and USD/JPY hit the $105.50 level, or even better turned down, that would have been the no-brainer short entry set-up of the year. I’d like to see the S&P bounce off the week’s low with some of those aspects in play to provide a short entry. I don’t know if we get it, but that’s what I’d like to see. It would likely take a dollar consolidation or pull back. By now it should be obvious what’s driving the downside in stocks (and other assets), and just how destructive the rising dollar currently is for stocks.
Overnight
S&P futures were down near -0.5 in afterhours, they are currently unchanged. Russell 2000 futures are up a little +0.35%. 3C is mostly in-line with prices, there are a couple of small afterhours positive divergences developing. VIX futures still look so-so on 3C.
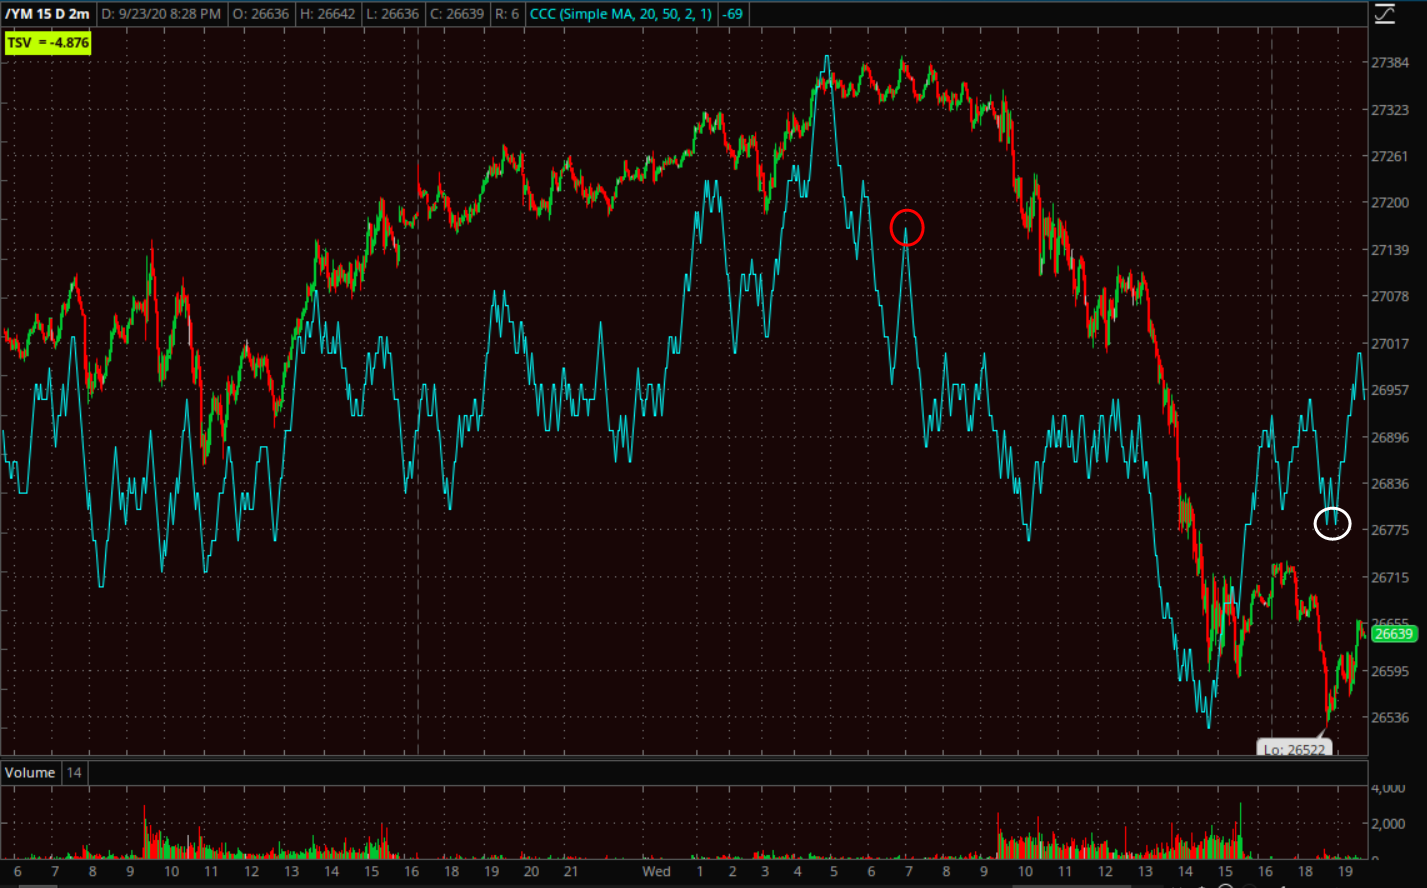
Dow futures (2m) neg. divergence (red) and pos. (white) developing tonight.
Treasury futures are still little changed, as if nothing was happening.
On deck tomorrow we have U.S. initial jobless claims, New Home Sales for August, Powell and Treasury Secretary Steven Mnuchin will testify again before a Senate committee on the economic response to the pandemic on Thursday, and there is a parade of Fed officials speaking tomorrow.