Stock Market Update – Feb. 22, 2021
The February rally off the S&P’s 50-day is running into trouble over inflation concerns amid unbridled monetary stimulus from the Fed and fiscal stimulus from Washington D.C. We saw this dynamic clearly last week when the 10-year yield crossed above 1.3% and stocks sold off, and saw it earlier this morning and this afternoon with yields pushing higher and growth stocks declining.
As inflation fears become more tangible in commodity prices and some economic data, certain areas of the market are feeling the negative effects. Last week started with trouble in Small Caps, although small caps and cyclical/value sectors pulled together toward the end of the week. Growth stocks remain under pressure evident as the S&P fell for a 5th consecutive session, the longest losing streak since February of 2020, and NASDAQ displayed particular relative weakness, also down 5 days in a row as weakness in growth stocks outweighed strength in value/cyclical stocks today.
The 10-year yield touched 1.39% in overnight action, sending index futures lower, but yields moved to flat or even down slightly this morning following a spate of headlines from central banks including the ECB and the Fed in what appeared to be an effort to jawbone yields lower. However, yields resumed their advance this afternoon and stocks came down with NASDAQ closing at session lows.
Averages
The S&P and NASDAQ are down 5 days in a row. The NASDAQ posted its second worst day since October. The Dow managed to eke out a modest gain. Boeing(BA -2.11%) weighed on the Dow early after a Pratt & Whitney engine in one of its 777 planes caught fire over the weekend, but the Dow bounced shortly after the open. Small Caps displayed relative weakness much of last week, but improved modestly into the end of the week with cyclical/value sectors. As mentioned above, NASDAQ-100 closed at sesion ls as richly valued growth stocks came under selling pressure.
S&P 500 ⇩ -0.77 %
NASDAQ ⇩ -2.63 %
DOW JONES ⇧ 0.09 %
RUSSELL 2000 ⇩ -0.69 %
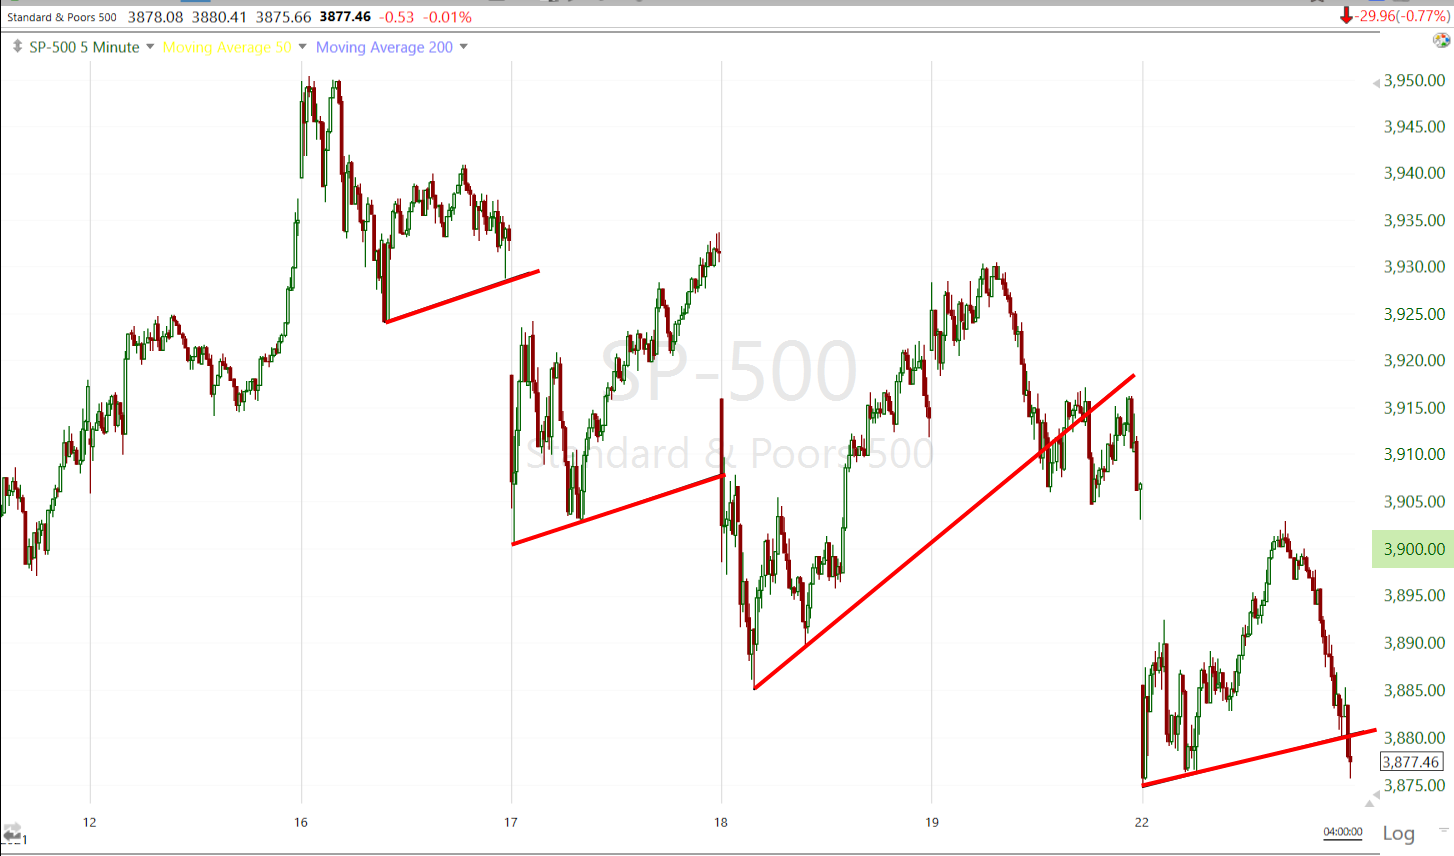 SP-500 (5m)- while there hasn’t been a sharp sell-off, the S&P has declined the last 5 days with small corrections in between that try to fill opening gaps. This afternoon there was intraday weakness on 3C charts of index futures as yields rose, and some positive 3C signals in VIX futures, suggesting the averages were likely to test either the day’s lows or their small bearish corrective trend lines. The S&P closed just below the day’s corrective (bearish) trend line after almost filling the opening gap. The S&P also closed below the $3900 level. Although the S&P fell below $3900 intraday a few times last week, today was the first time it closed below $3900.
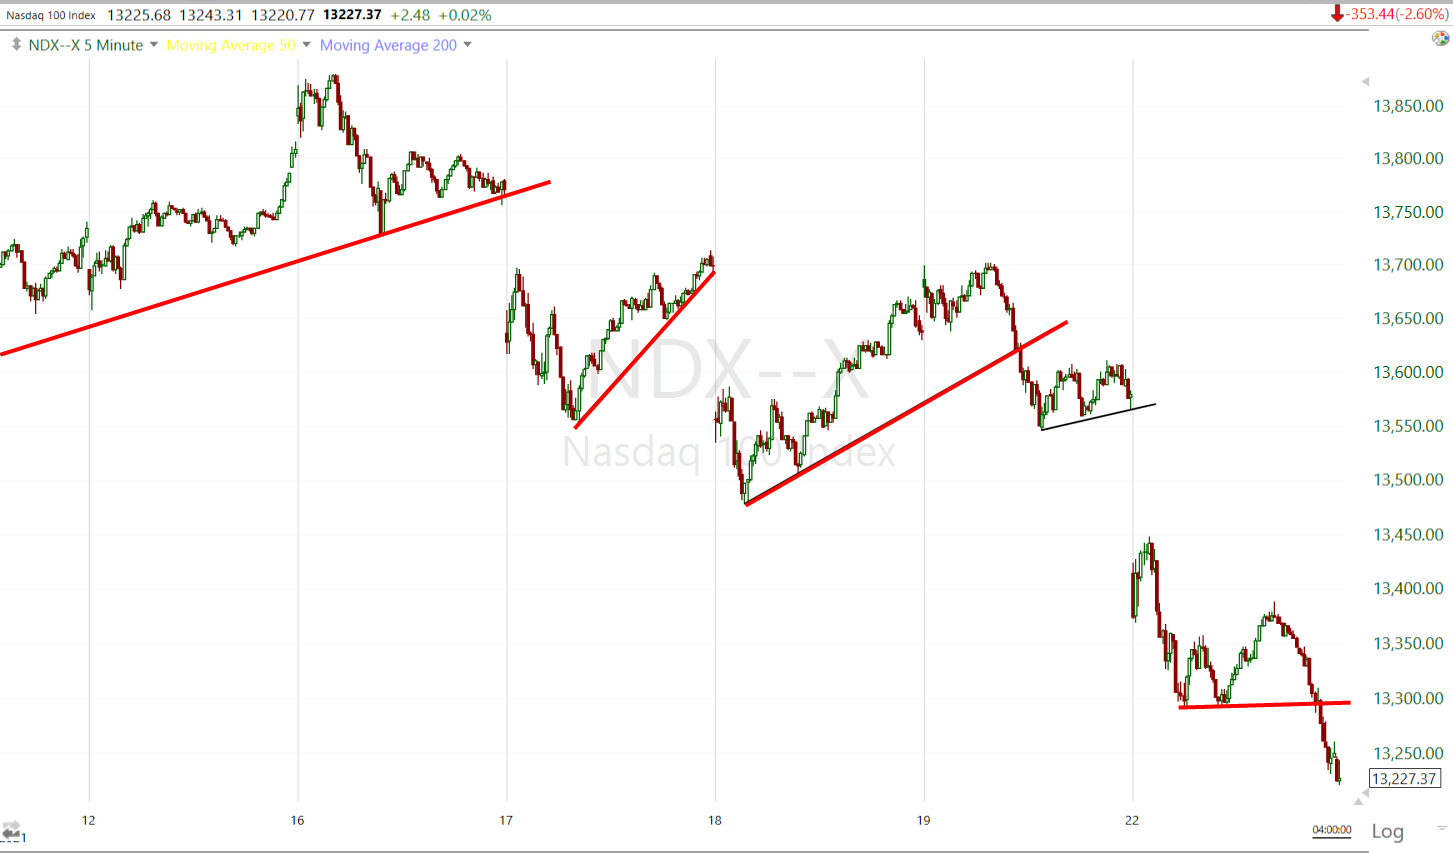 NASDAQ-100 (5m) not only tested the intraday trendline into the close, but closed below and at session lows. Notice the bearish price action since the start of last week. NASDAQ made (2) -1.5% measured moves lower last week and today a larger -3% decline from Friday’s consolidation. As mentioned earlier today, I think it’s probable that the NASDAQ-100 tests its 50-day moving average sooner than later.
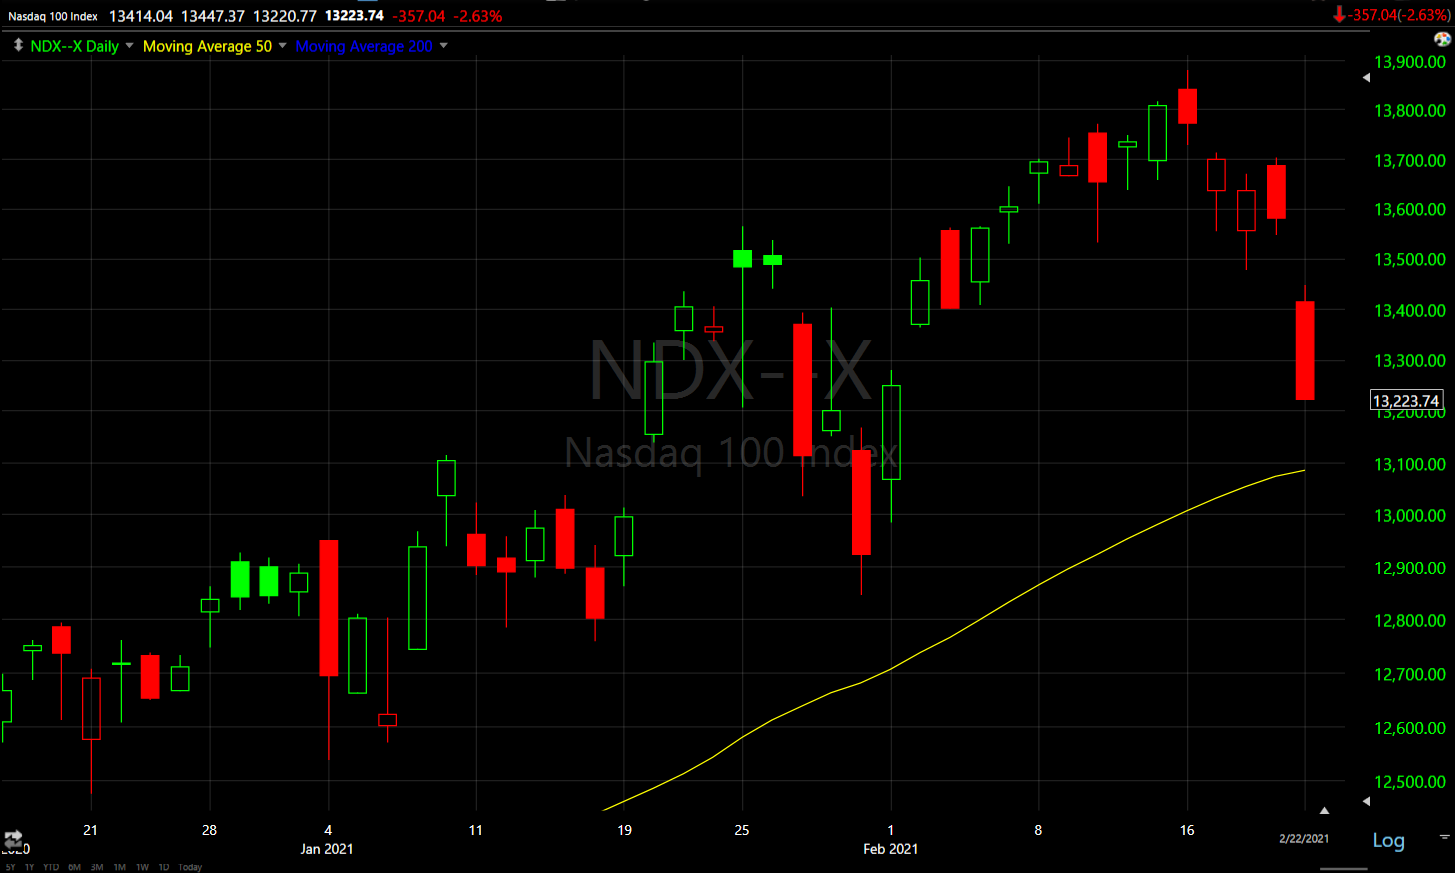 NASDAQ-100 (daily) about -1% from testing its 50-day (yellow) moving average below.
Small Caps were actually the weakest among the majors last week, but had a good day Friday. Today was essentially a bullish consolidation of Friday’s gains (compare the price tone to NASDAQ-100 above).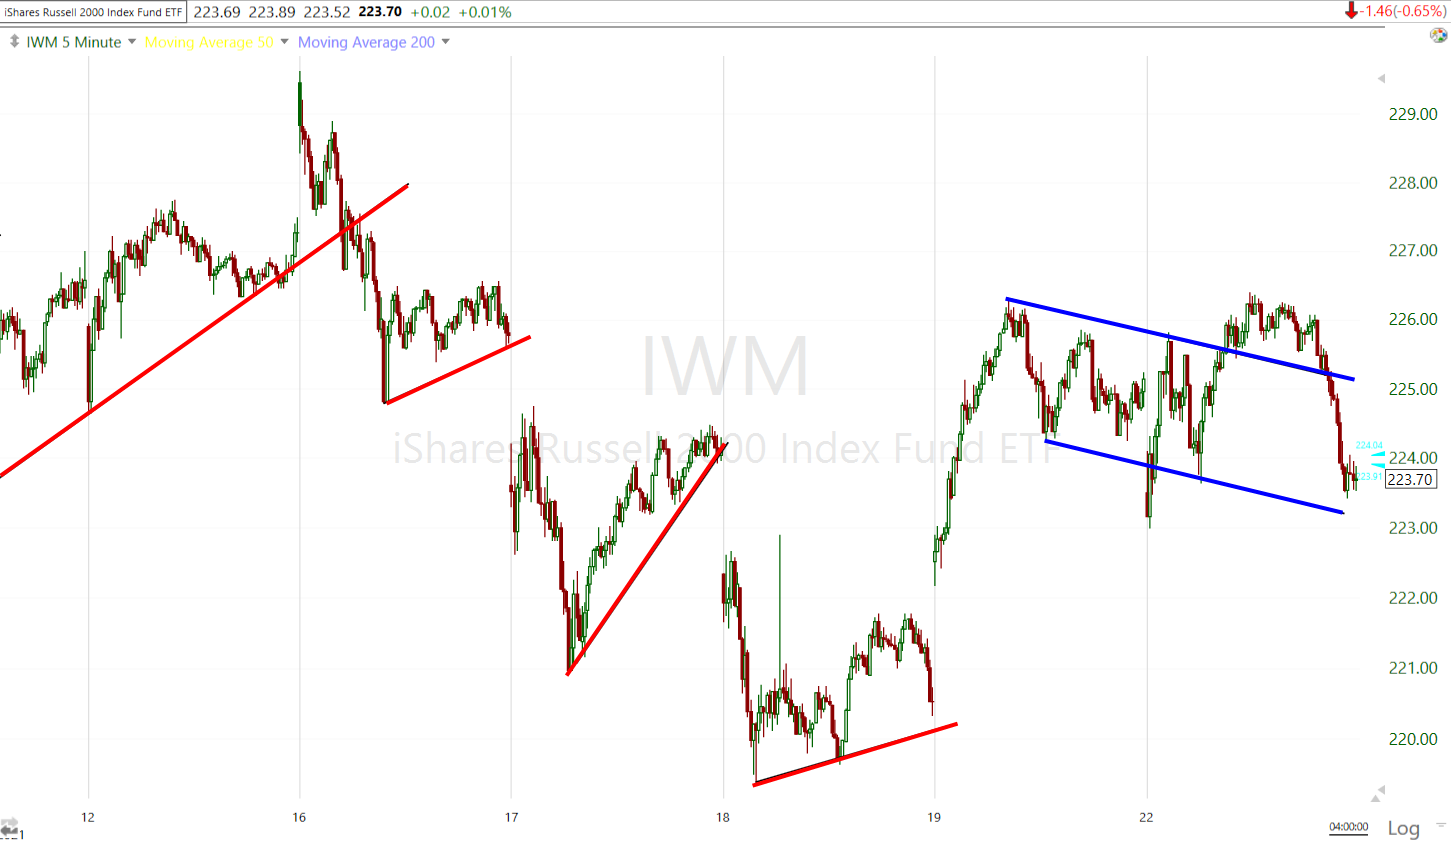
IWM (5m)
VIX (+6.35%) acted fairly well today. The trend the last 2 weeks has been strength early in the week and weakness late in the week. VIX futures looked pretty good today and this afternoon. However, VIX does seem to be tangling with resistance at its 50-day moving average.
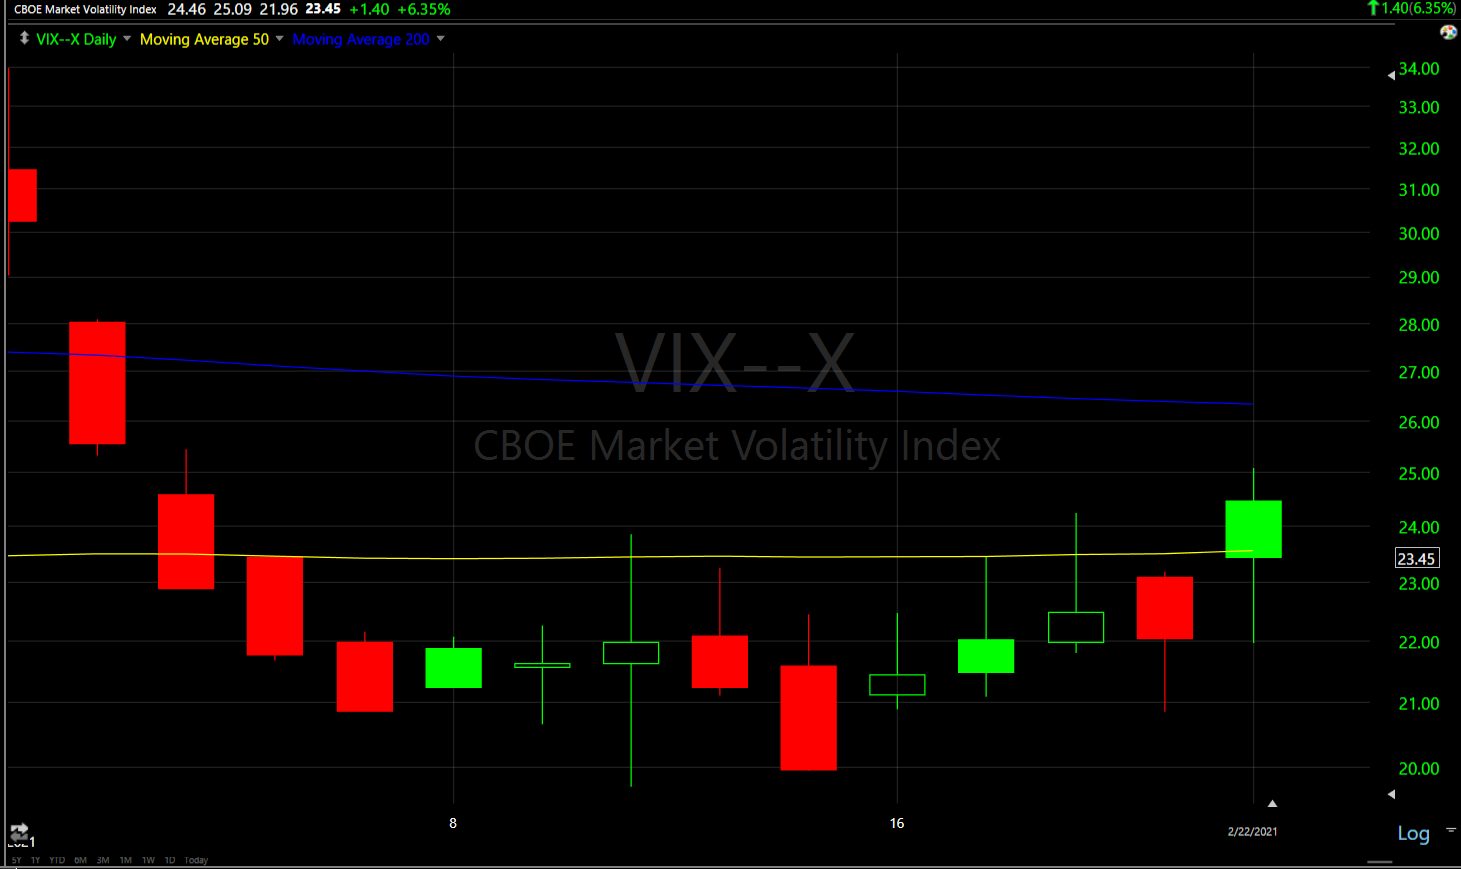
VIX (daily) with a close just below its 50-day
On a side note, the Absolute Breadth Index – one of my favorite volatility signals – has been plunging recently from 54 about 7 days ago to just 21 today. Typically I consider the ABI at an extreme low (below 14) a signal that VIX will likely move double digits in percent terms (typically 50% or more) over the next month.
While fairly rare, there have already been two ABI long volatility signals in 2021. The first time VIX jumped 35% in the next 4 days, the second time it jumped almost 70% over the next 3 days, but I usually give trades a month of duration because sometimes it takes a month for VIX to make such a move.
S&P sectors
While most major averages ended lower, 6 of 11 S&P sectors ended higher. Cyclical/value sectors led amid the inflationary bias with Energy easily the best performing amid sharply higher oil prices, and Financials benefitting from the recent sharp rise in yields. However, growth stocks that have seen extremely high valuations justified by low rates for over a decade were under pressure – specifically in the Technology and Consumer Discretionary sectors. Within Technology, semiconductors underperformed as the Philly Semiconductor index (SOX) fell -3.77%. Mega-caps like Amazon (AMZN -2.13%), Apple (AAPL -2.98%), Alphabet (GOOG -1.73%) and Microsoft (MSFT -2.68%) also underperformed amid valuation concerns.
Materials ⇧ 0.39 %
Energy ⇧ 3.46 %
Financials ⇧ 0.93 %
Industrial ⇧ 0.32 %
Technology ⇩ -2.21 %
Consumer Staples ⇧ 0.09 %
Utilities ⇩ -1.95 %
Health Care ⇩ -0.24 %
Consumer Discretionary ⇩ -2.11 %
Real Estate ⇧ 0.58 %
Communications ⇩ -0.40 %
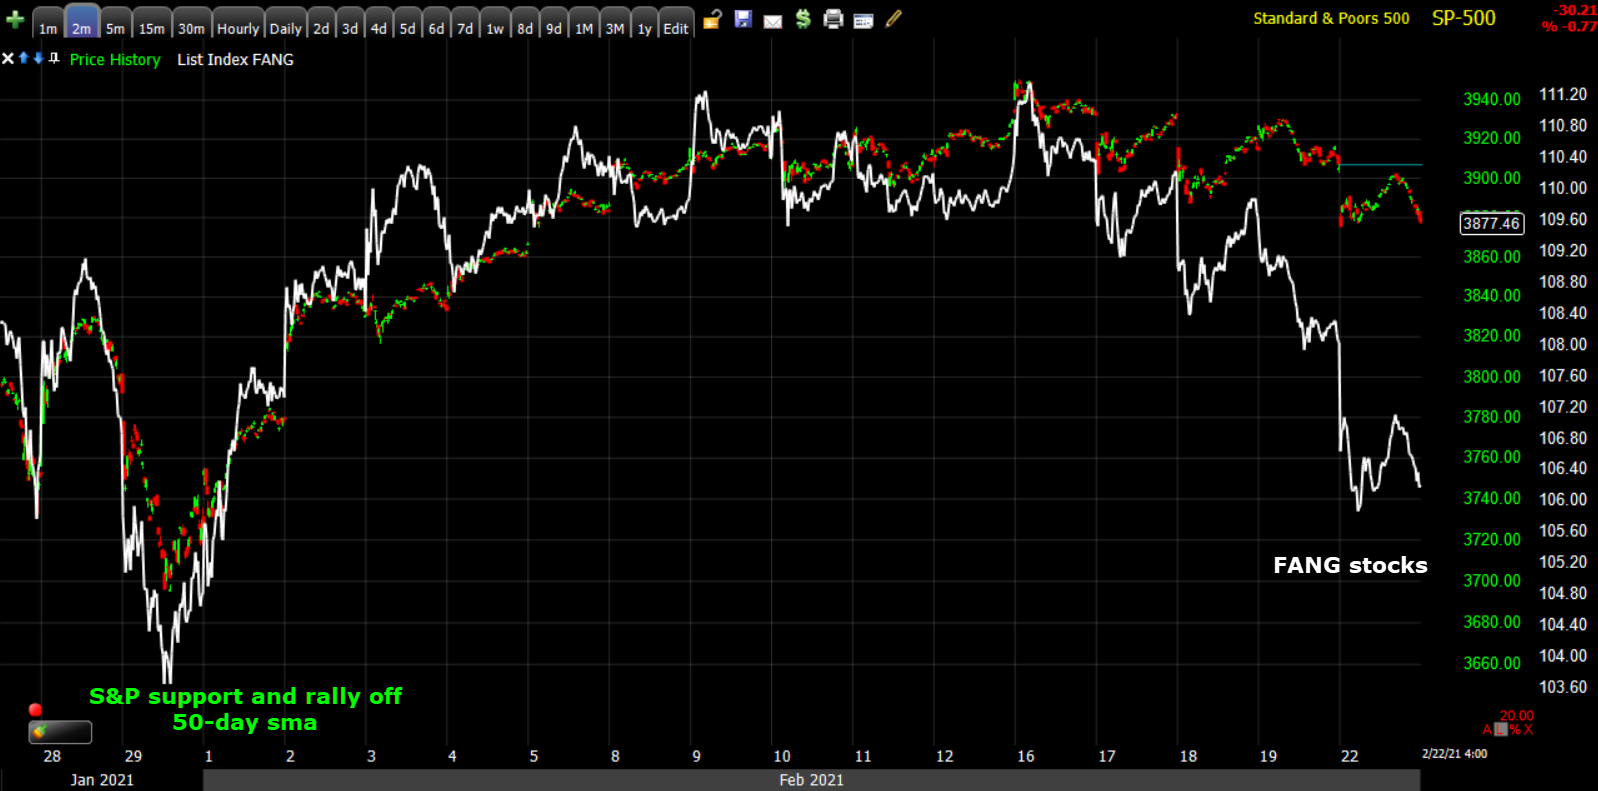 SP-500 (2m) and the influential heavily weighted mega-cap growth stocks (FANGs) leading the S&P and NASDAQ-100 lower.
Tesla (TSLA -8.55%) tends to be a decent proxy for risk sentiment. TSLA was not only down notably today, breaking below recent support around $800, but closed solidly below its 50-day moving average.
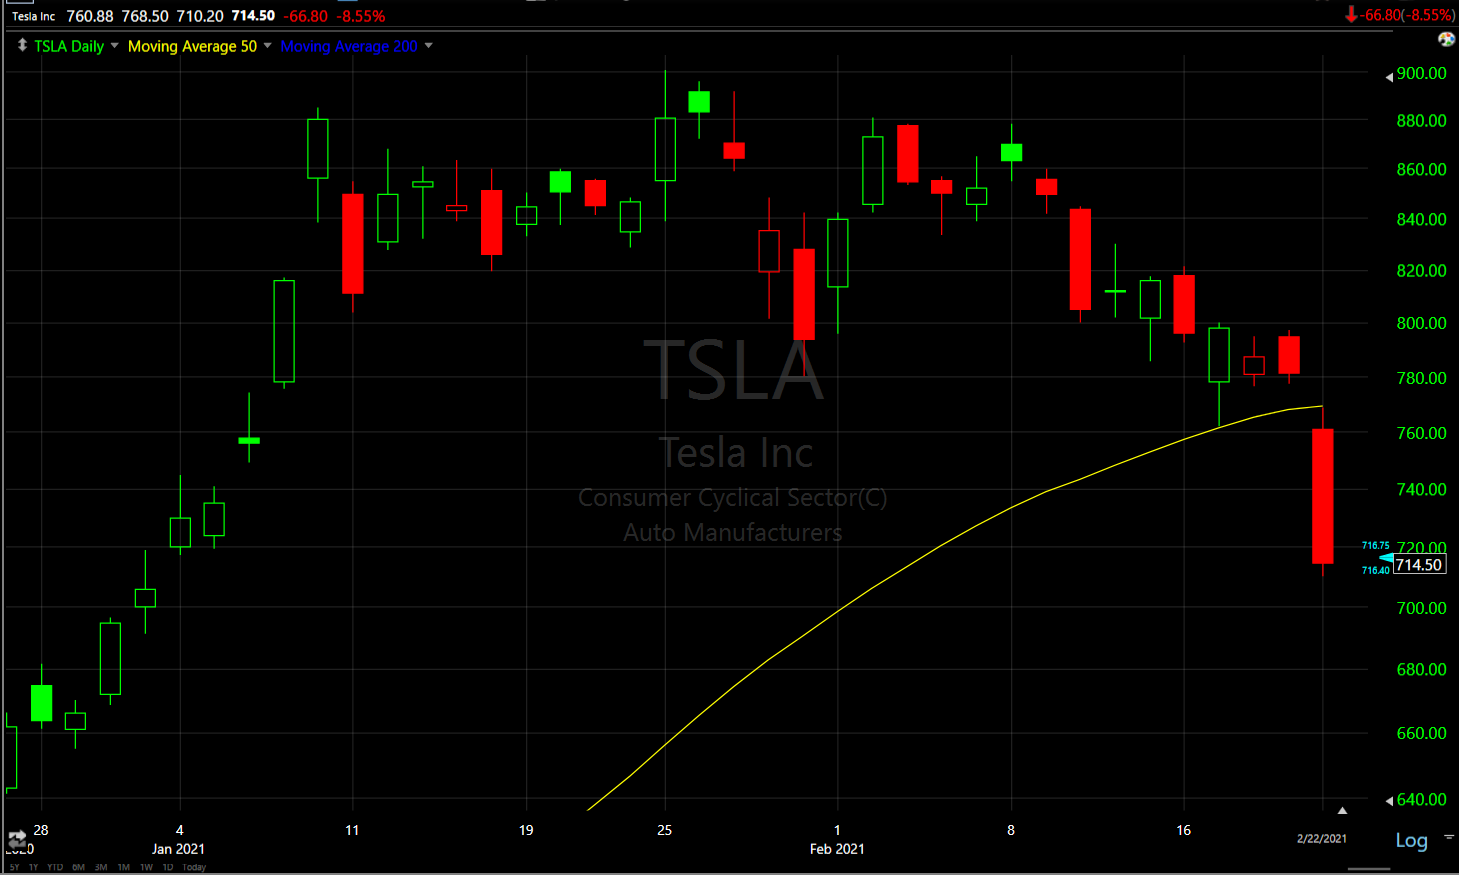
TSLA (daily)
Internals
NYSE Decliners (1675) just edged out Advancers (1510) amid relative strength in small caps. Volume was heavier today at 1.2 bln shares on the NYSE.
There was no Dominant price/volume relationship, and no 1-day oversold condition.
Broadly speaking, market breadth continues to deteriorate from the S&P’s rally off it’s 50-day moving average throughout February…
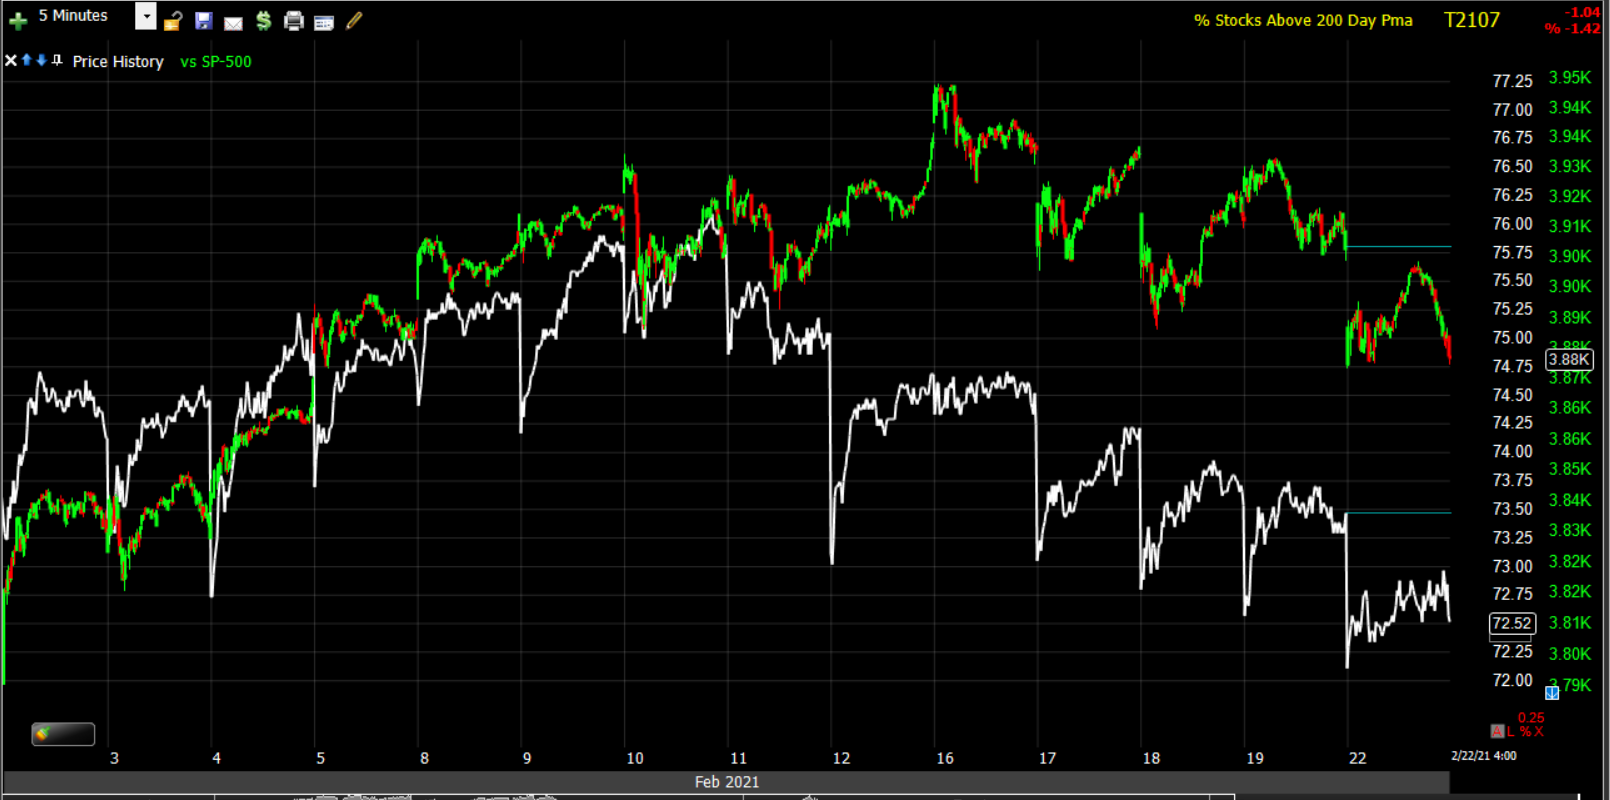 SP-500 (5m) and the percentage of NYSE stocks above their 200-day moving average (white).
However, since small Caps relative improvement toward the end of last week, market breadth has shown some slight improvement recently.
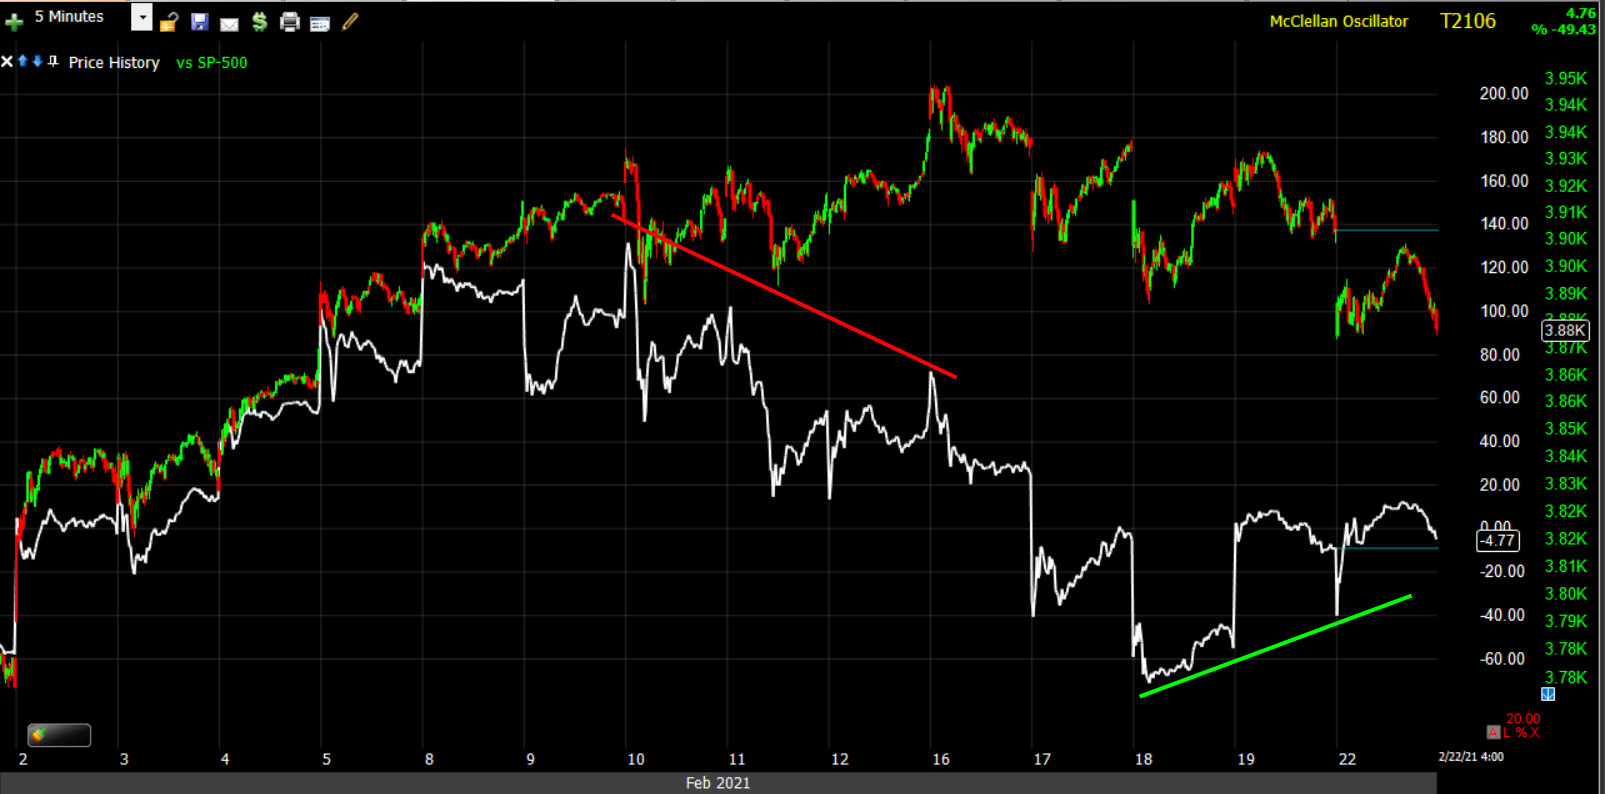 SP-500 (5m) and the McClellan Oscillator initially leading lower into the S&P’s February highs, but showing some modest improvement with small caps the last few days.
Treasuries
The 10-year yield finished the session one basis point higher at 1.36%. The Fed sensitive 2-year yield remained flat at 0.11%.
The 10-year yield started the month at 1.09%. This speedy ascent continued to undercut risk sentiment for growth stocks with elevated valuations.
Rising yields also seem to be weighing negatively on credit markets broadly speaking.
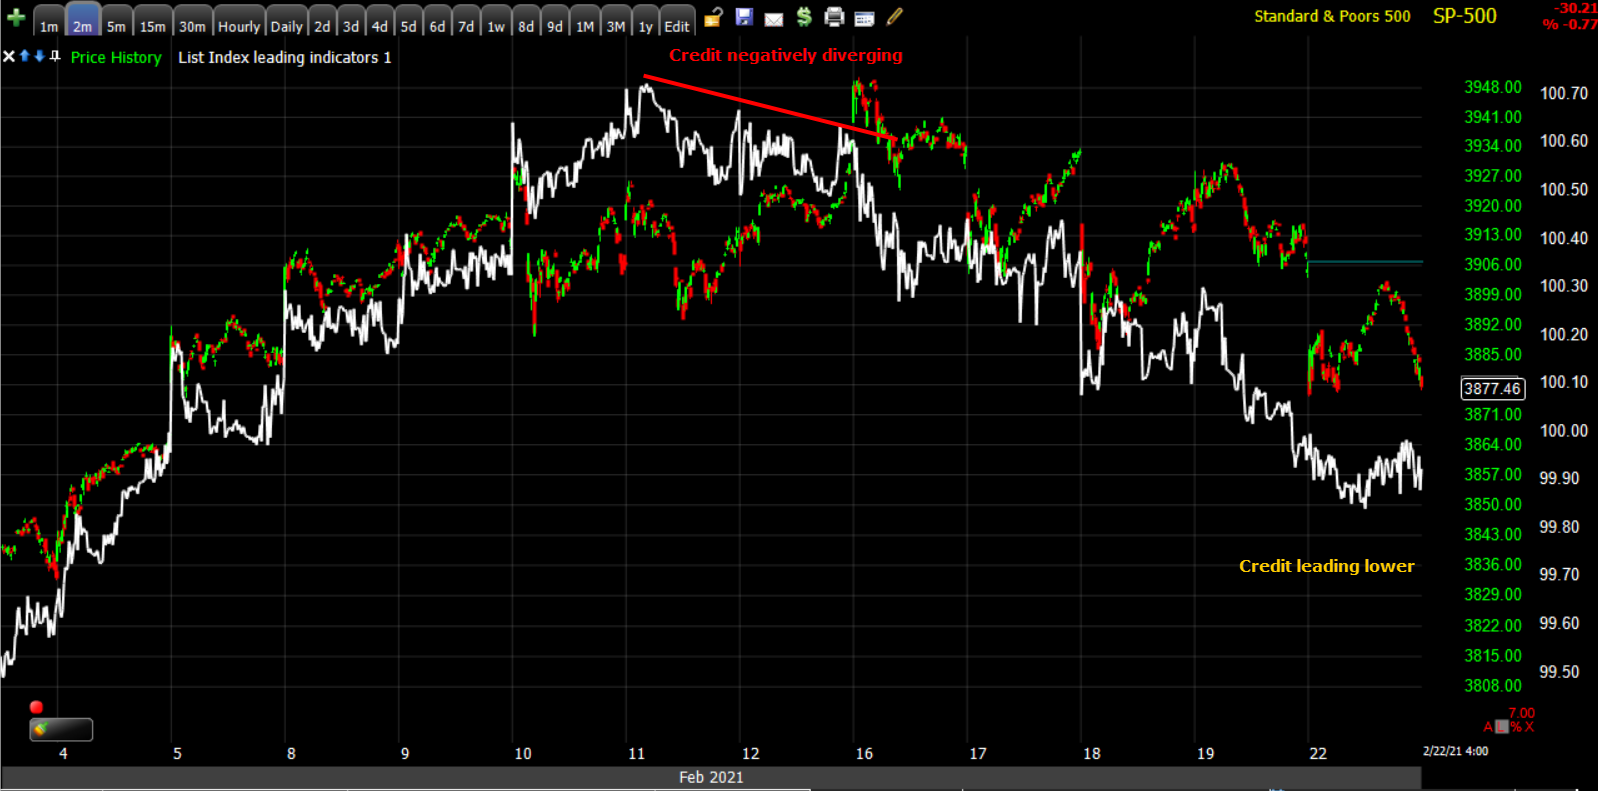 In similar fashion to growthy mega-cap stocks, credit (white) negatively diverged with the S&P at the February highs and is leading lower.
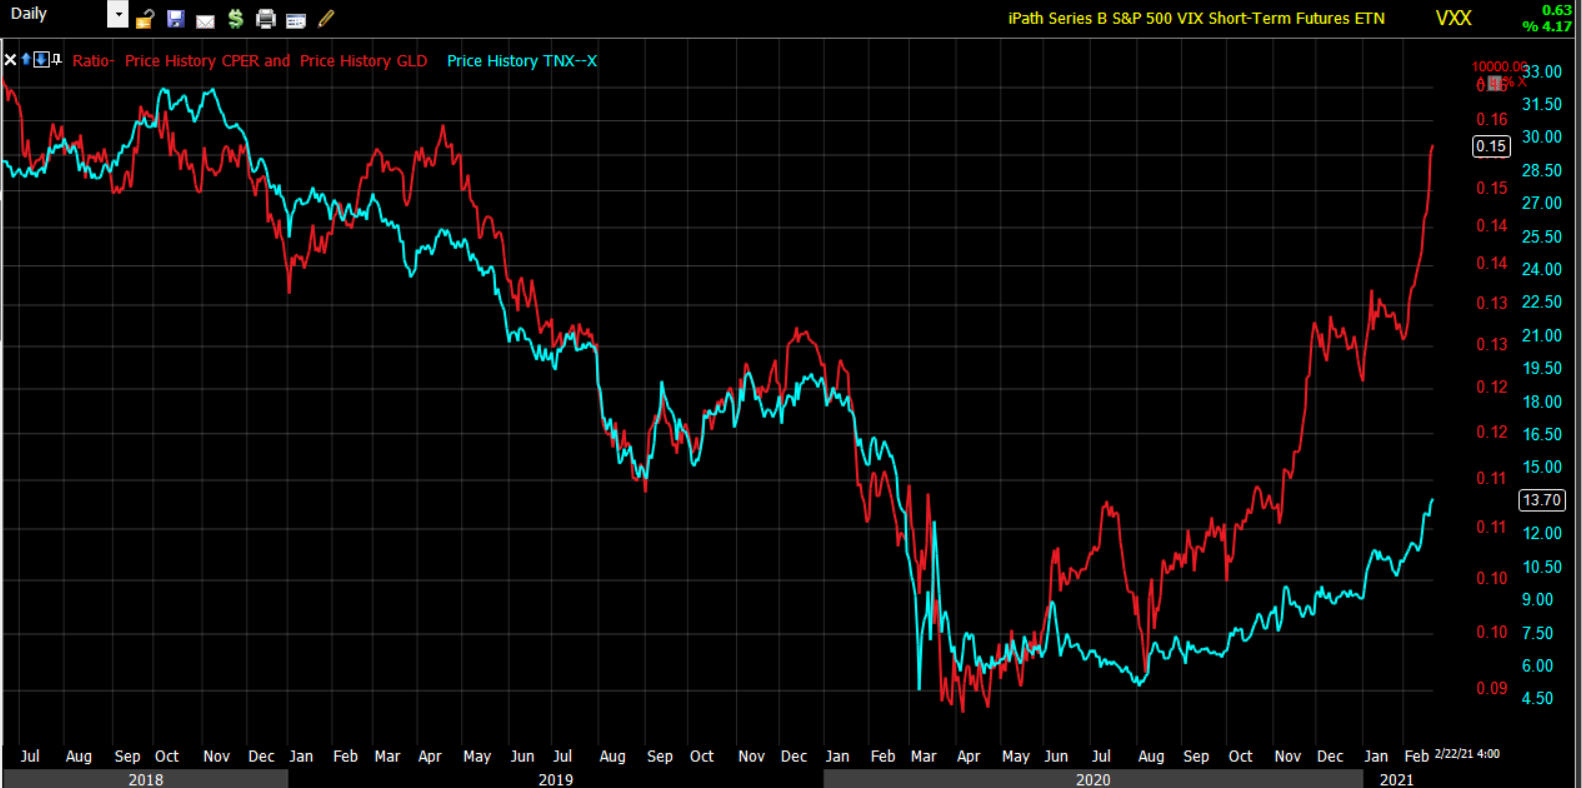 The Copper:Gold ratio in red (daily) suggests the 10-year yield could jump up to 3%. The S&P’s dividend yield is 1.5% and the 10-year 1.5% level is widely seen as the area where major downside pressure comes to bear on equity prices that have been elevated in terms of valuation due to low yields.
Money markets are also starting to price in an earlier than expected start to Fed rate hikes due to inflationary fears/pressures.
Currencies and Commodities
The U.S. Dollar Index decreased -0.3% to 90.12.
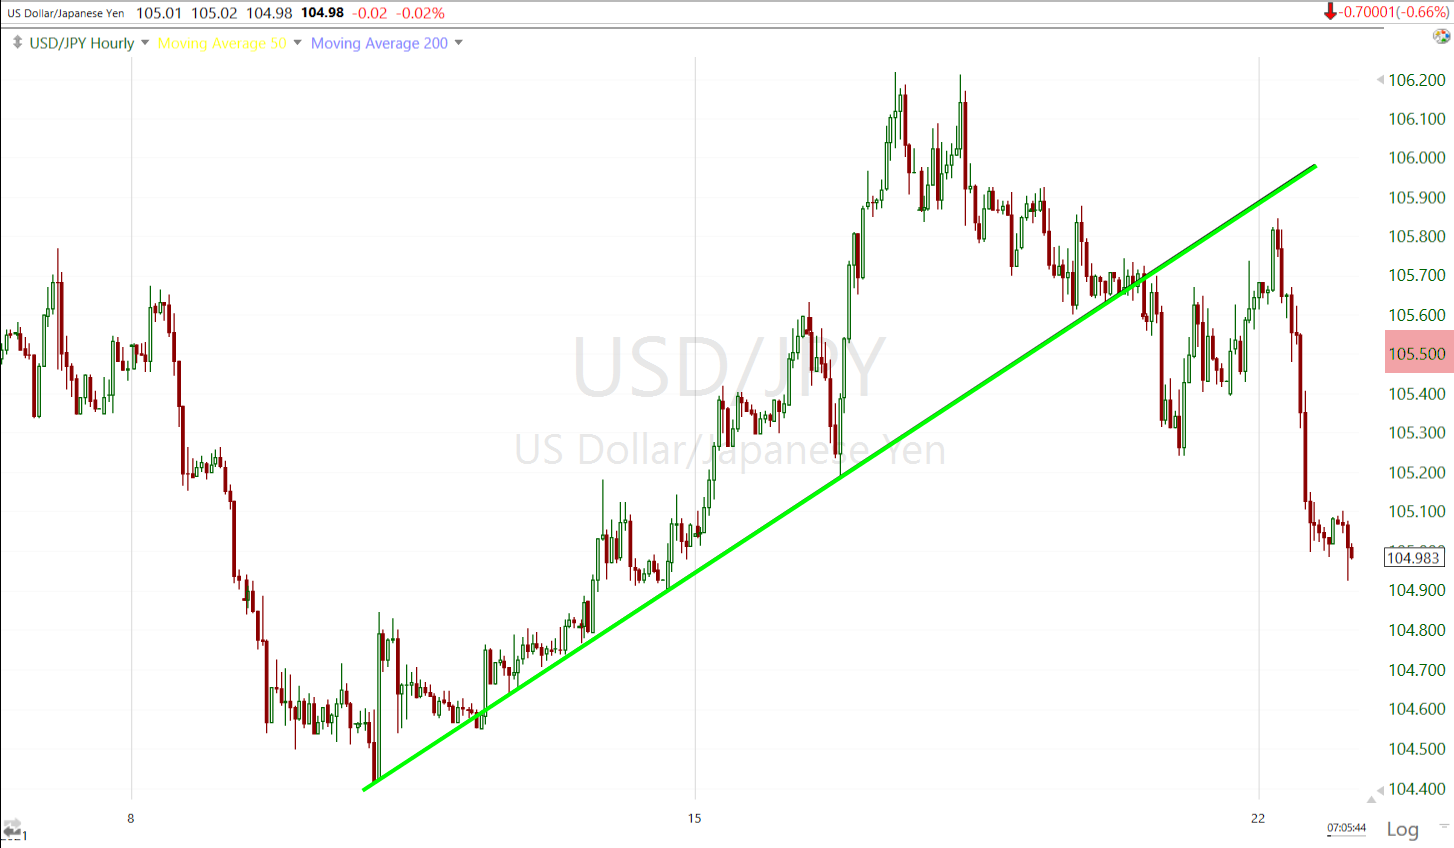 USD/JPY (60m) was looking as if it would break the last 2 week’s risk sentiment supportive up trend and it did late last week. The safe-haven Yen was bid up into the U.S. cash session today sending USD/JPY lower and below the near term risk sentiment line in the sand at $105.50
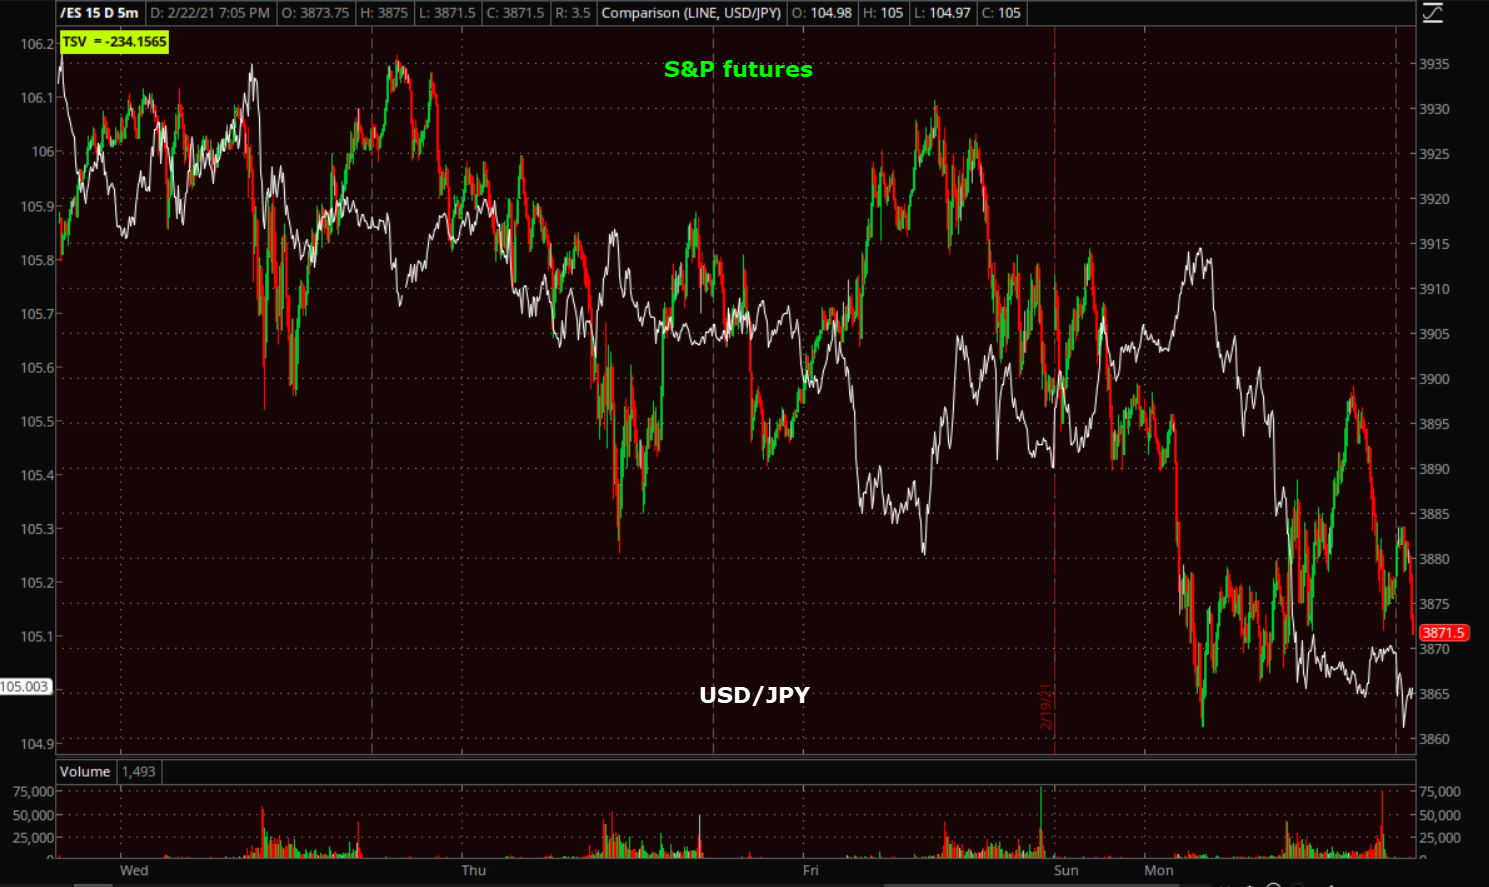 S&P futures (7m) and USD/JPY (white) turning more defensive or more risk averse.
WTI Crude oil closed up +4.5% to $61.63/bbl.
UNG/Nat Gas fell -2.06% today
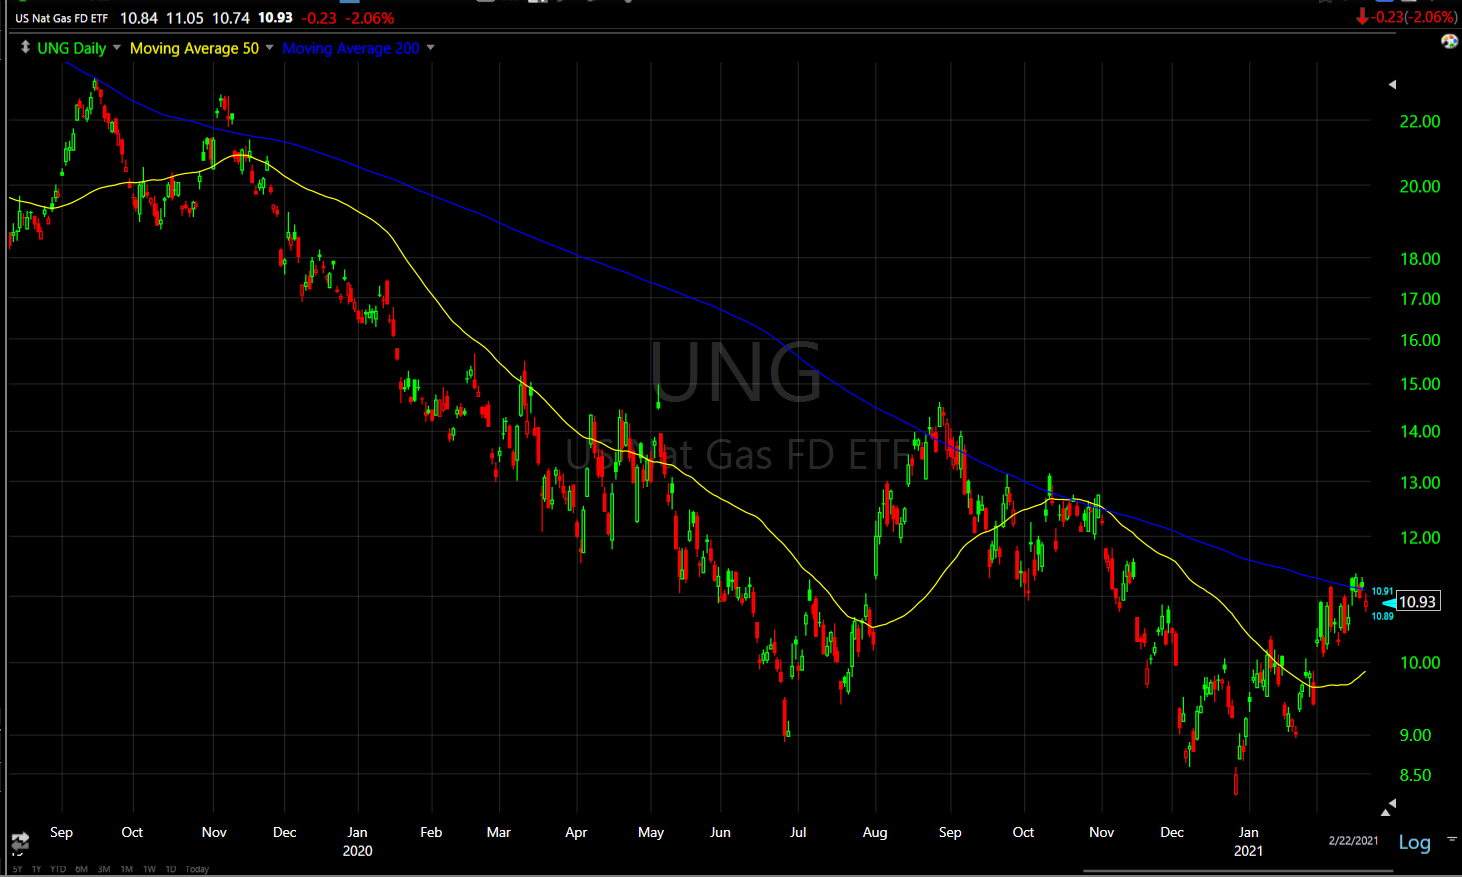 UNG (daily) I have little doubt that UNG is tangling with technical resistance at its 200-day as it briefly closed above last week and fell back below the next day. However, there has been an intermediate trend change from down to up.
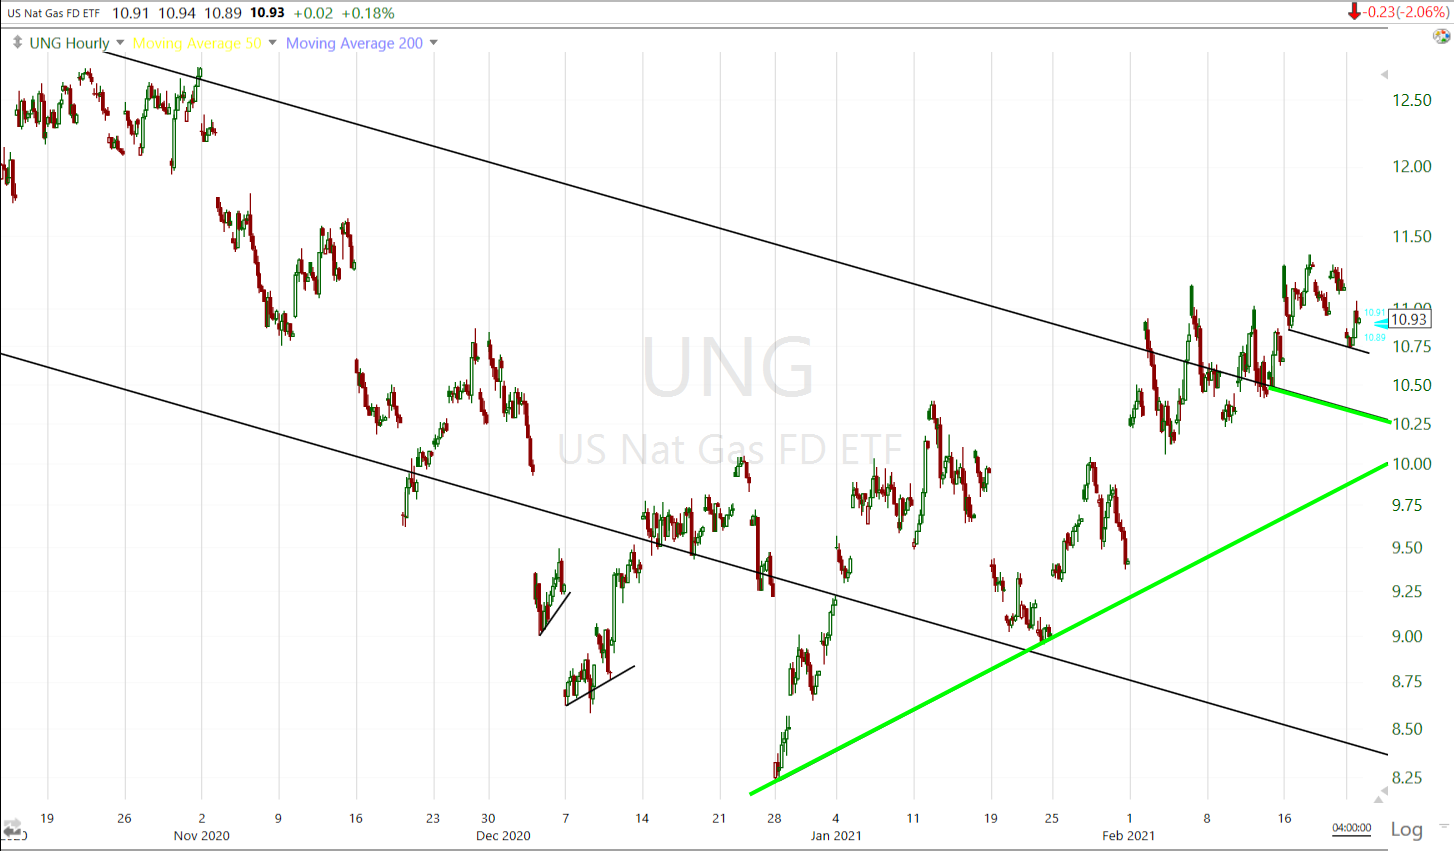 UNG (60m) if I get involved with UNG on the long side, I’d prefer it pulled back to the $$10-$10.25 area to reduce risk and make for a better risk/reward profile.
It’s not just yields that are pointing toward inflation, but commodity prices. Copper closed at its highest since 2011. The Invesco DB Commodity Index Tracking Fund (DBC) has risen nearly 33% since November when Pfizer vaccine news jump-started the reflation trade. The Invesco DB Agriculture Fund (DBA) is up more than 18% over the same period.
Gold futures gained +1.7% to $1,808.40/oz. (above $1800) as inflationary concerns served to prop up the yellow metal amid a weaker dollar, but despite rising real yields which have been a recent headwind for gold.
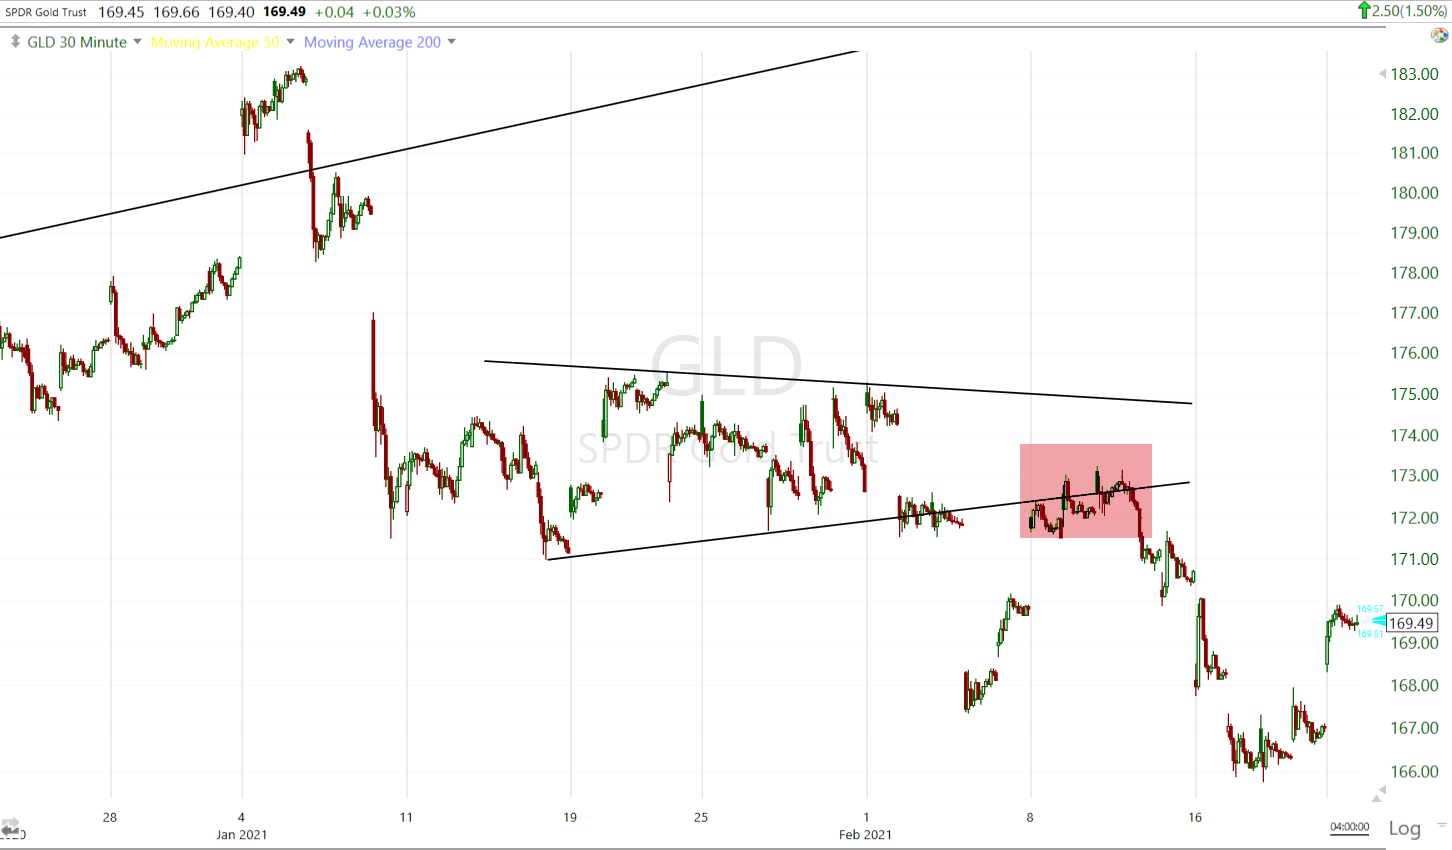 GLD (30m) up +1.5% today made some progress, but still has a ways to go to prove itself technically speaking.
The last few weeks I’ve liked Silver better than Gold and SLV gained +4% today with a fairly significant technical move.
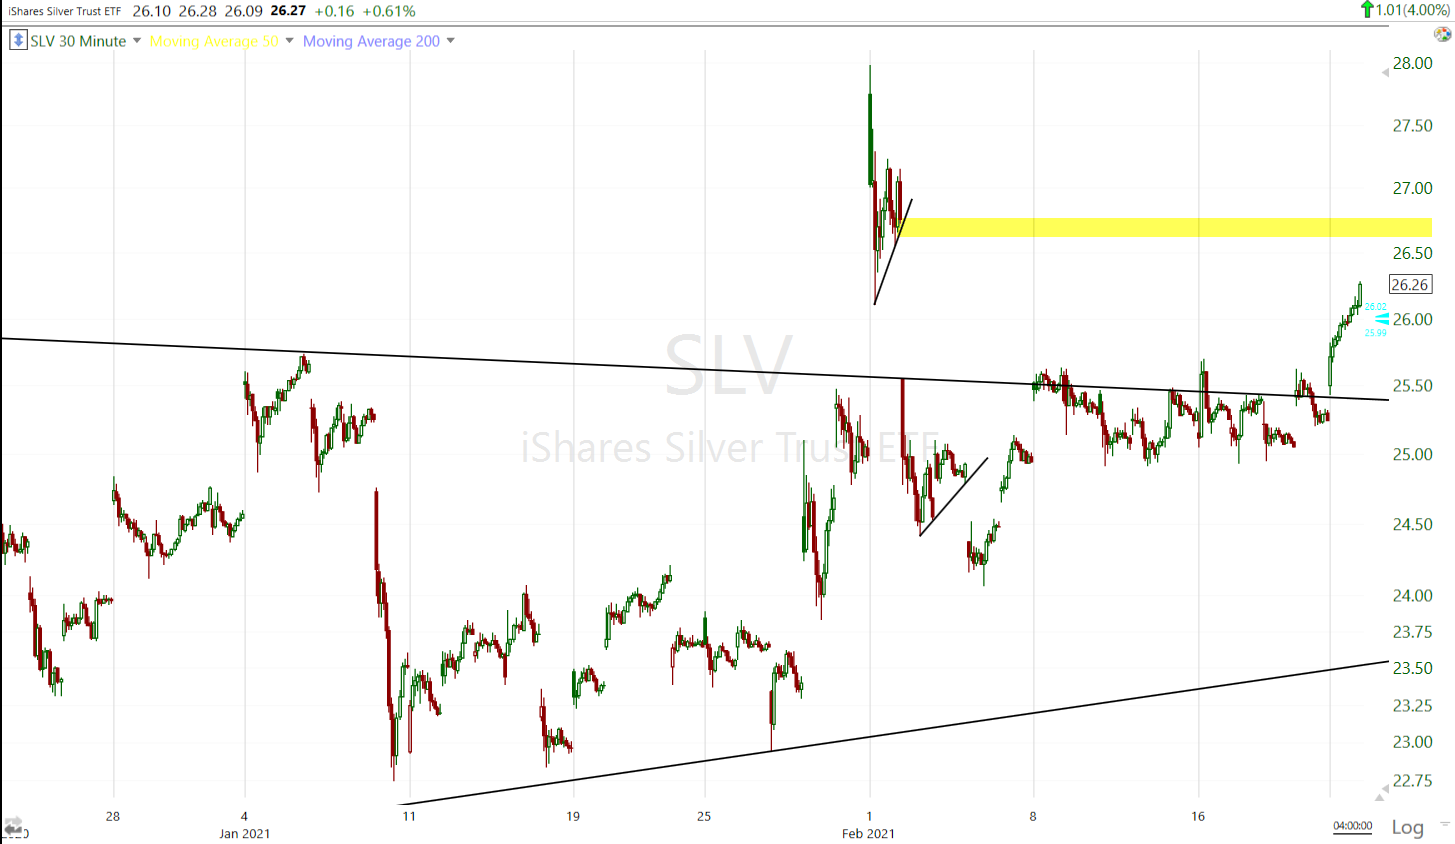 SLV (30m) breaking out above the 6+ month triangle consolidation, but it does have a big gap to fill up toward $26.75 before it clears recent overhead supply.
Bitcoin had a volatile weekend, first trading above $58,000, then falling over $10,000 below $48,000 before recovering.
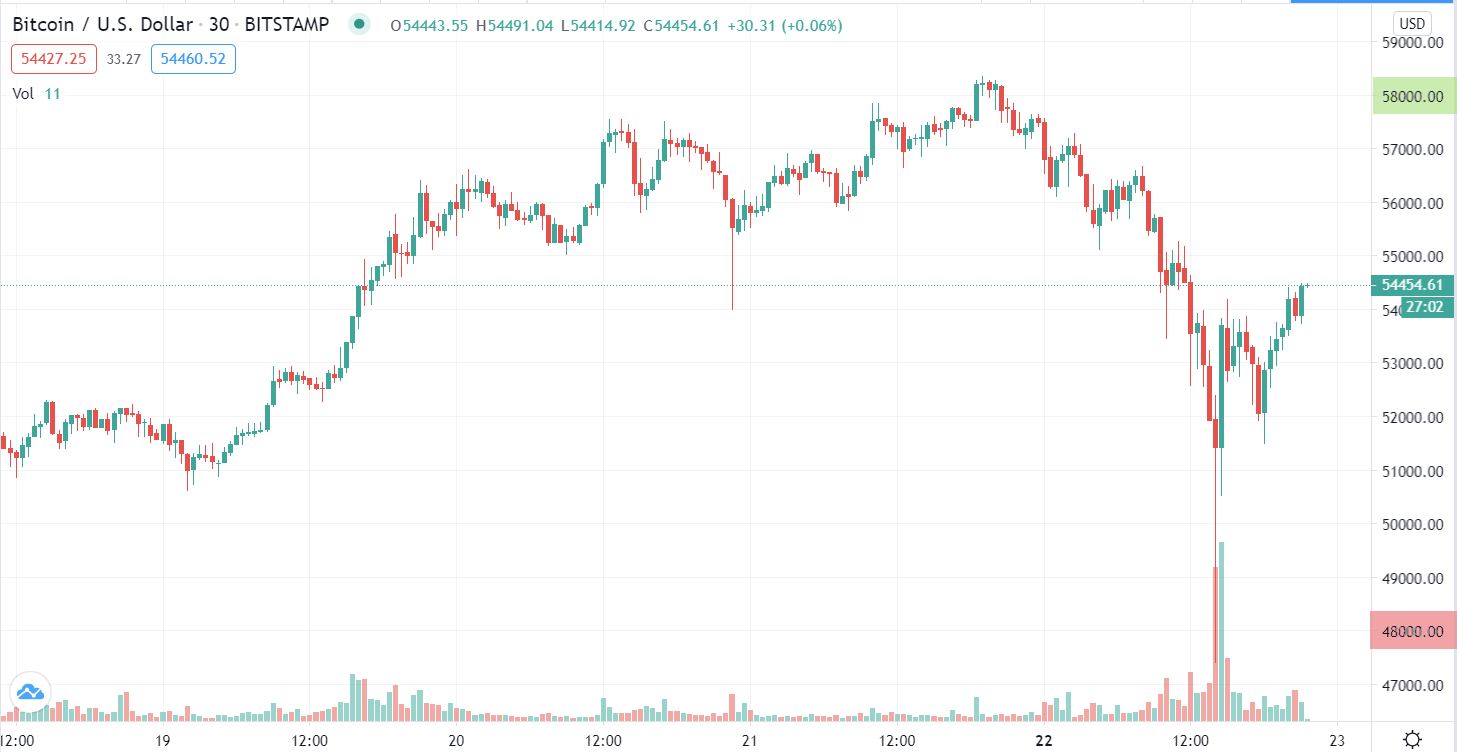 BTC/USD (30m)
While that’s exceptionally volatile in price terms, I don’t see it as anything too unusual in terms of the price trend.
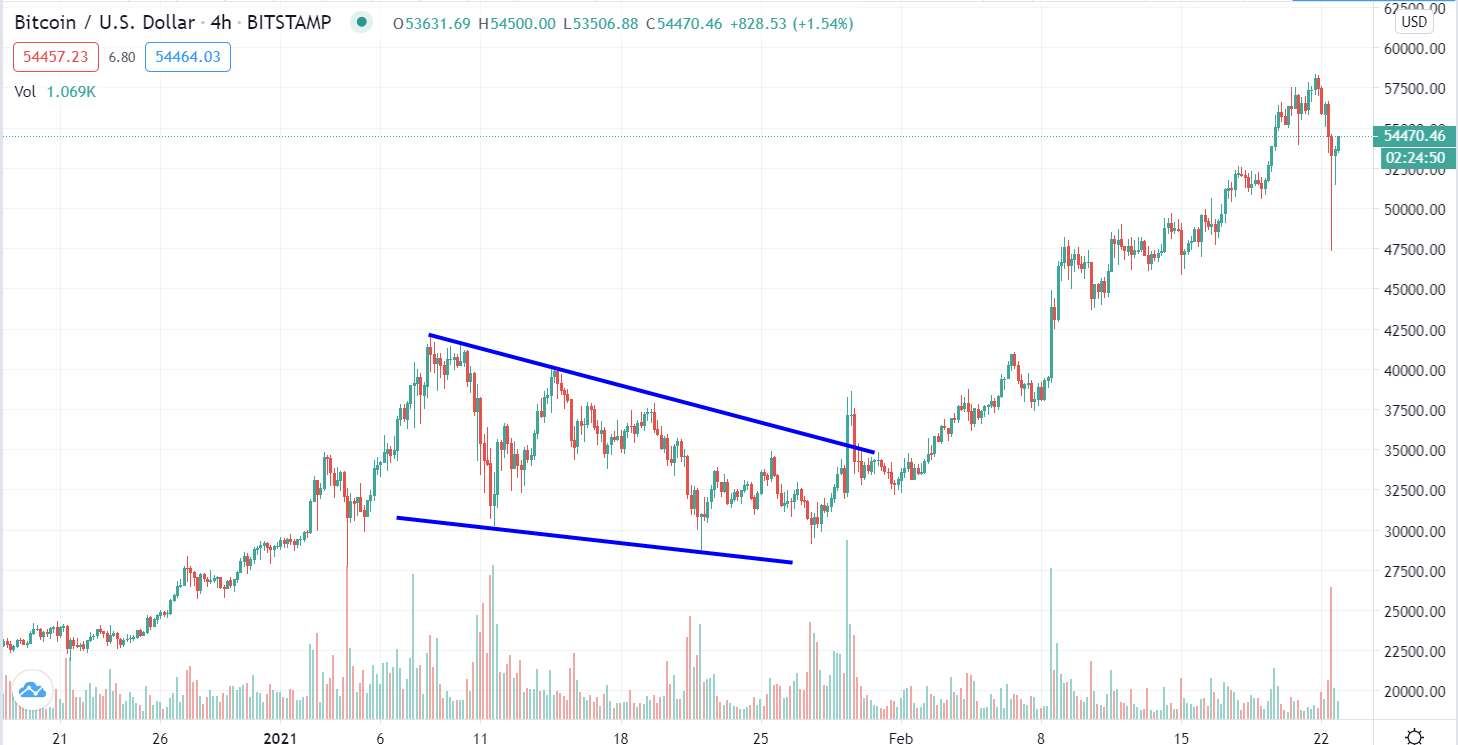 BTC/USD (4h) the 10,000 point decline is barely noticable in terms of the price trend.
As such, GBTC fell -5.64% today, and the Ethereum ETF highlighted at the start of last week, ETCG, fell -12.64%, but this wis after a 120% run last week.
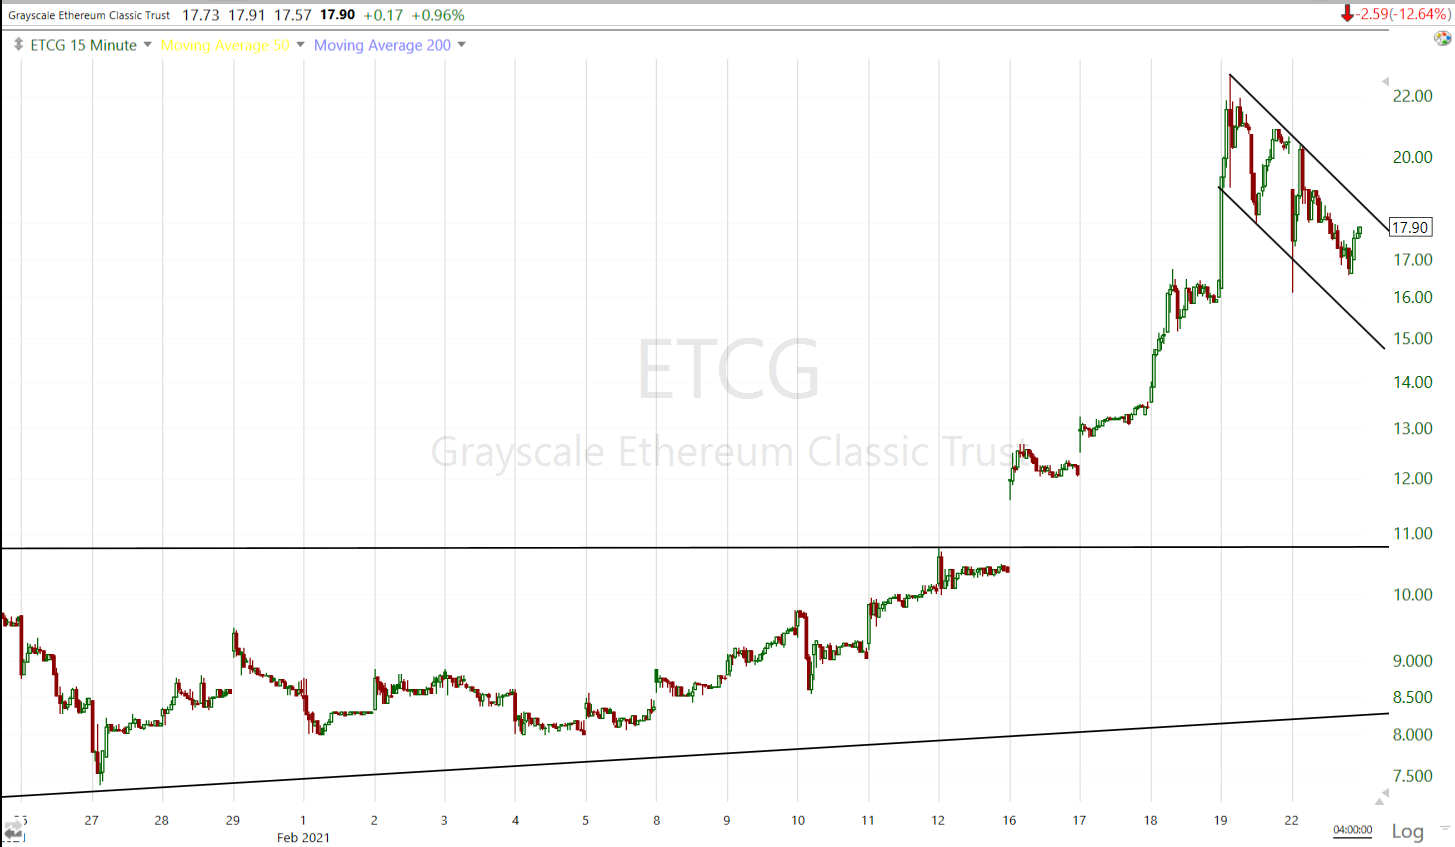 ETCG (15m)- I highlighted the chart early last week (Tuesday) and it gained nearly 90% afterward. It looks like ETCG is starting to correct in a bullish flag which may turn into a nice opportunity to buy a pull back. I’d like to see it pull back to at least $15 for a potential long entry. From a measured move perspective I think we could see another 100+% move on a second leg up after the consolidation finishes.
I already have pretty significant long exposure to Bitcoin via GBTC (up 400% since buying in June), but given the recent breakout in ETCG, I wouldn’t mind adding a little exposure there. I may reduce my GBTC exposure to keep my allocation to crypto the same.
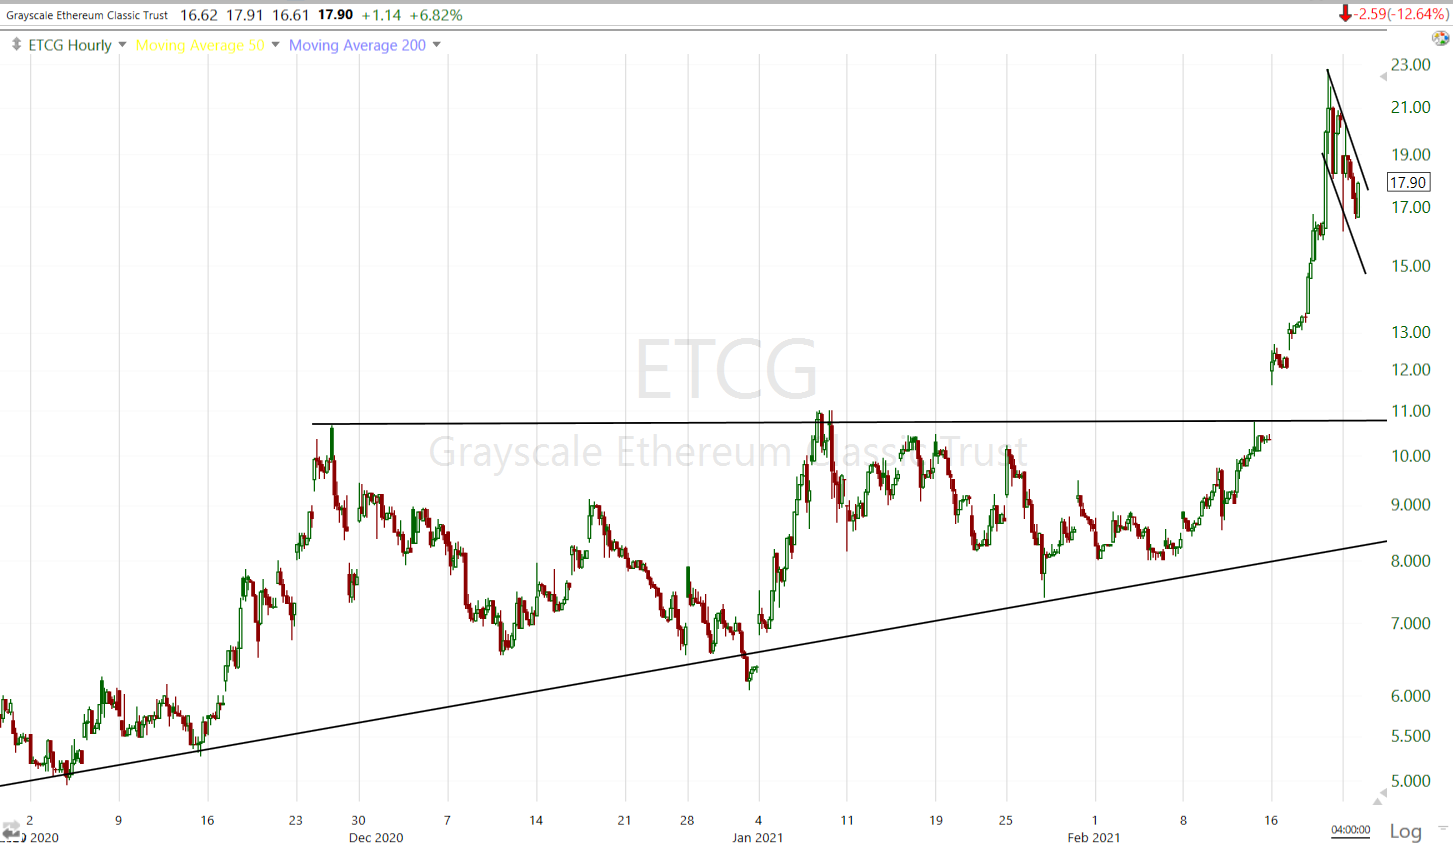 ETCG (60m) breakout from a large bullish ascending triangle last week looks like a very bullish kick-off.
Summary
This week has started carrying over the same dynamics from last week, which is higher yields – specifically the 10-year above 1.,3% – led to stock prices falling. The only difference is that last week it was a fairly broad decline affecting even cyclicals and small caps, and since Friday it has been more focussed on growth stocks like the mega-cap FANGs within Technology, Consumer discretionary and Communications sectors. It doesn’t seem likely to me that the Fed will take any action in terms of raising rates due to inflationary pressures, but investors are clearly fretting over the rapid rise in bond yields. Remember that it’s not so much the rise in bond yields that pressures equity valuations, but the rate of change. Some of you may recall the S&P sell-off that started in October of 2018 and ran through December, losing nearly 20% over the period. that was due to a sharp rise in yields after Powell suggested that rates were likely to move higher. For a decade stock valuations have become increasingly rich – by some measures the richest or most overvalued in history – but they have been justified by low rates, which is why the spike in yields is weighing on the stocks with the richest valuations (growth/Tech/mega-caps), and very recently less so on the value/cyclical sectors as evidenced by Small Caps better relative performance the past 2 days.
While we don’t have any oversold conditions depicted in internals, I think it’s likely the NASDAQ tests its 50-day moving average about 1% lower and likely bounces from there (at least a technical bounce) after 5 consecutive days down. However, this will largely depend on whether yields continue to sky-rocket higher as the Copper:Gold ratio suggests it likely.
Keep an ye on the Absolute Breadth Index. It doesn’t give long volatility signals very often, but has already posted 2 in 2021, and both saw VIX make significant moves up afterward. At the pace it has fallen over the last week, I wouldn’t be surprised if it moves into extreme low territory signifying the likelihood of a double digit percentage move in VIX over the next month.
Crypto-currencies are a bit volatile on a day-to-day basis, but within their trends it’s nothing I’m concerned about and I think it may even offer a nice long or add-to opportunity. Bitcoin has a finite supply, unlike the never-ending Fed printing of the U.S. Dollar, and I suspect that’s why they’ve seen such spectacular gains in crypto as the Fed floods the system with liquidity.
Overnight
Japan’s markets are closed for a holiday. S&P futures are little changed, down -0.05%, but ES’s 3C has been fairly weak today.
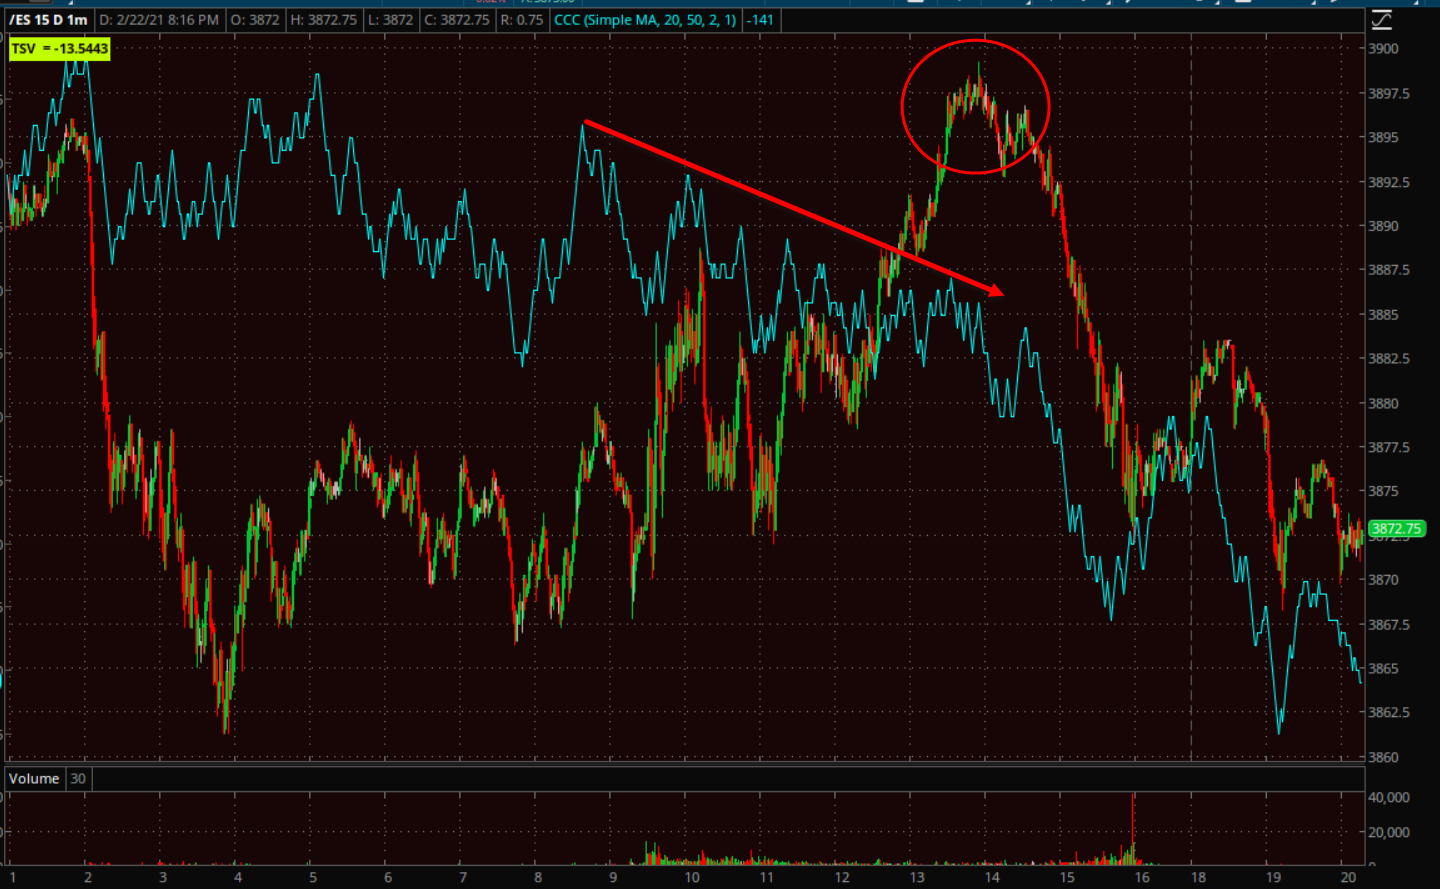 S&P futures (1m) 3C negatively divergent at the morning highs.
Conversely – and not surprisingly given the recent trend (2 weeks) – VIX futures have a more positive 3C tone.
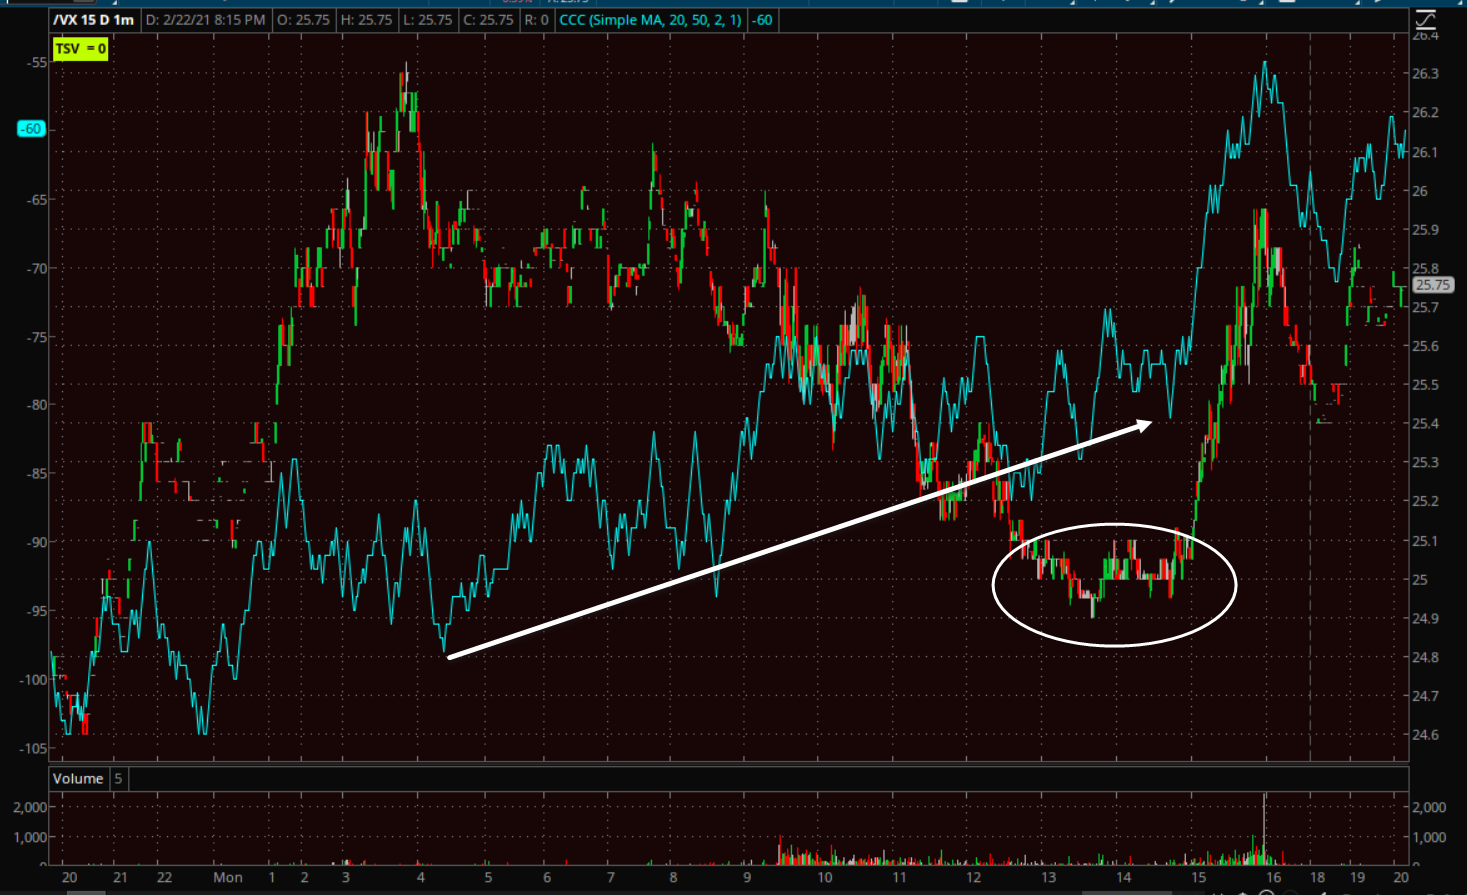 VIX futures (1m) positively divergent at afternoon lows.
Looking ahead, investors will receive the Conference Board’s Consumer Confidence Index for February, the FHFA Housing Price Index for February, and the S&P Case-Shiller Home Price Index for December on Tuesday.