
Stock Market Update
Afternoon Update
OK. So since last Thursday, November 5th’s sell-off, my view was short-term oversold and that the market would move into a consolidation/correction phase. As the week’s started and developed, my view has been that this consolidation/correction would probably run right into a key earnings report for the AI trade, Nvidia. Despite all of the craziness surrounding Nvidia this week, guess what? The market has continued along that consolidation/correction path.
That amounts to a back-test of broken neckline level areas we’ve seen developing since the summer. It’s VERY common for such a key level to be back-tested after an initial break, especially as oversold as that first decline was on November 5th, and with Nvidia earnings coming up – and a potential restart to the war in some fashion.
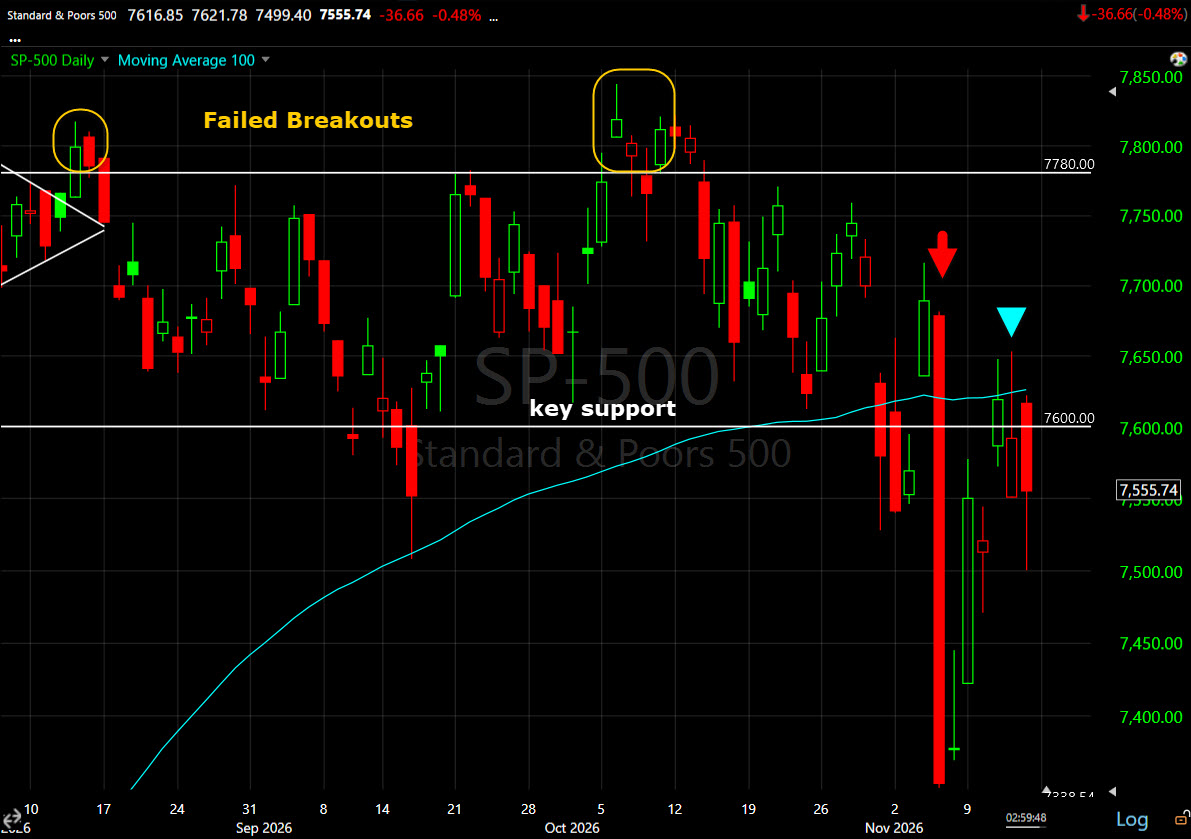 SPX (daily) doing exactly that near the $7600 area/neck line area.
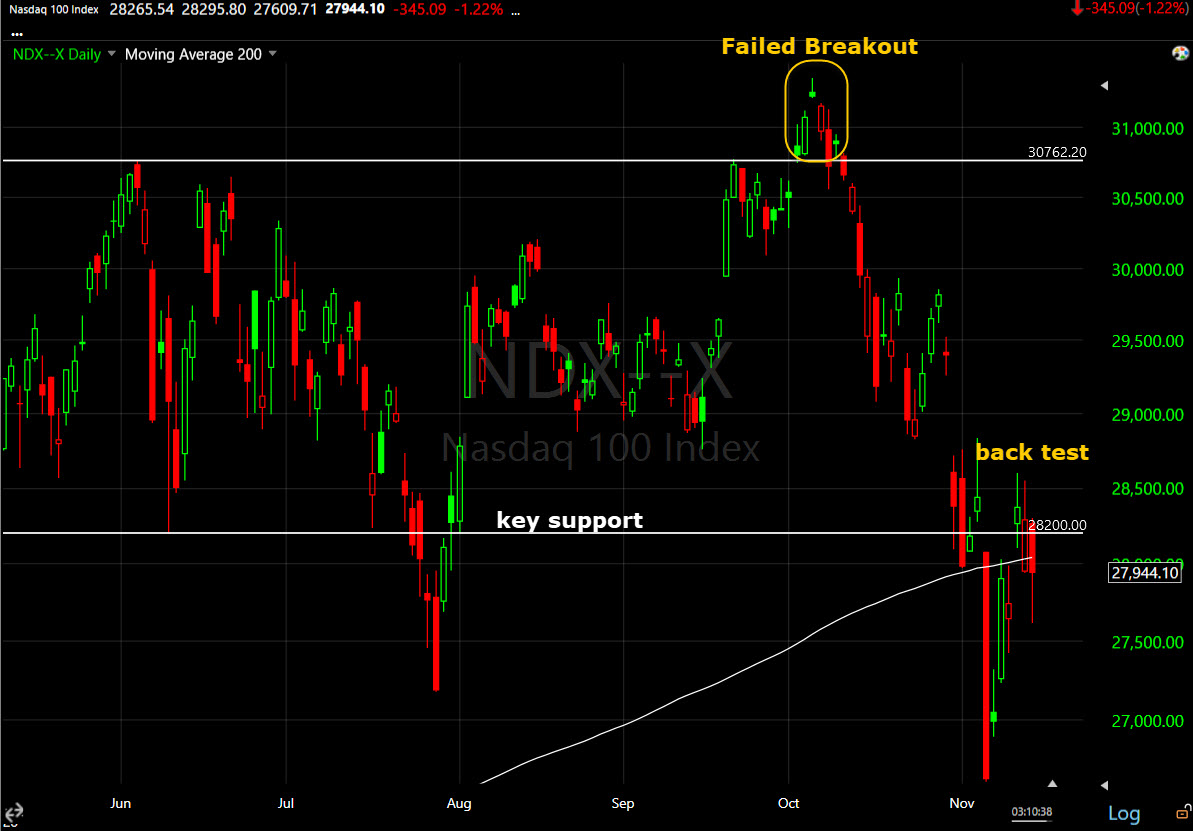 The NDX doing the same near the $28,200 area I’ve had drawn on the chart for months, though the NDX did make a lower-low, creating a Broadening Top situation.
In the last day or two, we’ve seen a change in character in that consolidation/correction phase that started last Friday. Here’s an intraday chart of the SPX just to help flesh it out.
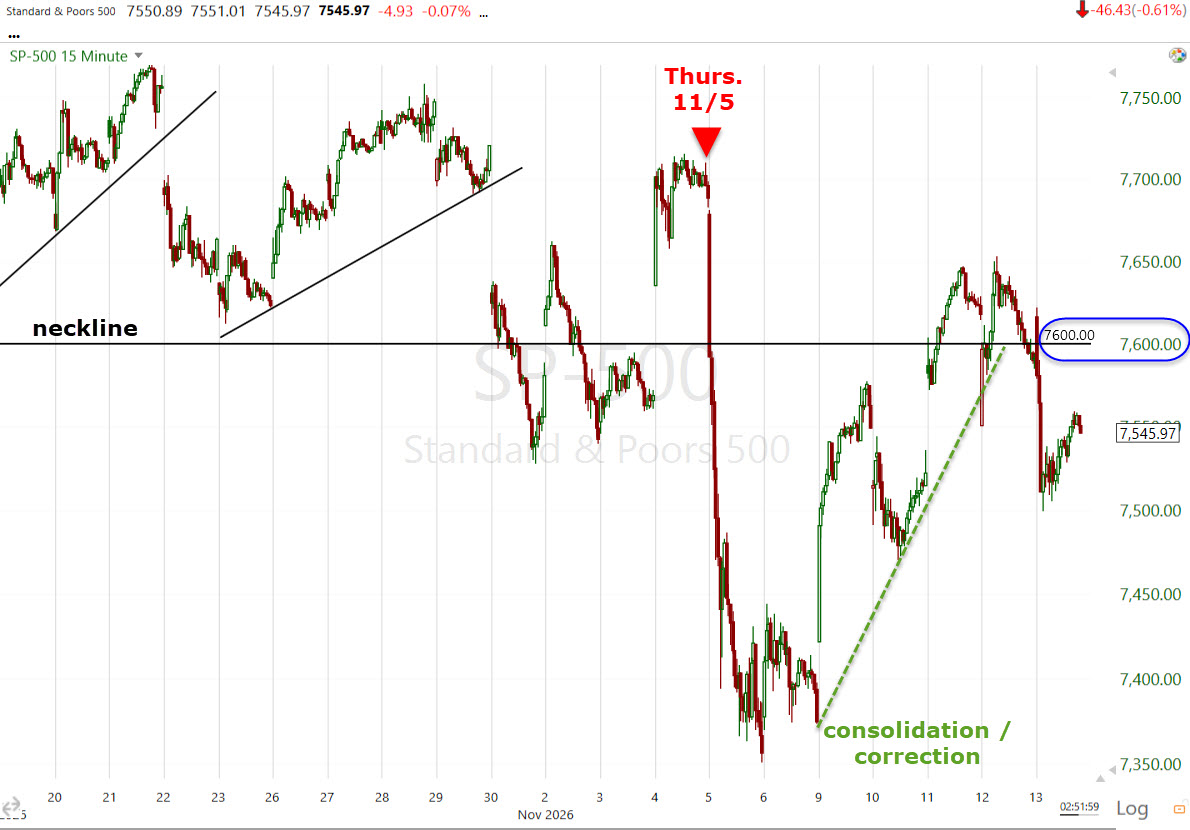 SPX (15m) Left to Right: two minor bear flags, the Thursday, November 5th correlation-one sell-off, and the week-long consolidation/correction phase that back tests the key $7600 level (and the 100-day SMA).
You might be able to see the very recent change in character (occurring with yesterday’s 3C charts turning a bit more sour) on S&P futures below…
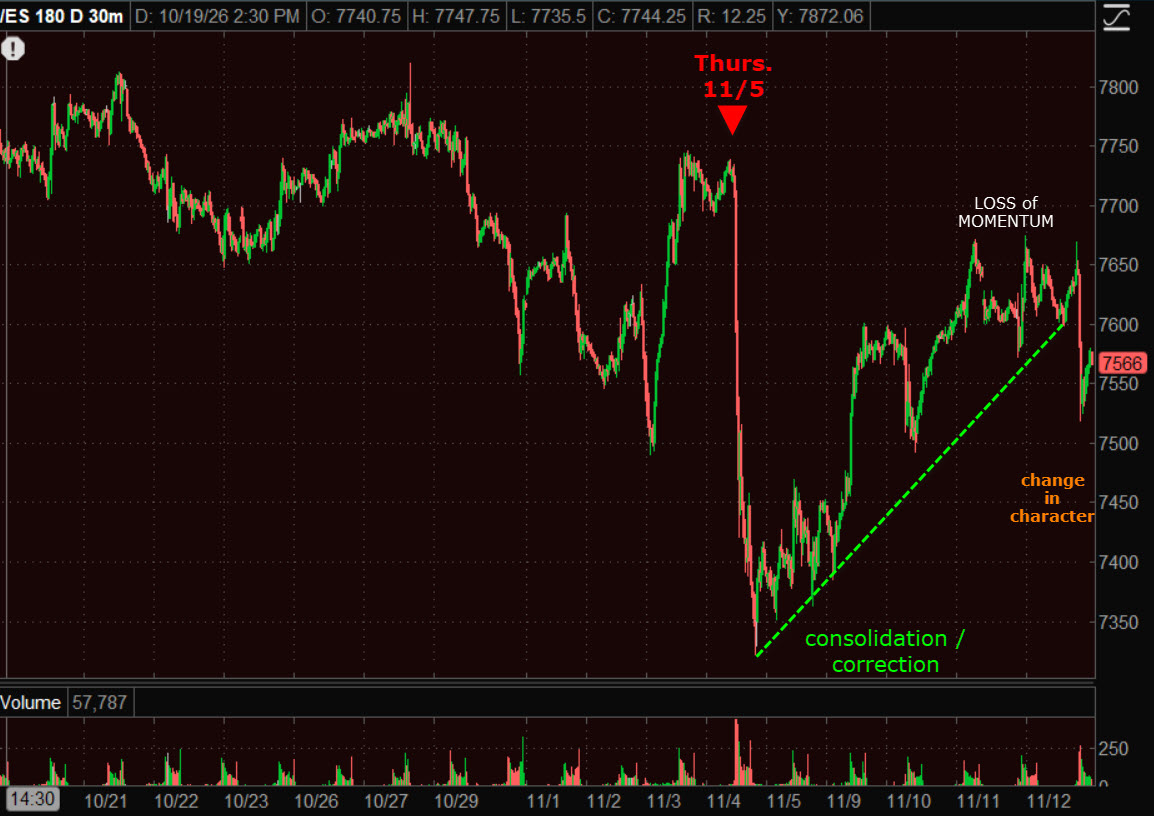 (30M) I have some key events marked, but pay attention to price action’s rebound to back test former support. notice the loss in price momentum the last couple of days and a more sideways trend in price since this correction began (labelled in white). Then, today’s really noticeable change in character – a break of the consolidative/corrective trend (labelled in orange).
As I always say, “Changes in character precede changes in trends.” If you are watching close enough, the market almost always gives you a warning before something big changes.
At last look of 3C charts (and these can change quickly near the close, but I think it’s good), here’s 3C reflecting the intraday consolidation covered in the last post.
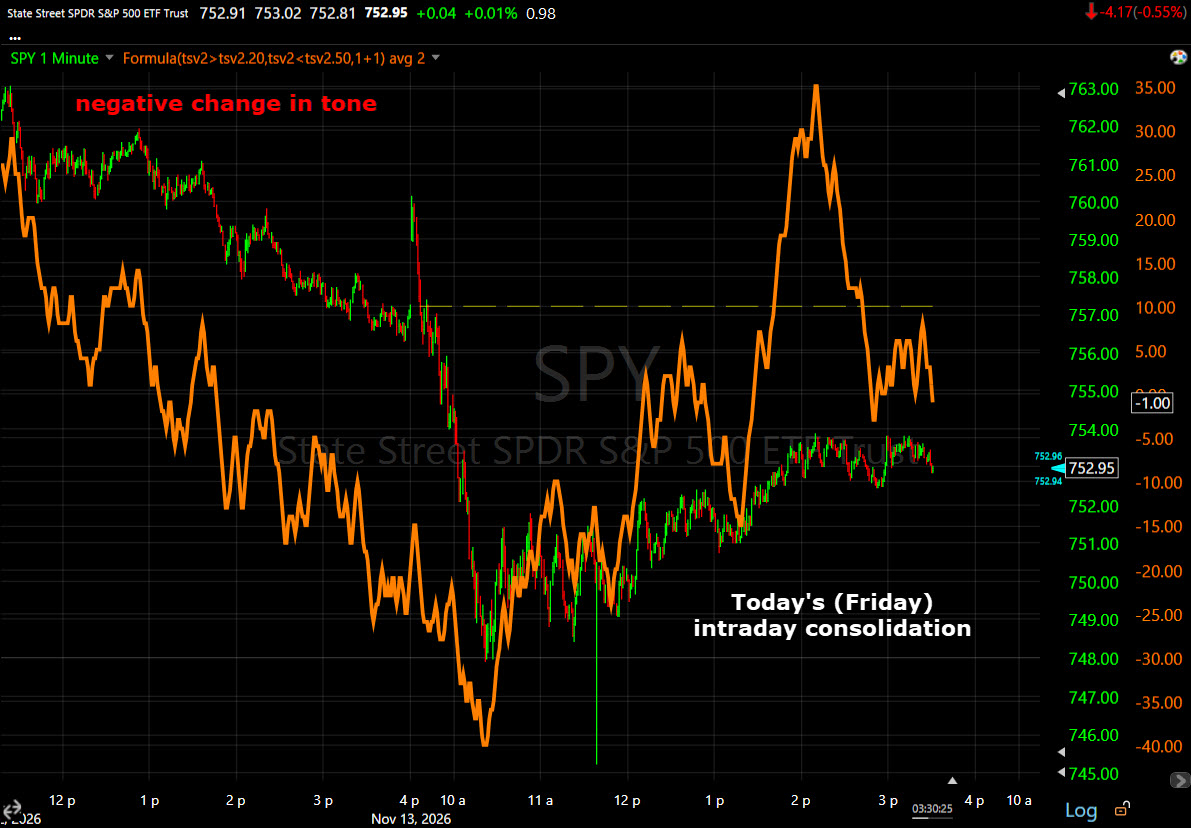 SPY (1M) – so far, so good. This consolidation probably runs into Nvidia’s earnings next Tuesday. I’m guessing we’ll get some surprise on the CEO announcement front.
Keeping things simple as there’s enough complications floating around, let’s look at the stronger 3C timeframe – the real change in character for this correction/consolidation phase.
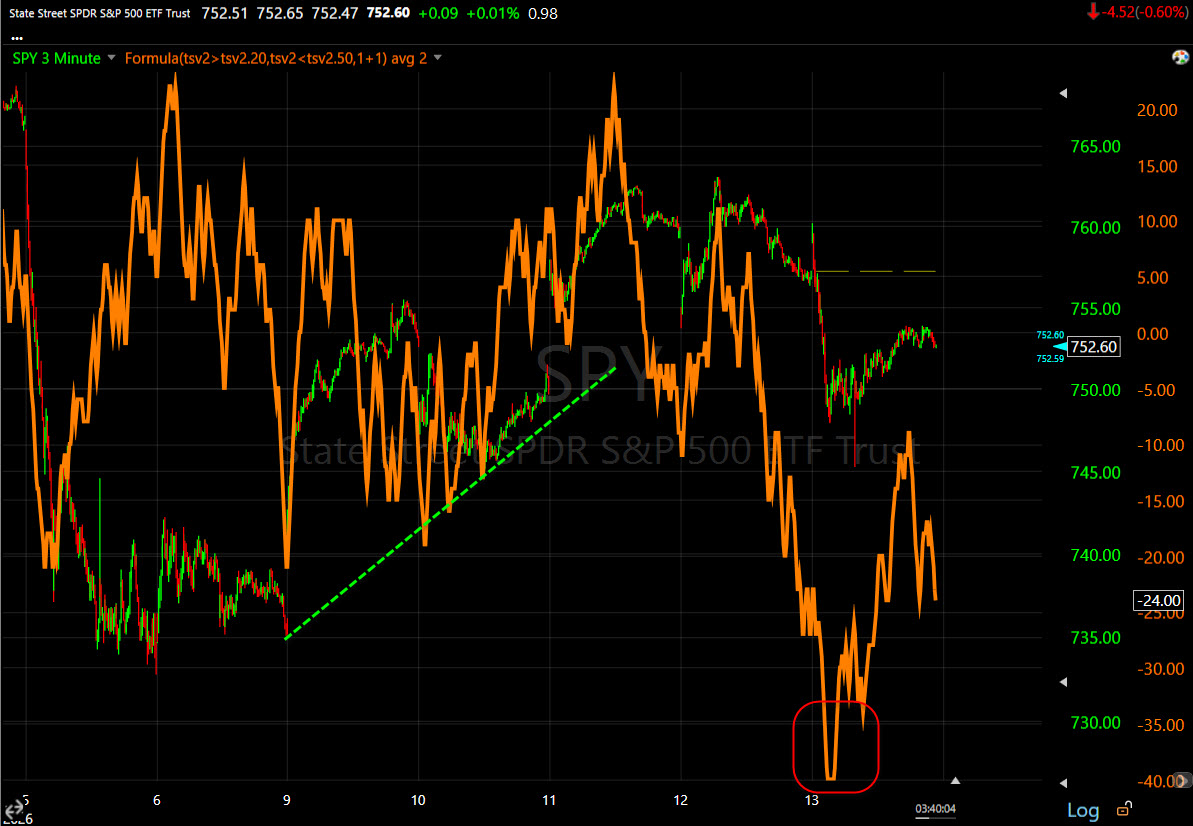 SPY (3M) the correction/consolidation is along the green dashed line. Note 3C going from confirming, to leading negatively divergent at a new lower low for 3C. That’s the change in character I highlighted yesterday in key areas of the market – SPX, NDX, SOX.
As for Semis…
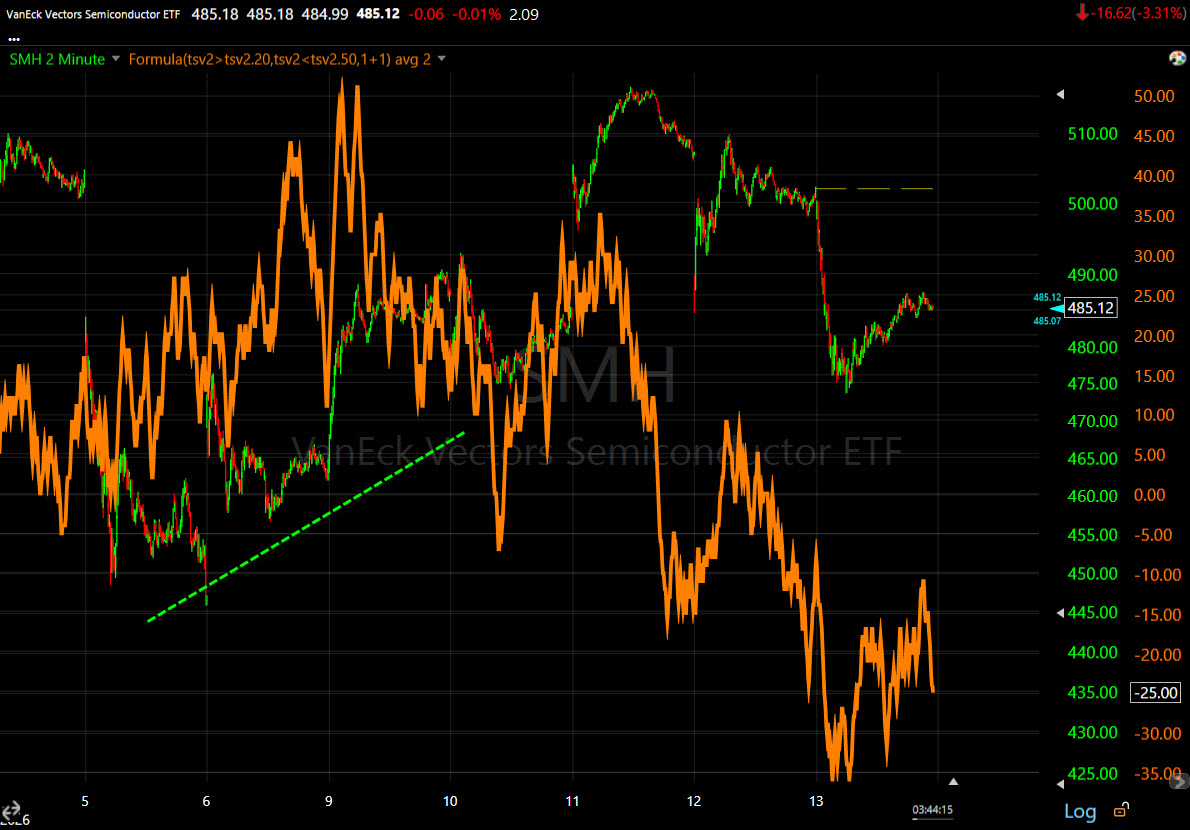 SMH (2M) – this more detialed 3C timeframe shows the bunce/correctionm and a negative changein charcter.
As for the longer/stronger trend timeframes…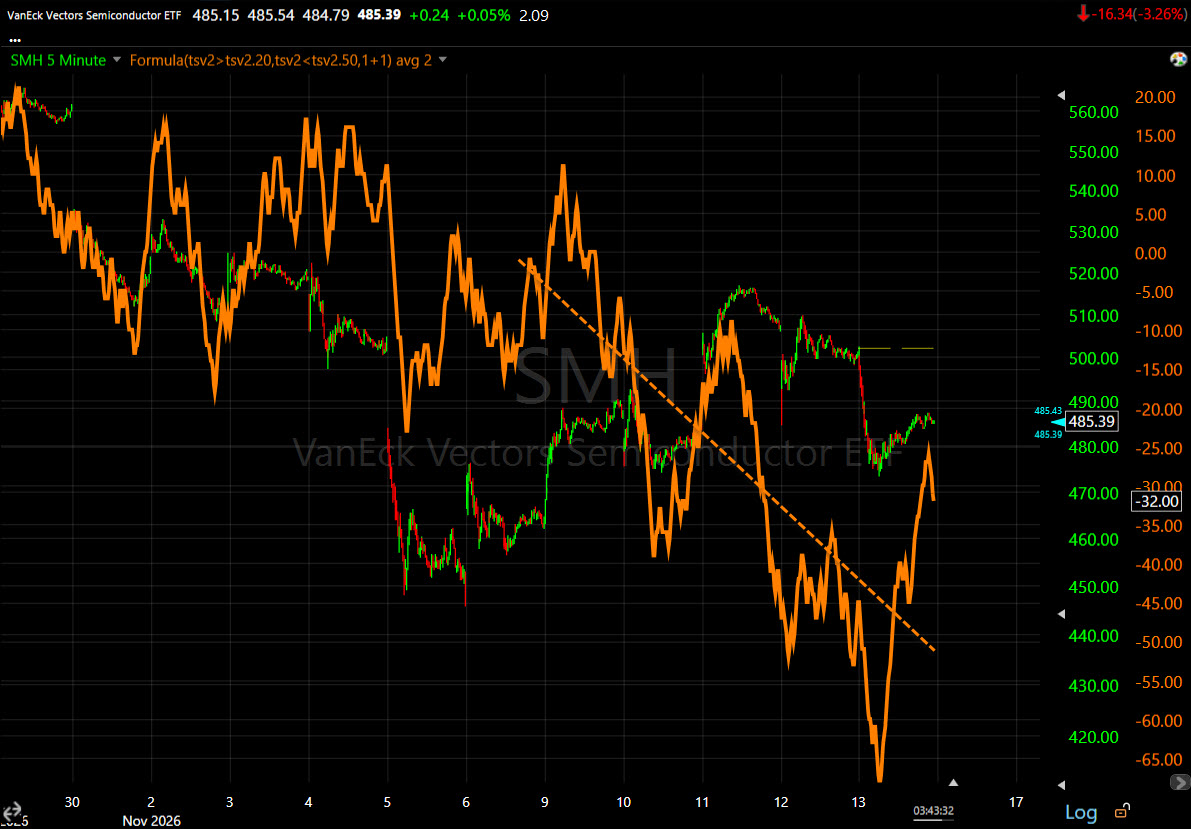 SMH (5M) It’s as if the bounce didn’t happen at all as 3C trends lower to a lower low, depicting weaker buying on the bounce and heavier selling into gains as seen on the chart just above this one.
My views from the last post are unchanged. The market could consolidate into and back test the same levels we’ve seen this week, though I suspect that may not even be as strong, as we await NVDA’s earnings, which I’m sure will have some sort of surprise (new CEO?)
In short, with other warning signs like VVIX relative strength, new ABI signals, it seems the big picture since the summer that ultimately ends with the tops breaking and trading much lower, is well underway. We’re at the “top” just broke stage.