Stock Market Wrap – January 22, 2020
Index futures’ gains before the open were said to be due to better-than-expected existing home sales for December, 2) an assertion from JPMorgan Chase CEO Jamie Dimon that high stock prices are justified by the growing economy, and 3) actions taken by China to control the coronavirus. President Trump also mentioned a plan to cut middle income taxes to be released in approximately 3 months just in time for the 2020 elections.
The early tone was a bit different than yesterday’s defensive, risk averse environment. Index futures were optimistic, but assets that reflect macro conditions (commodities in this case) were on the ugly side. Stocks started the day optimistically focused earnings, but commodities appeared to be more focused on economics.
The averages put in an intraday high/pivot fairly early this morning. In fact by the first post of the cash session, the Early Update.
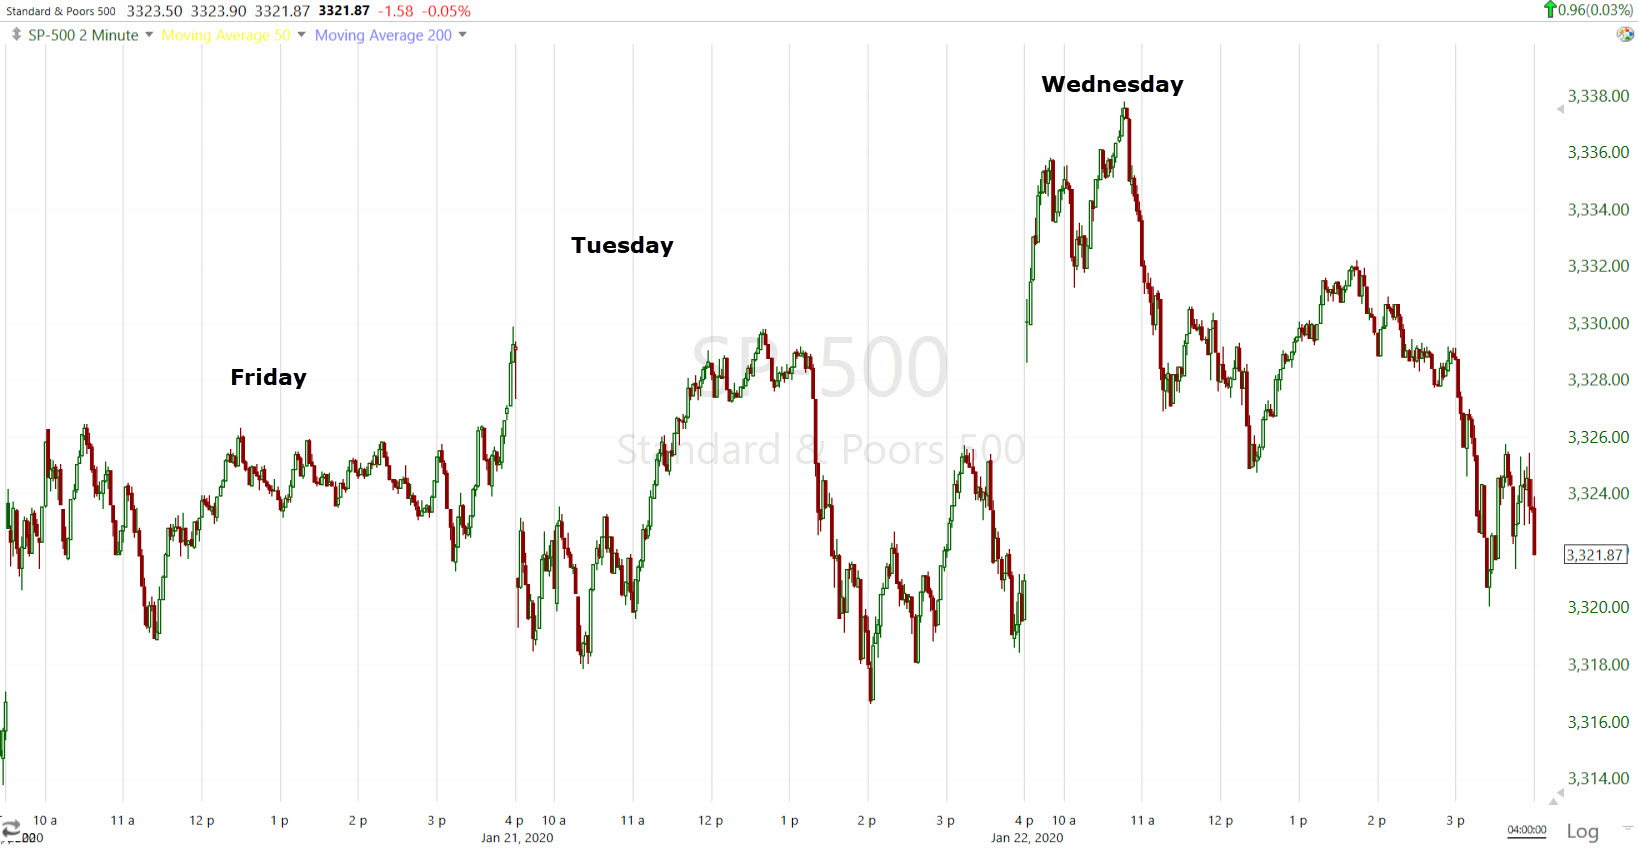
SP-500 (2m) since Friday the price range has expended to 0.6%, but the trend is flat. I would not consider this a bullish consolidation since the price range is expanding rather than narrowing. Note the high of the day was put in shortly after the open.
IBM (IBM +3.4%) led the Technology sector, and the Technology sector supported the 3 major averages, but pulled back after a slight negative change in character on 3C charts this afternoon. IBM beat earnings estimates and issued upside FY20 EPS guidance. Also Apple (AAPL +0.4%) and the semiconductor space supported Technology. Bloomberg reported that Apple will begin producing low-cost iPhones next month and asked Taiwan Semi (TSM +0.2%) to increase its chip supply.
Existing home sales came in better-than-expected, increasing 3.6% m/m in December to a seasonally adjusted annual rate of 5.54 million units (consensus 5.42 million) from 5.35 million in November. Total sales were up 10.8% year-over-year.
The Chicago Fed’s National Activity Index dropped sharply from +0.41 to -0.35 in November (drastically worse than the +0.13 expectation). A reading below 0 indicates below-trend growth in national economy.
Averages
The major averages were essentially unchanged with NASDAQ 100 showing slight relative strength, and small caps slight relative weakness.
S&P 500 ⇧ 0.03 %
NASDAQ ⇧ 0.24 %
DOW JONES ⇩ -0.03 %
RUSSELL 2000 ⇩ -0.09 %
The daily charts of S&P and Small Caps give a little more perspective for the last 3 days.
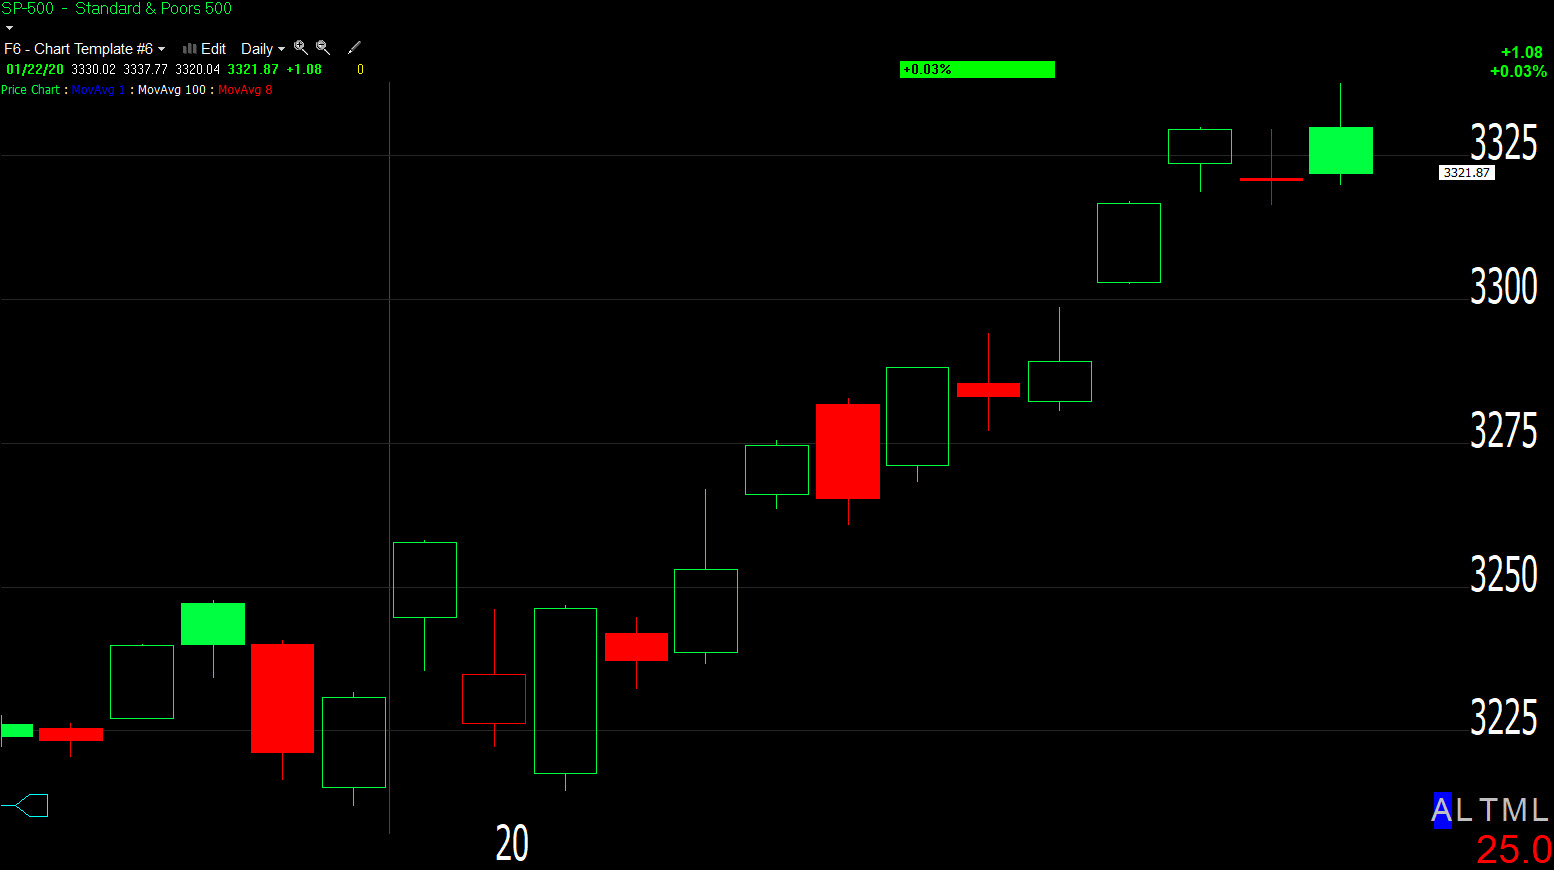 SP-500 (daily) is essentially unchanged since Friday with fairly small price candles since Friday indicative of a loss of upside momentum or consolidation.
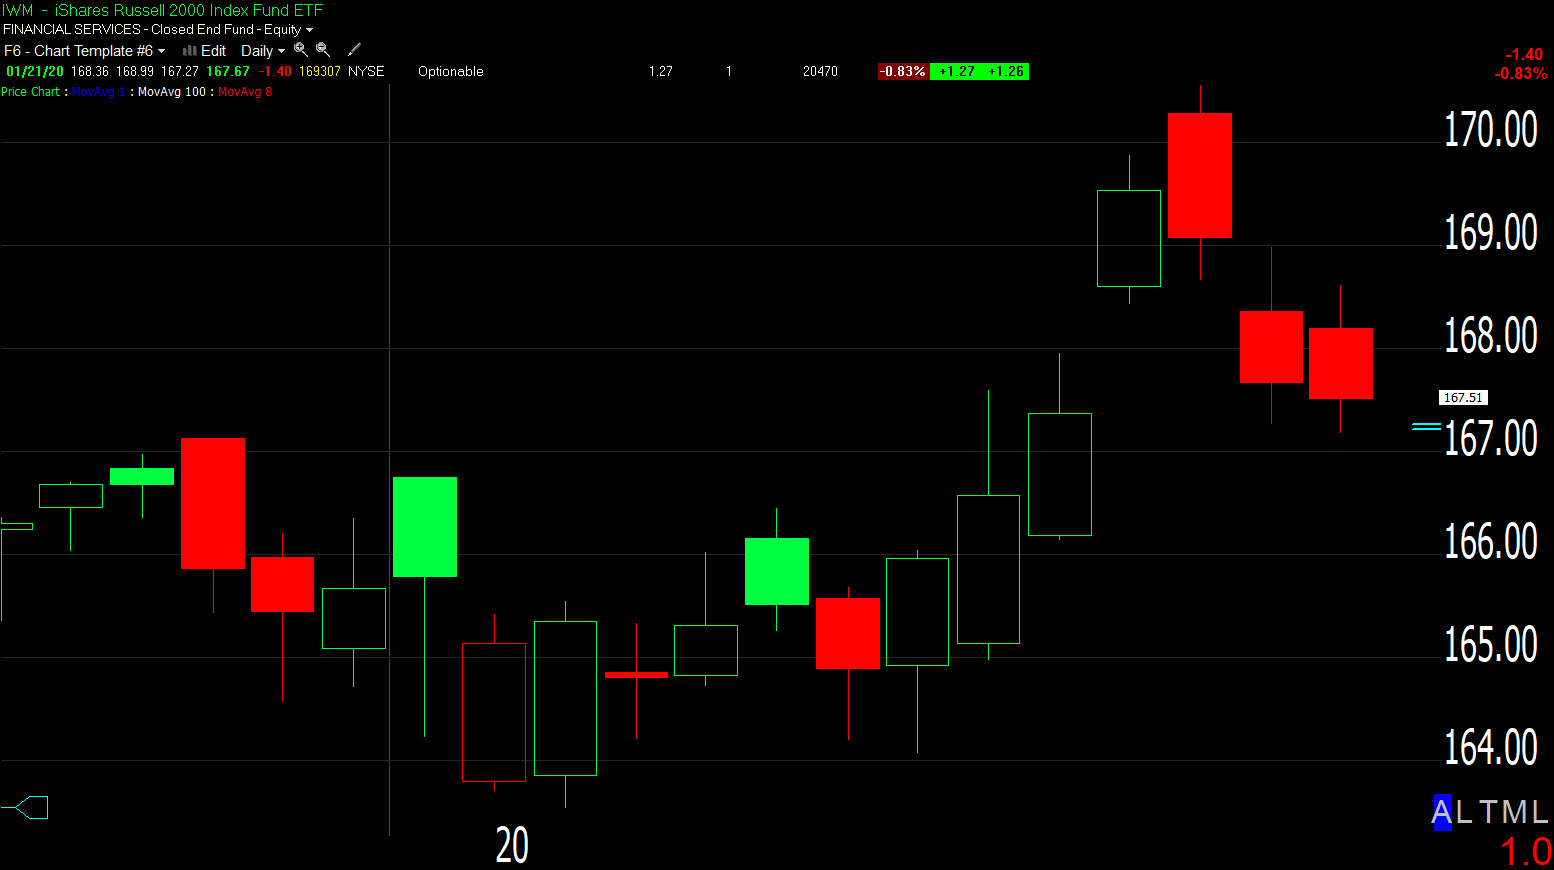 IWM / Small Caps (daily) have a clearly more bearish trio of price candles since their strength last week turned quickly during Friday’s session, ending with a bearish Dark Cloud Cover (reversal) price candle.
S&P sectors
The two most supportive sectors were the Technology sector which gained as much as +1.1%, but ended the session up just +0.4% after some weakness in 3C this afternoon, and the Consumer Discretionary sector which gained as much as +0.75%, but ended the day red.
S&P cyclical sectors underperformed, and seemingly following in the footsteps in the weaker performance of commodities like Crude oil and Copper. The Energy sector was weighed on by a -2.2% decline in WTI crude oil. The Industrials sector followed Transports’ early lead lower, dragged lower by another decline in Boeing (BA -1.4%). BA was downgraded to Hold from Buy at Vertical Research. In an interview with CNBC from Davos, President Trump threw Boeing under the bus, calling the company a “Big disappointment”. The president has heard that Boeing’s woes could shave a half point off U.S. GDP, since he himself mentioned it in the interview.
Defensive bond proxy sectors Consumer Staples and Utilities outperformed, but Real Estate was near the bottom of the leader board. Treasuries were more neutral today than Tuesday which had a clear defensive posture with some concerns over economics (cure flattening).
Materials ⇩ -0.40 %
Energy ⇩ -0.96 %
Financials ⇧ 0.29 %
Industrial ⇩ -0.53 %
Technology ⇧ 0.36 %
Consumer Staples ⇧ 0.08 %
Utilities ⇧ 0.31 %
Health Care ⇧ 0.12 %
Consumer Discretionary ⇩ -0.05 %
Real Estate ⇩ -0.80 %
Communications ⇩ -0.05 %
An area of early relative weakness was Dow Transports -0.7%
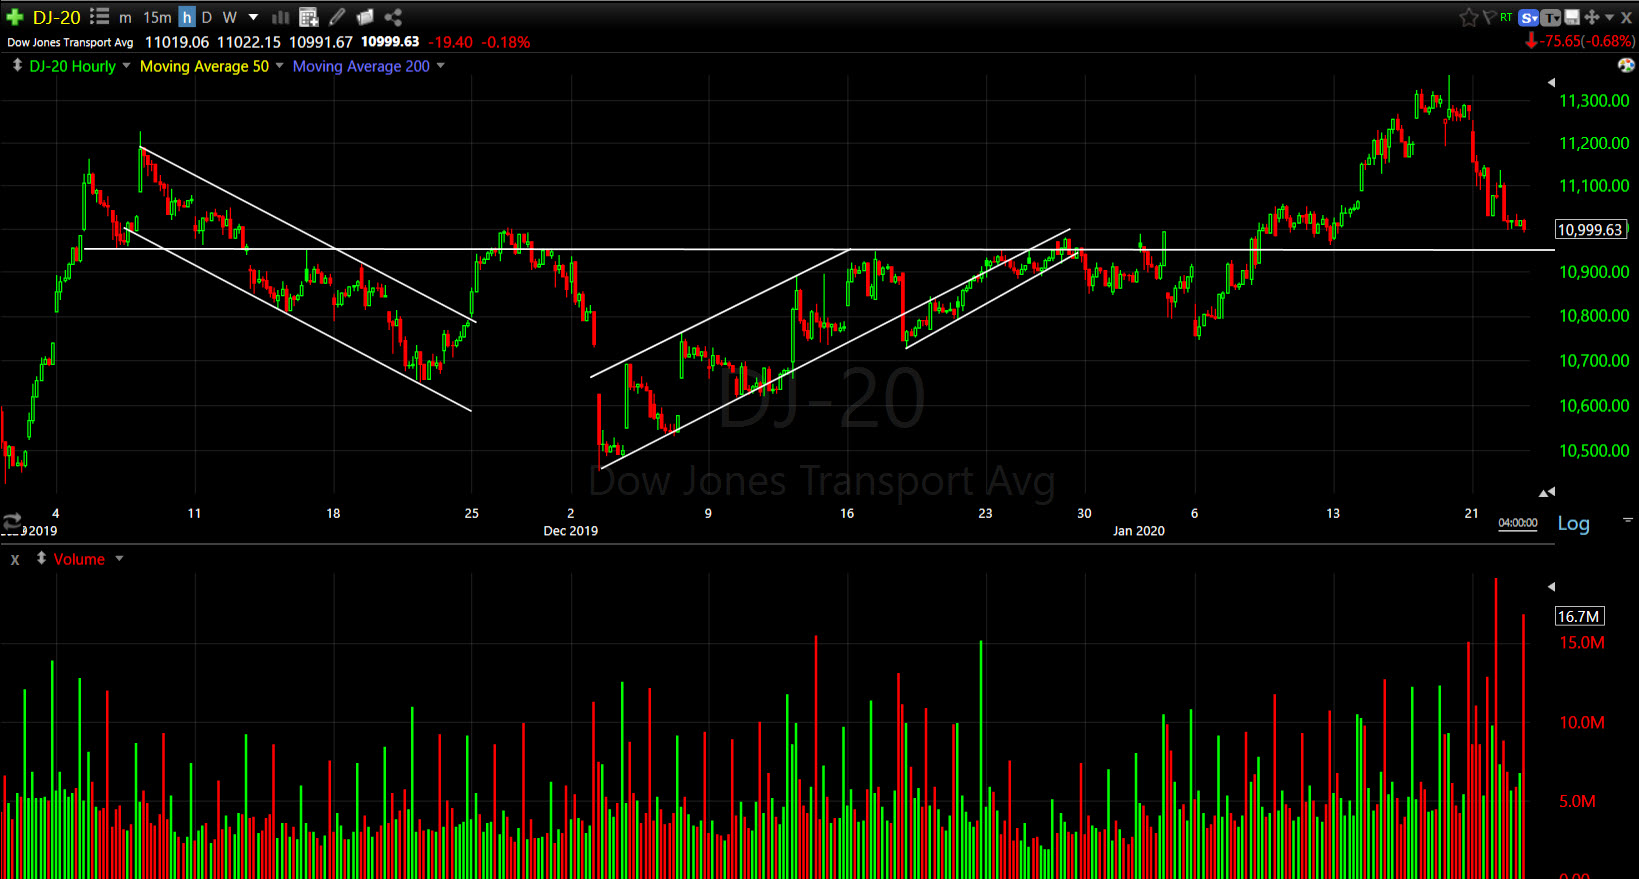
Dow Transports (60m) this is a chaotic price chart, but I’ve kept the trend lines because they tell a story. The economically sensitive Transports have gone nowhere in more than 2 months, transitioning from bullish consolidations, to a change in character and at least 1 bearish consolidation. Transports put in a surprisingly good performance with Small Caps last week, breaking out above the 10,950 (11k) zone of support/resistance. They’re testing down to the zone today and will likely find at least some initial support. However, notice how heavy the downside volume is as they pull back to $11k the last few days.
The S&P Industrial sector has traded in similar fashion to Transports the last few months and is also near a key price level.
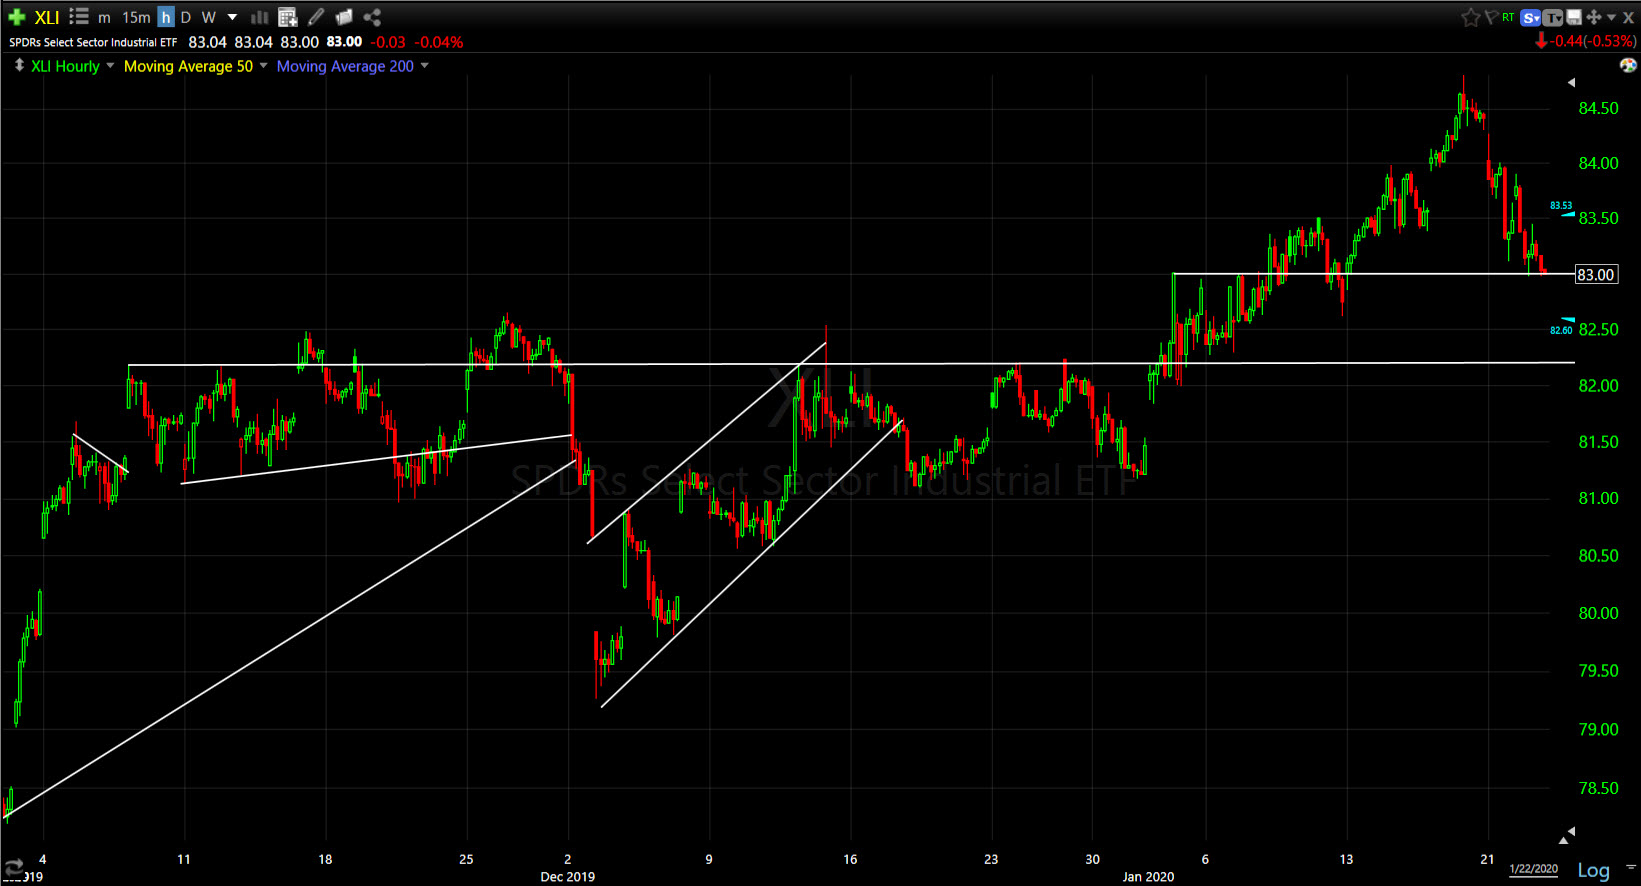 Industrial sector (60m) broke out above resistance in the area of $82.60. There’s a local level that could provide support here at $83 and a more meaningful level below between $82.20 and $82.60, more or less akin to Transports’ $10,950 level. If Industrials/Transports are of interest to you, keep an eye on both of those levels. Transports tend to lead industrials like small caps tend to lead the S&P.
This afternoon I mentioned some other potential trends coming in to play like the Materials sector.
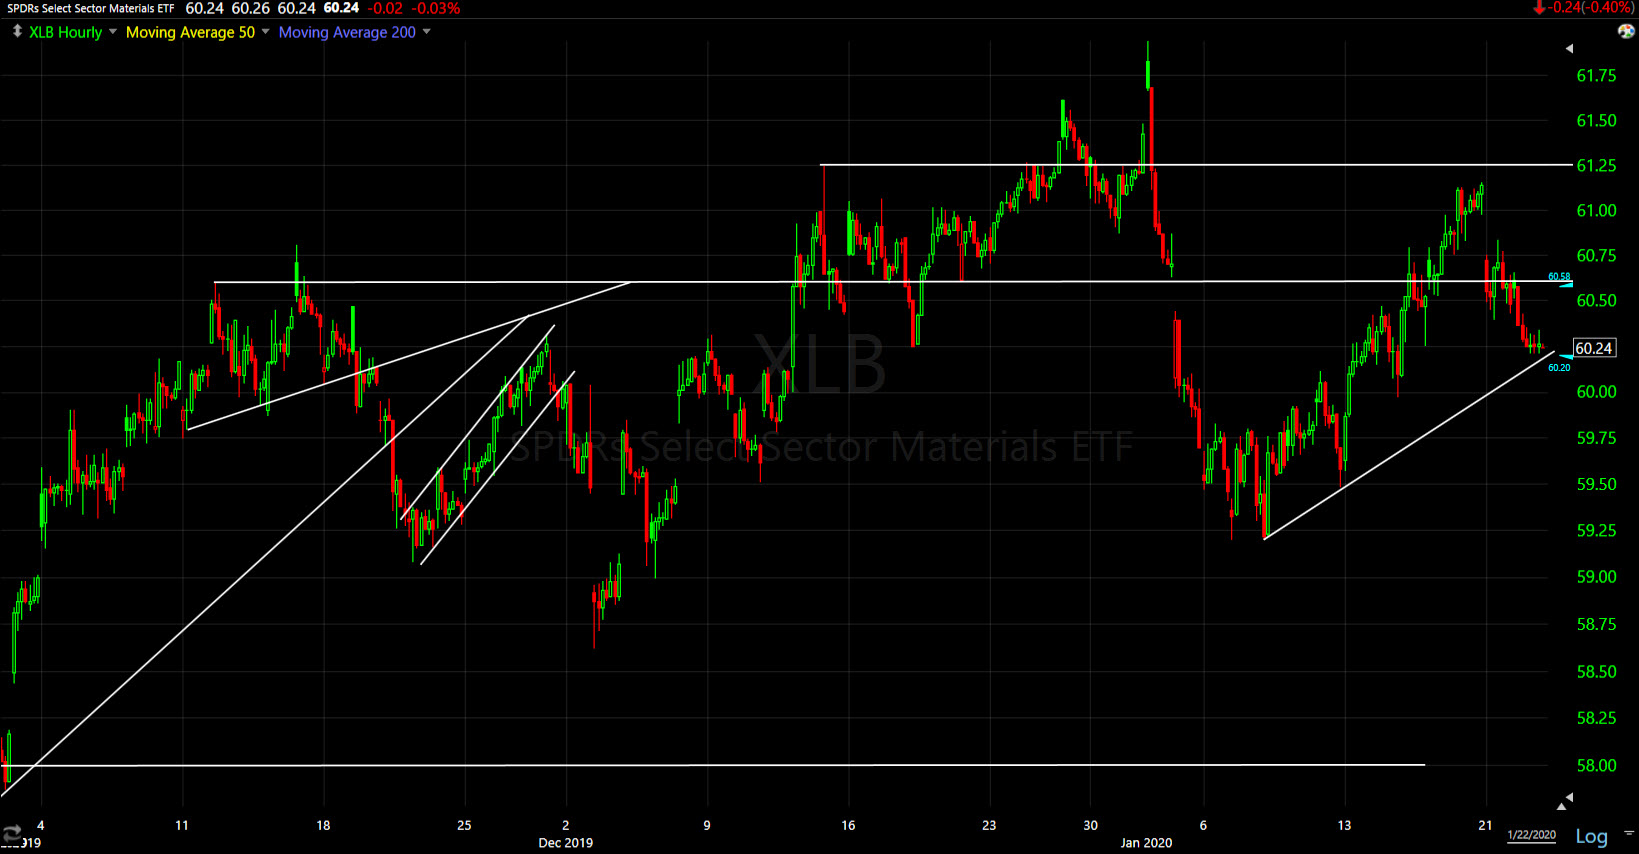
Materials / XLB (60m) as covered in Tuesday’s Daily Wrap the sector filled a gap last week as expected, and was a bit stronger with small caps, but not enough to negate the bearish parallelogram consolidation in 2020 under resistance.
Since other asst classes like bonds and commodities are more skeptical of economic growth prospects (as compared to the major averages), I also mentioned International Paper in the Daily Wrap with a similar bearish consolidation. The world’s biggest plastics maker, Dow Inc. (-3.3%) is also in the Materials sector and has a very similar price chart and price action.
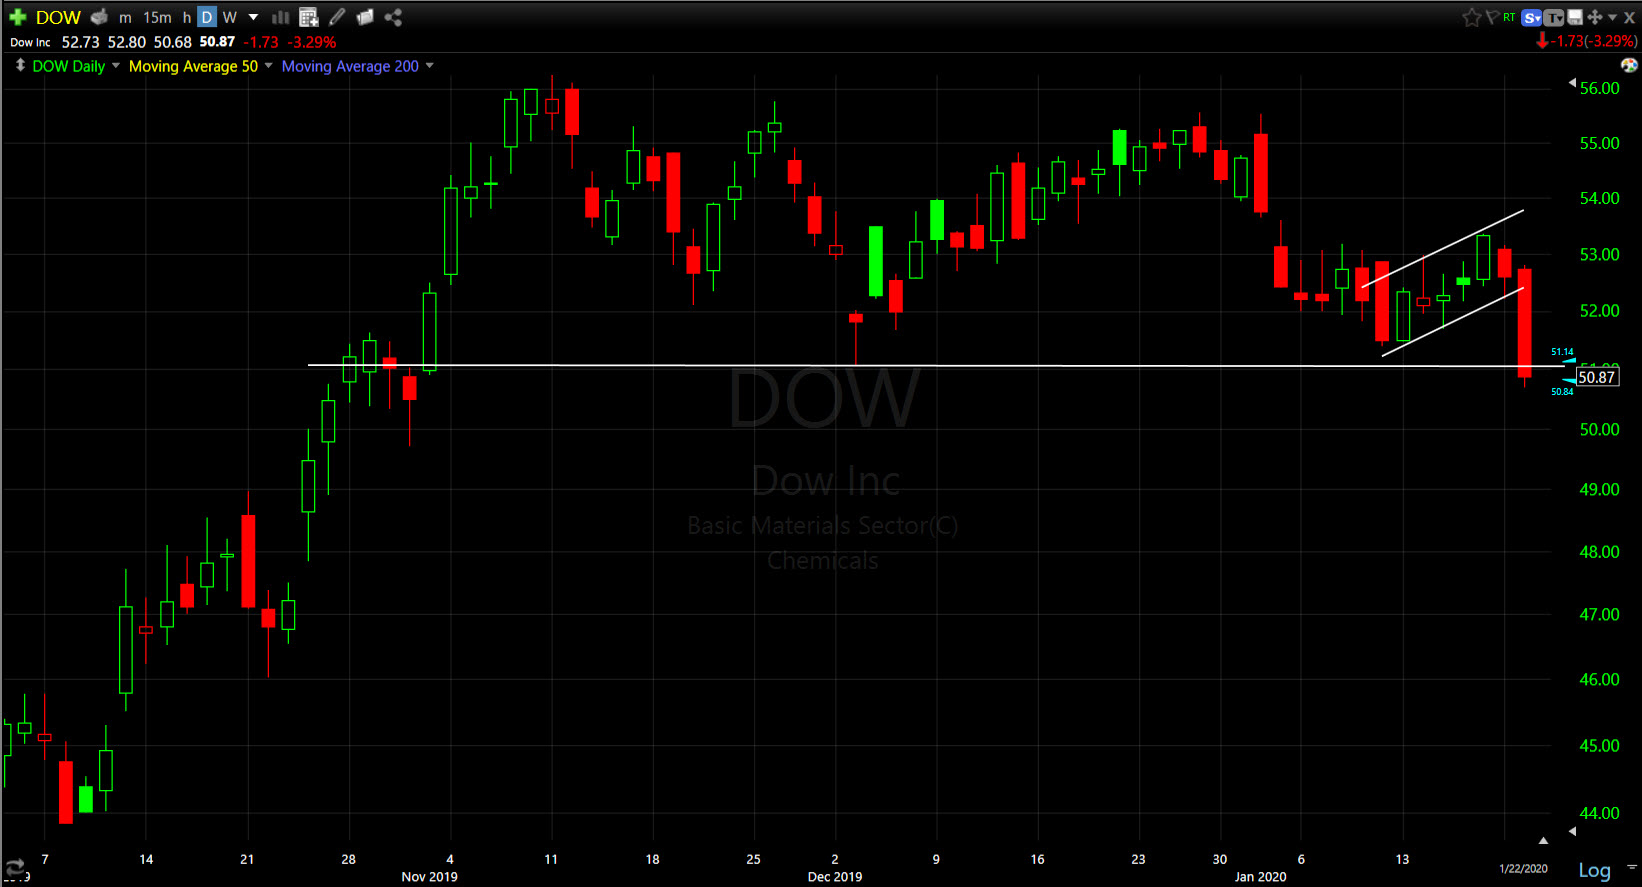
Dow Inc. (daily) rallied on the Phase I trade deal optimism in Q4 2019 too. Like IP, note the bearish price consolidation (2020). Today DOW Inc. closed just below a key support level in the area of $51.
If economic growth is set to increase I’d expect that International Paper (shipping boxes) and Dow Inc. (plastics) would look better than they do.
Other earnings related issues today include Netflix (NFLX -3.6%), United Airlines (UAL -2.9%), and Johnson & Johnson (JNJ -0.7%), all finished lower as investors reacted negatively to their earnings reports.
Volatility
VIX futures’ contracts rolled over this morning so I suspected 3C charts, which have been unresponsive since last week’s concerted selling effort in volatility, might move today. They did.
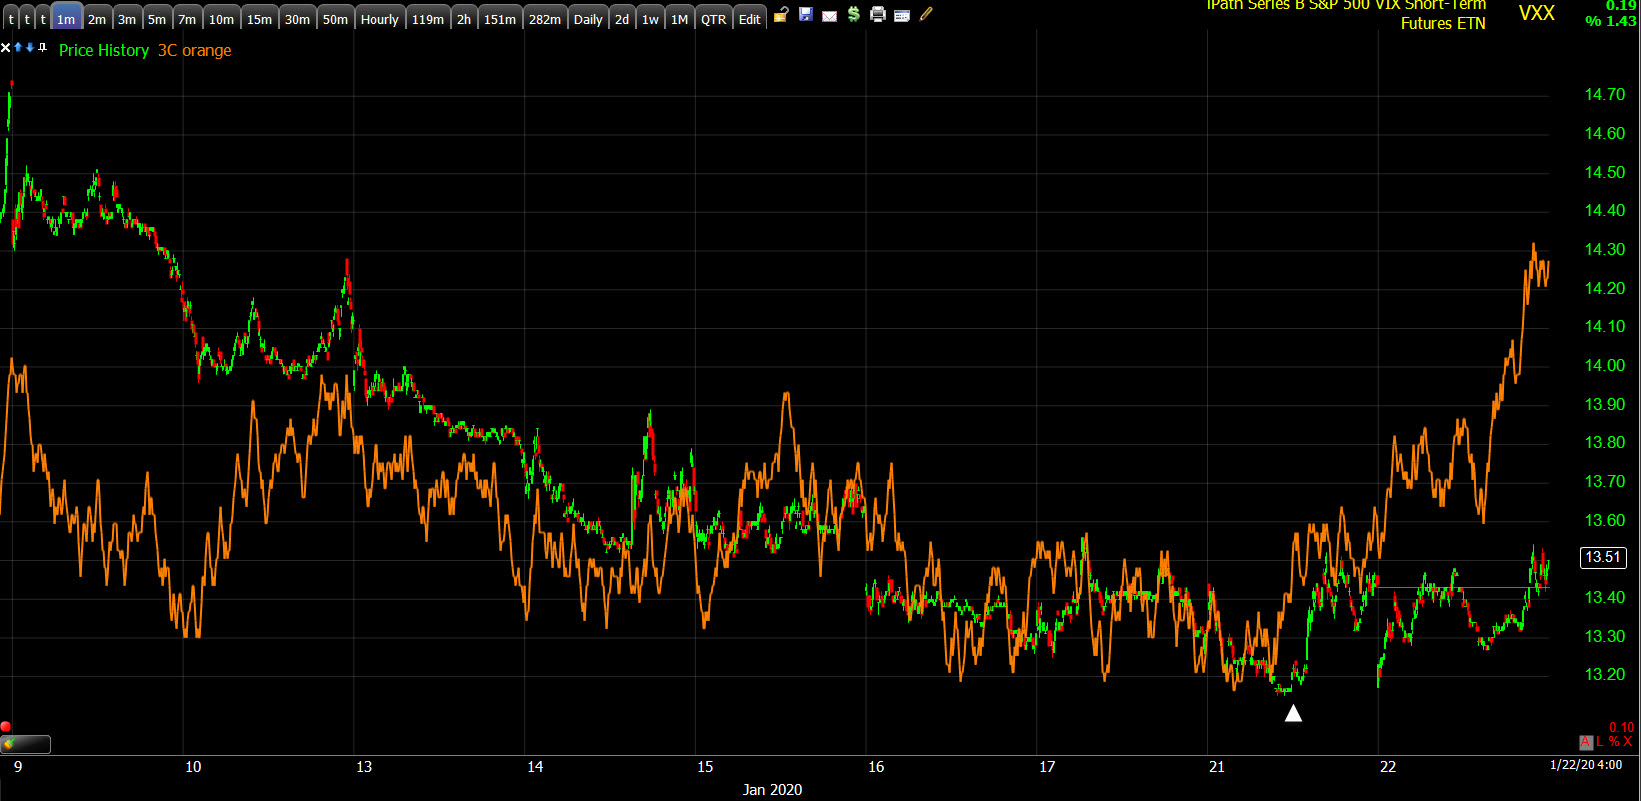 VXX (1m) the first sign of buyers trickling is was Tuesday (white arrow), the divergence extended today and is now starting to lead to the upside.
Internals
NYSE Advancers (1424) and Decliners (1431) were evenly split in a mixed session with volume coming in lighter at 864 mln. shares
There was nothing remotely close to a Dominant price/volume relationship. With internals and sectors as mixed as they are, it wouldn’t have mattered anyway.
Treasuries
U.S. Treasuries started the day little changed and finished little changed in a muted session. The 2-year yield declined one basis point to 1.51%, and the 10-year yield was unchanged at 1.77% with very modest curve flattening.
The 30-year yield posted its lowest close since December 3rd, which isn’t so much about today as it is about the general 2020 environment. The stock market continues to believe and hope that earnings season will justify the high (in some cases record setting) valuations stocks have posted through multiple expansion, rather than earnings growth. The bond market on the other hand has a more pessimistic view.
Currencies and Commodities
The U.S. Dollar Index finished flat at 97.52.
WTI crude settled lower by -2.2% to $56.68/bbl., breaking under the key $57 level. After failing to get above $59 last week and trading under $57, Crude has started the second leg down I’ve been warning of.
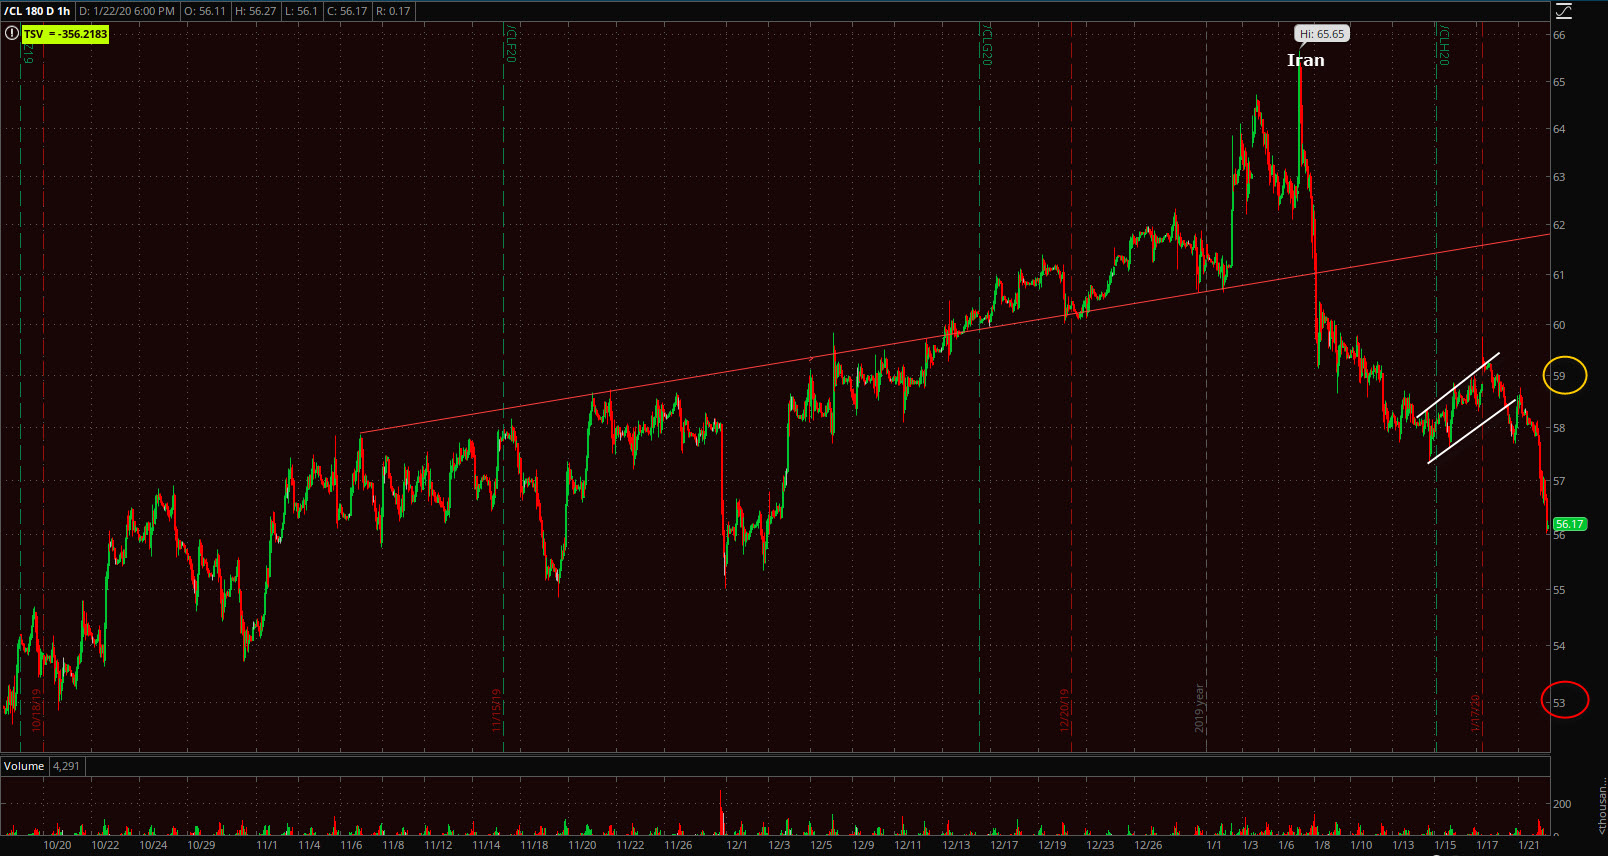 WTI Crude futures (60m) the red trend line is the top of a broadening formation. My downside target for the second leg decline is $53.
Price action is remarkably similar to September when Crude spiked the most in history after Saudi Arabian oil facilities were attacked with missiles and 50% of oil production was knocked off line.
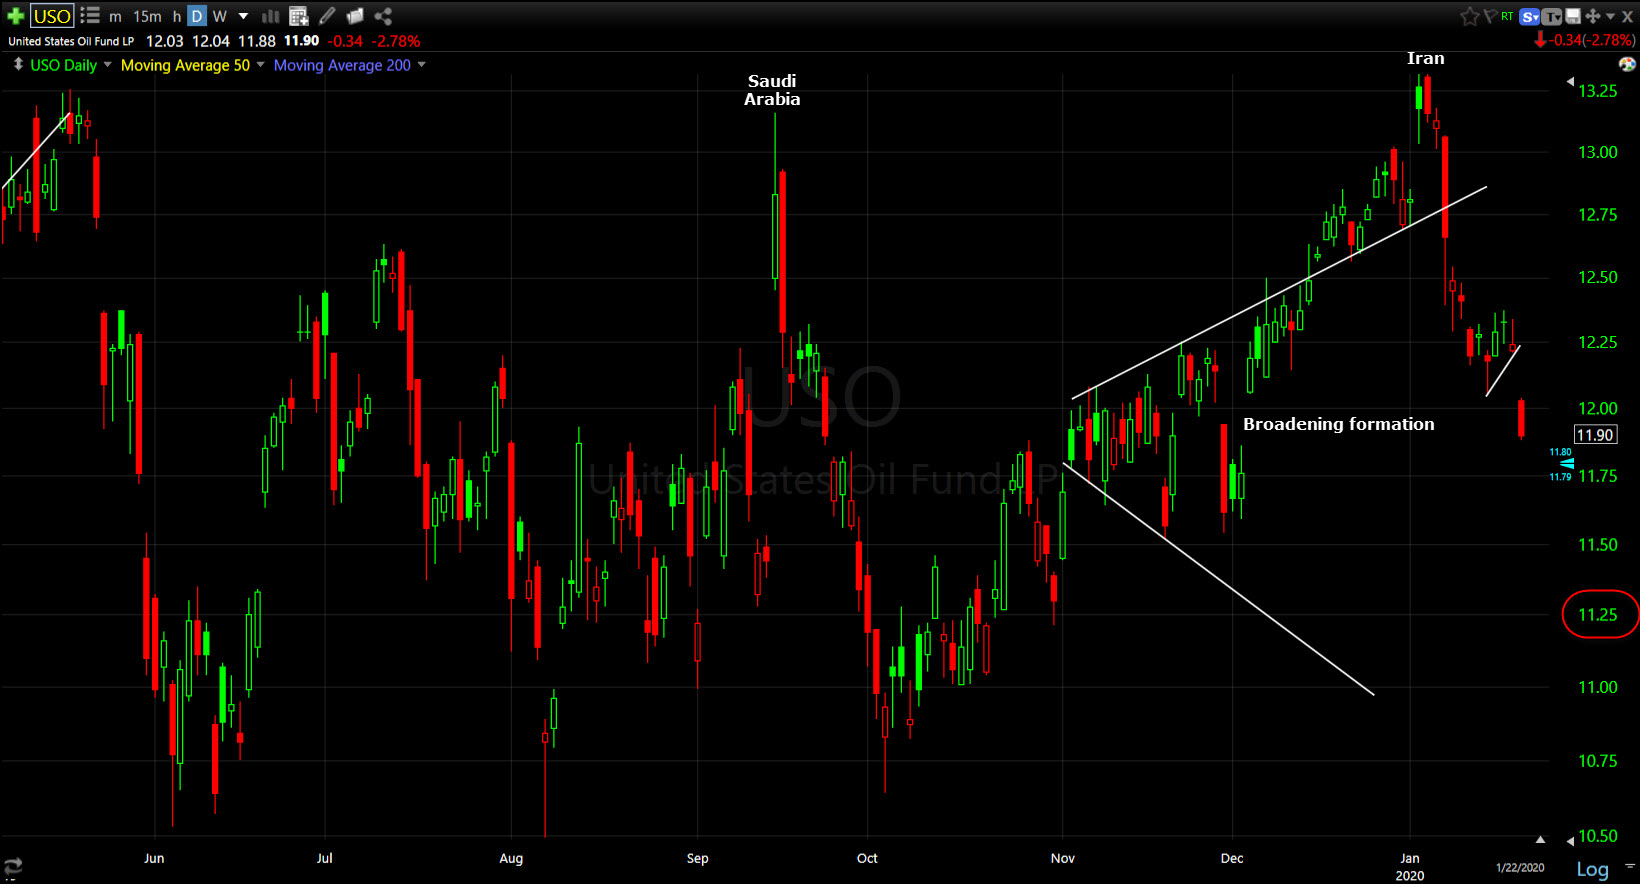 USO (oil) daily – What’s interesting is that the second leg downside price target (USO $11.25) is nearly the bottom of the former broadening formation from November!
The bigger picture takeaway is, if you believe the phase I trade deal is going to accelerate economic growth as stocks priced in the last 4 months, why is crude oil trading like this?
Let me tie this together with the bond market’s take…
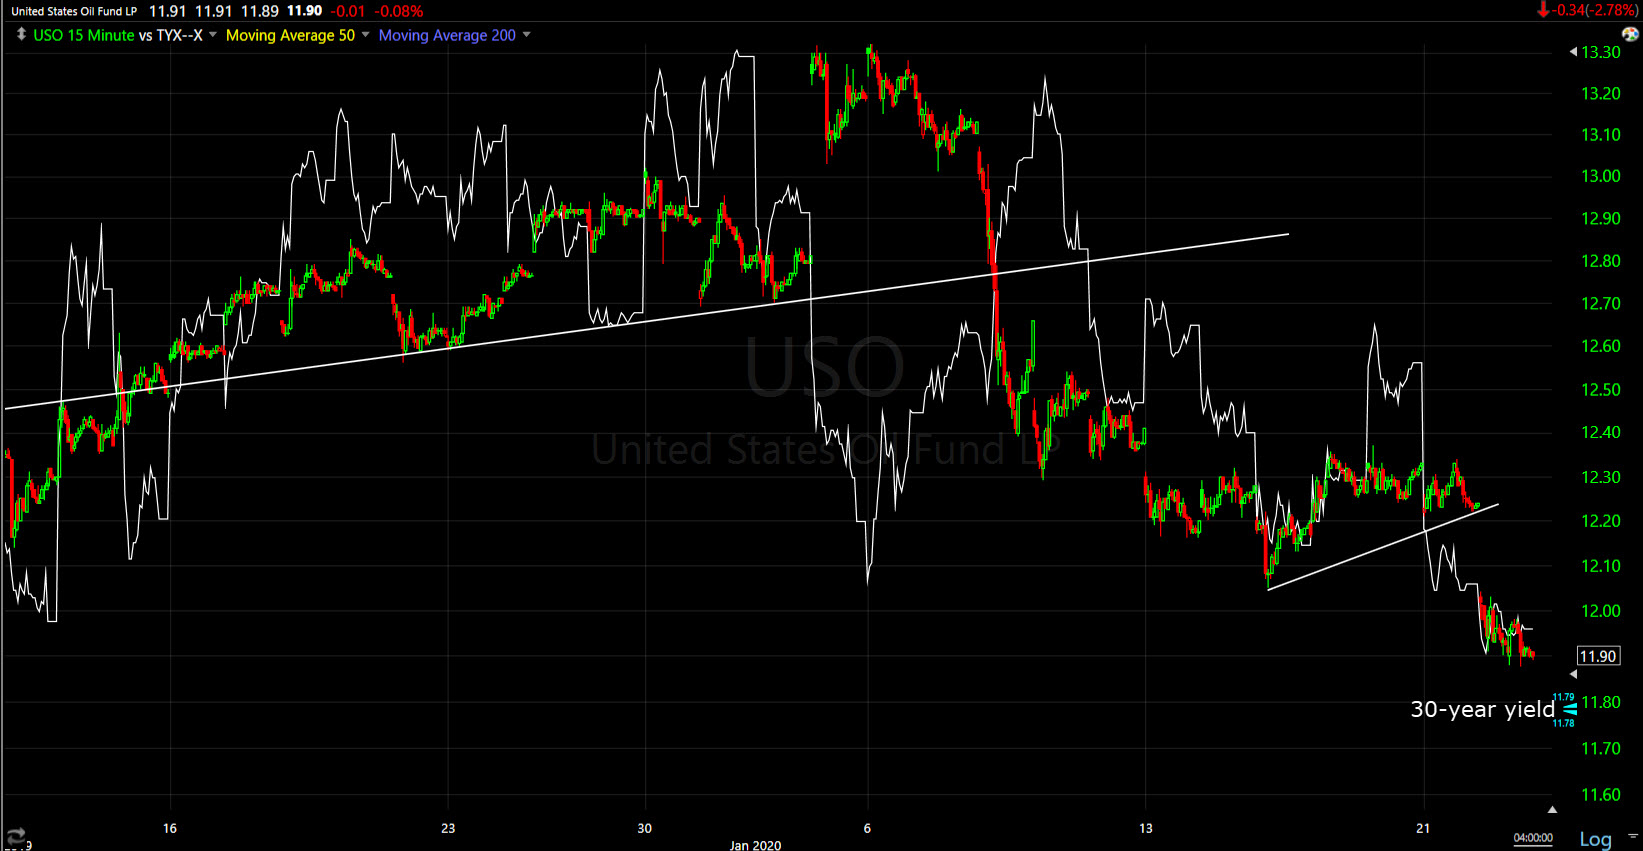
USO (crude oil) 15 min. and the 30-year yield. Except for the geo-political flair up, crude is trading like the 30-year yield, both lower, both the lowest since early December. The only reason the two diverged at crude’s high is because crude’s gain at the time was risk premium due to the geopolitical flair up with Iran.
If we take this a step further, we can tie in how other commodities are trading with the bond market’s message as well.
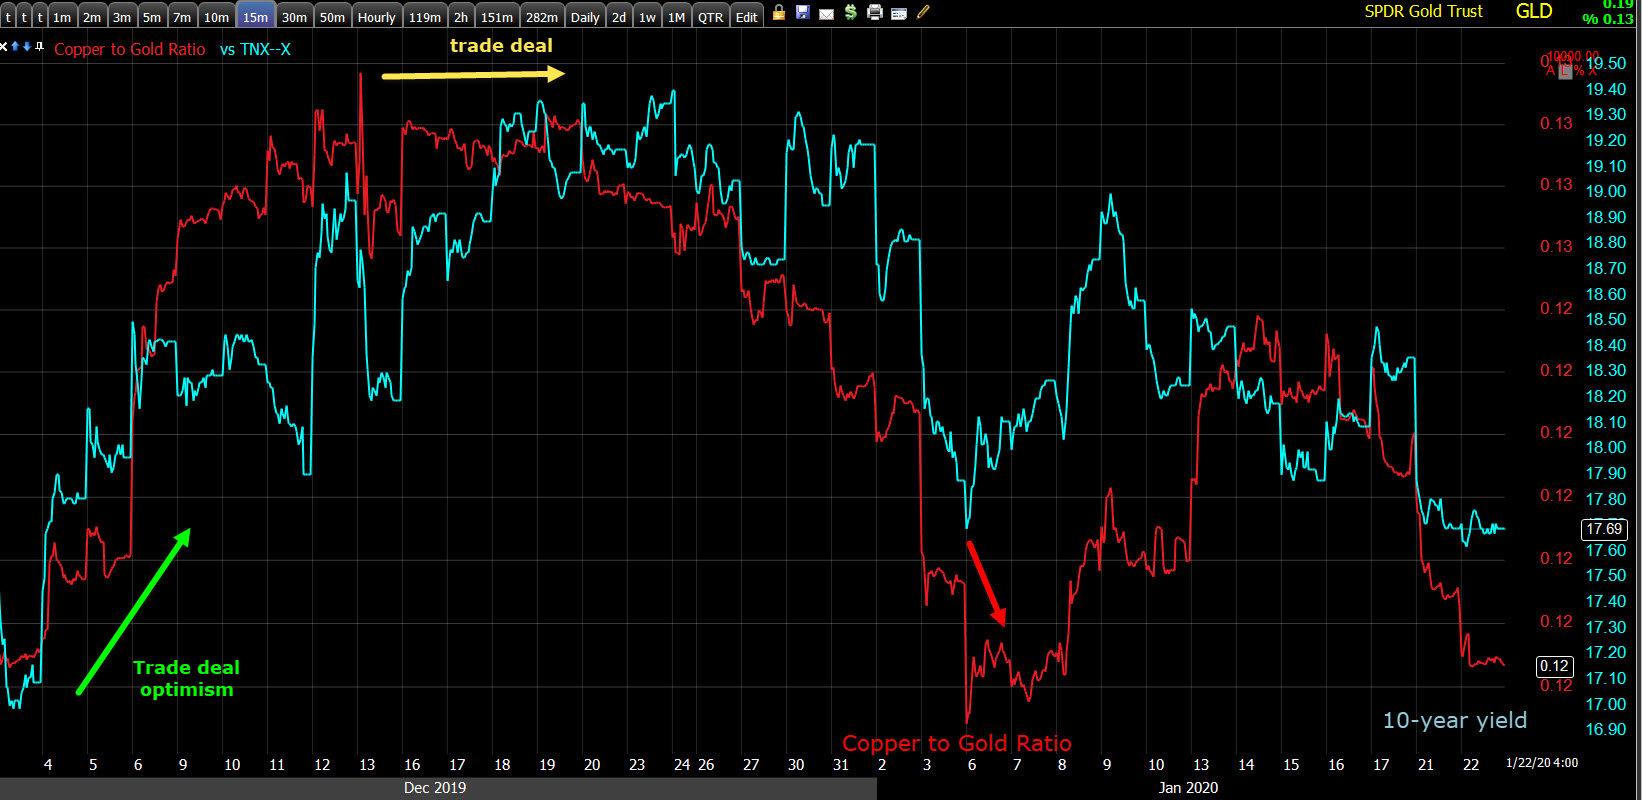 Copper:Gold Ratio (red) and 10-year yield (blue). Note the trade deal optimism in early December (green arrow), but after the trade deal was finally announced in mid-December (yellow arrow), that optimism faded fast and the copper:gold ratio led yields lower (red arrow).
Said another way, the bond market and commodities aren’t acting like they’re expecting an economic rebound, only stocks are and stocks’ advance has been completely on multiple expansion, not earnings. Here’s a timely tweet on the subject…
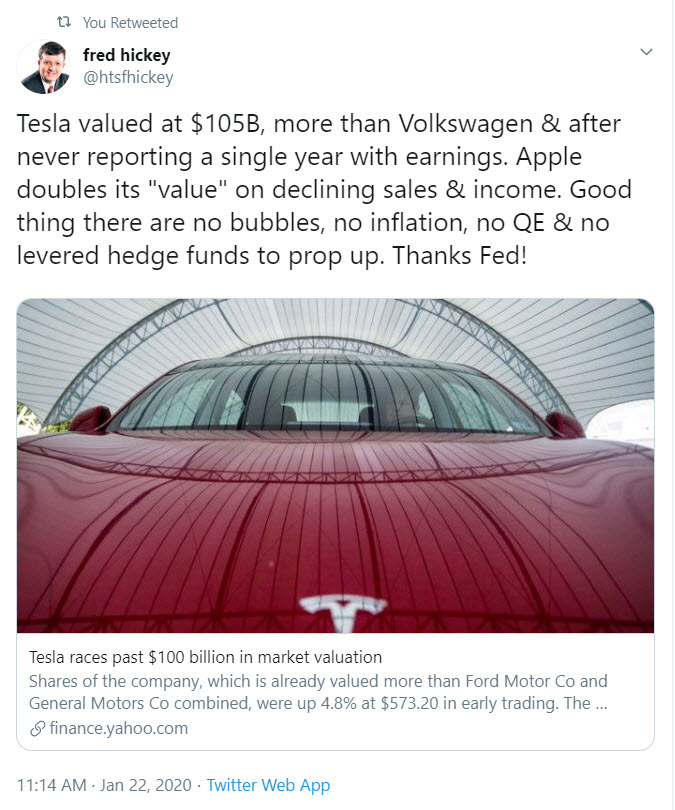
Earnings growth went negative for 2019 and so far, although early in the earnings season, growth is down -0.8%. As such, stocks’ advance has not been on earnings growth, it has been on richer and richer (more and more expensive) valuations. Numerous valuation metrics are at the highest since the 1999-2000 Dot-com bubble, some others are at all-time high valuations.
The chart below is just for perspective, not offered as a leading indicator or forecast….
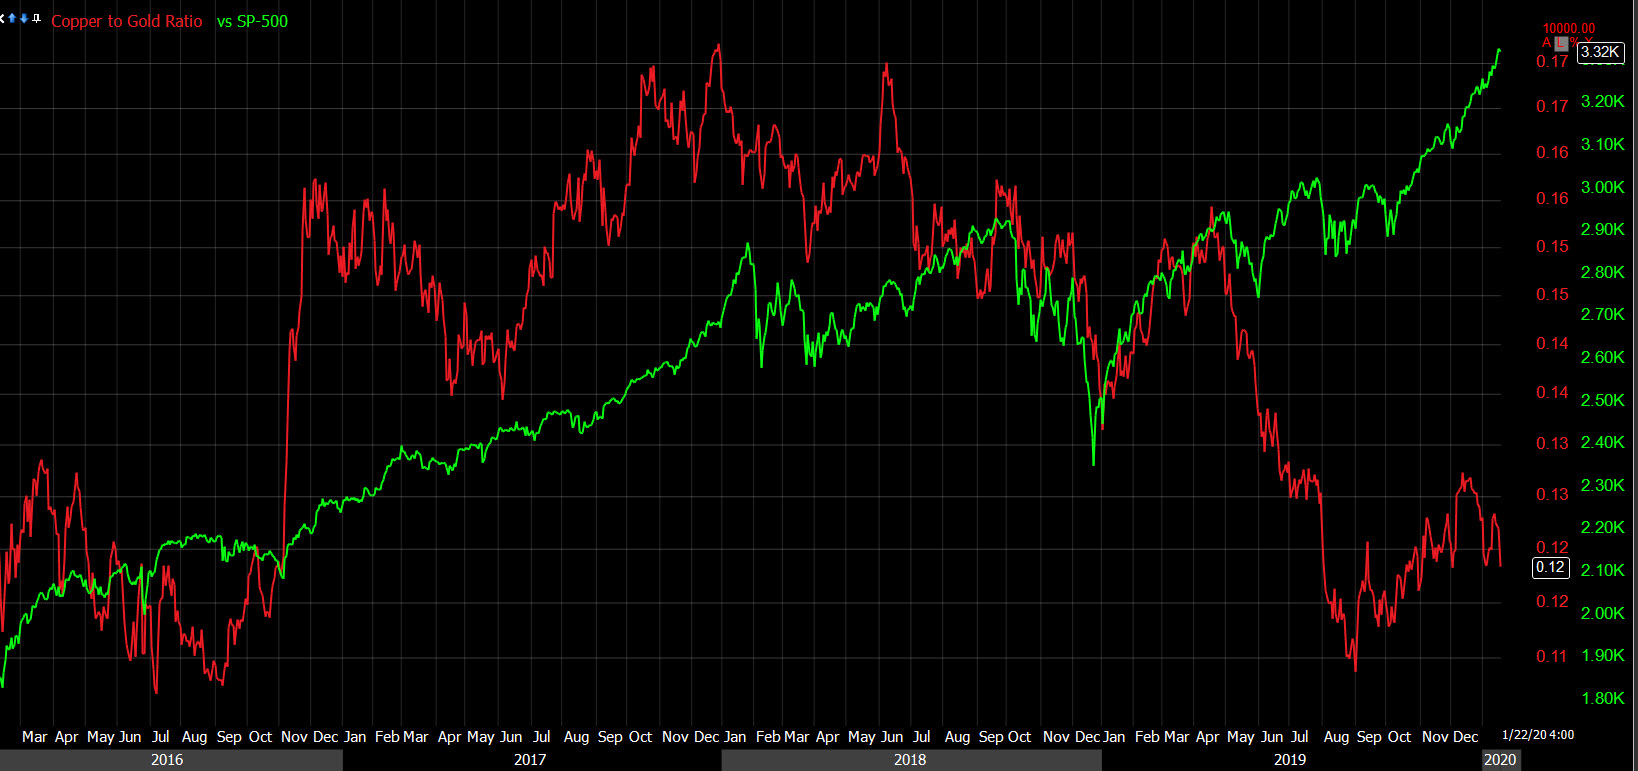
SP-500 (green) and Copper:Gold ration (red). One of the dominant themes you may recall from 2019 was a huge divergence between bond yields and the S&P. In fact in his comments today at Davos, the few things that JP Morgan CEO, Jamie Dimon worried about, included the divergent stock/bond market, negative rates and the Fed’s QE.
The same divergent trend is here too with the copper:gold ratio. The market didn’t care in 2019 because the Federal Reserve made a sharp u-turn and reversed policy in early January of 2019 from hiking rates and shrinking their balance sheet (tightening) to cutting rates and expanding their balance sheet (loosening), the latter at the fastest clip since QE3. Other than the Q4 2019 trade deal optimism bounce in the copper:gold ratio, commodities and treasuries are nowhere near as sure as stocks, which in my view, makes this earnings season and guidance all the more important.
Before moving on, Copper traded lower by -1% and Gold futures settled very modestly lower (-0.1%) to $1,556.70. Gold’s relative strength vs. Copper today suggests yields move lower.
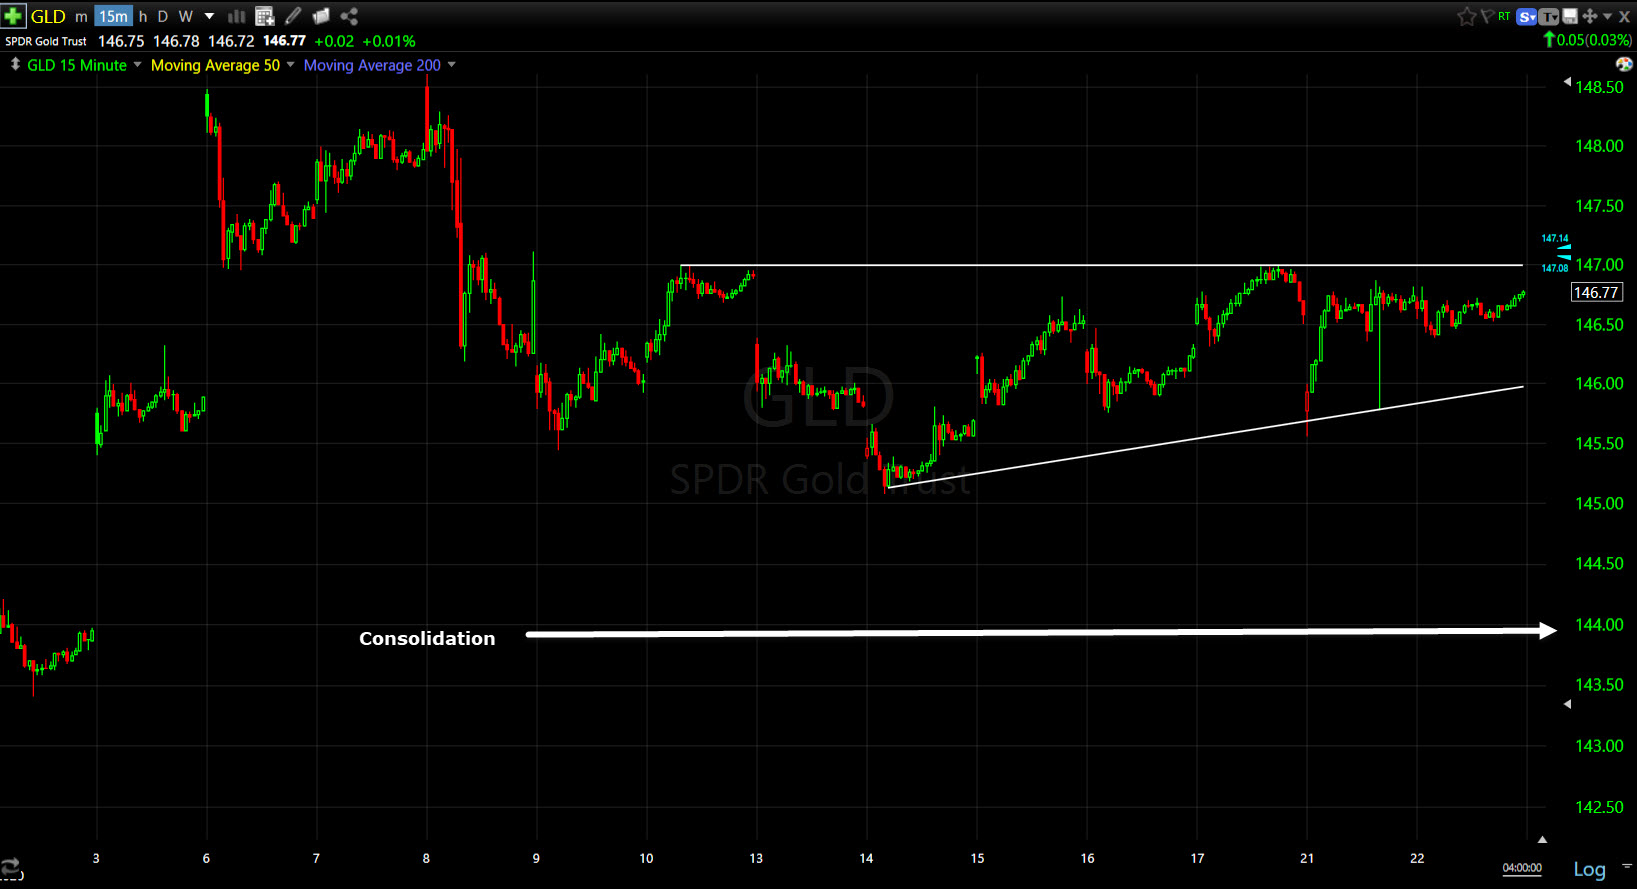
GLD (15m) this is the consolidation phase (similar to a bull flag on a daily chart). I thought I’d post the chart since I noticed a small bullish ascending triangle in the consolidation phase with a lower trend line around $146 and resistance at $147- two nearby levels worth being aware of. Since the range is constructive and small, you could buy with a stop below the lower trend line and have a pretty attractive risk/reward profile.
Leading Indicators
There wasn’t been much change as a group since weakness Friday and a bounce early Tuesday morning. However, High Yield Credit remains noticeably weaker. I suspect part of that weakness may have been related to an expectation that crude oil would break down this week. Energy companies have issued a ton of high yield credit or junk debt. The more immediate takeaway is lower risk appetite or as seen Tuesday, risk aversion.
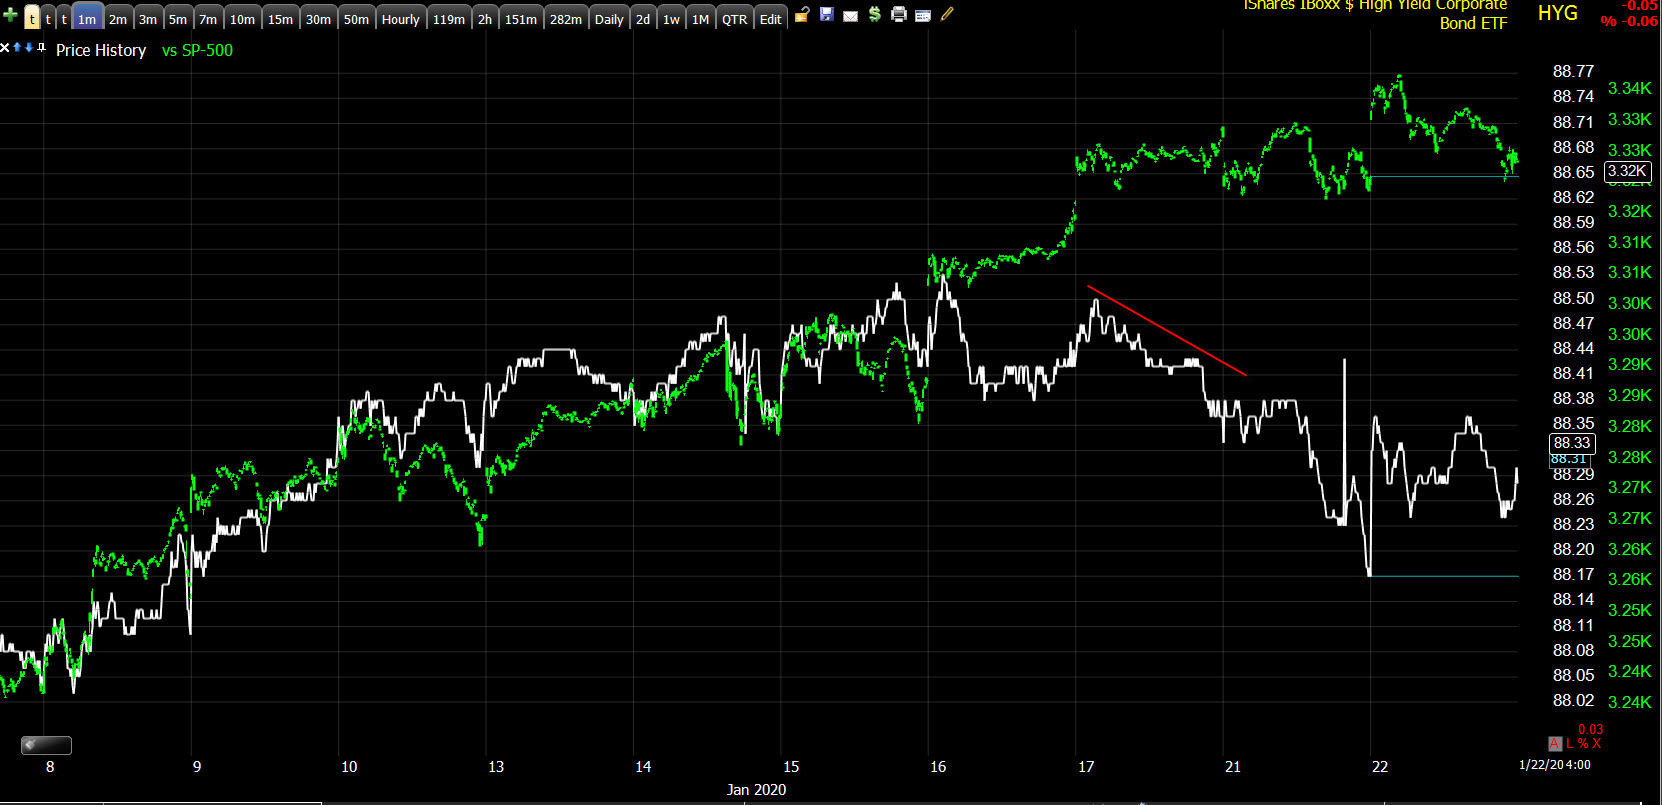
SP-500 and HYG. HY credit was a red flag from the end of October to early December, then it performed very well in December. This is the first sign of notable weakness since and evident from Friday. The other leading indicators are mixed and not issuing any new signals. I’ll update as soon as they do.
Summary
Whether it be today or this week, the early dominant trend seems not to be some much about a contagious virus as a divergence between what the bond, currency and commodity markets think about economic growth and the divergent view the stock market has. Stocks are not surprisingly focused on earnings, but the other asset classes seem to be looking through to lackluster economic growth expectations. As I always say, a day does not make a trend, but as seen above, this isn’t exactly a new trend or dynamic.
Overnight
S&P futures are down near -0.1% tonight.
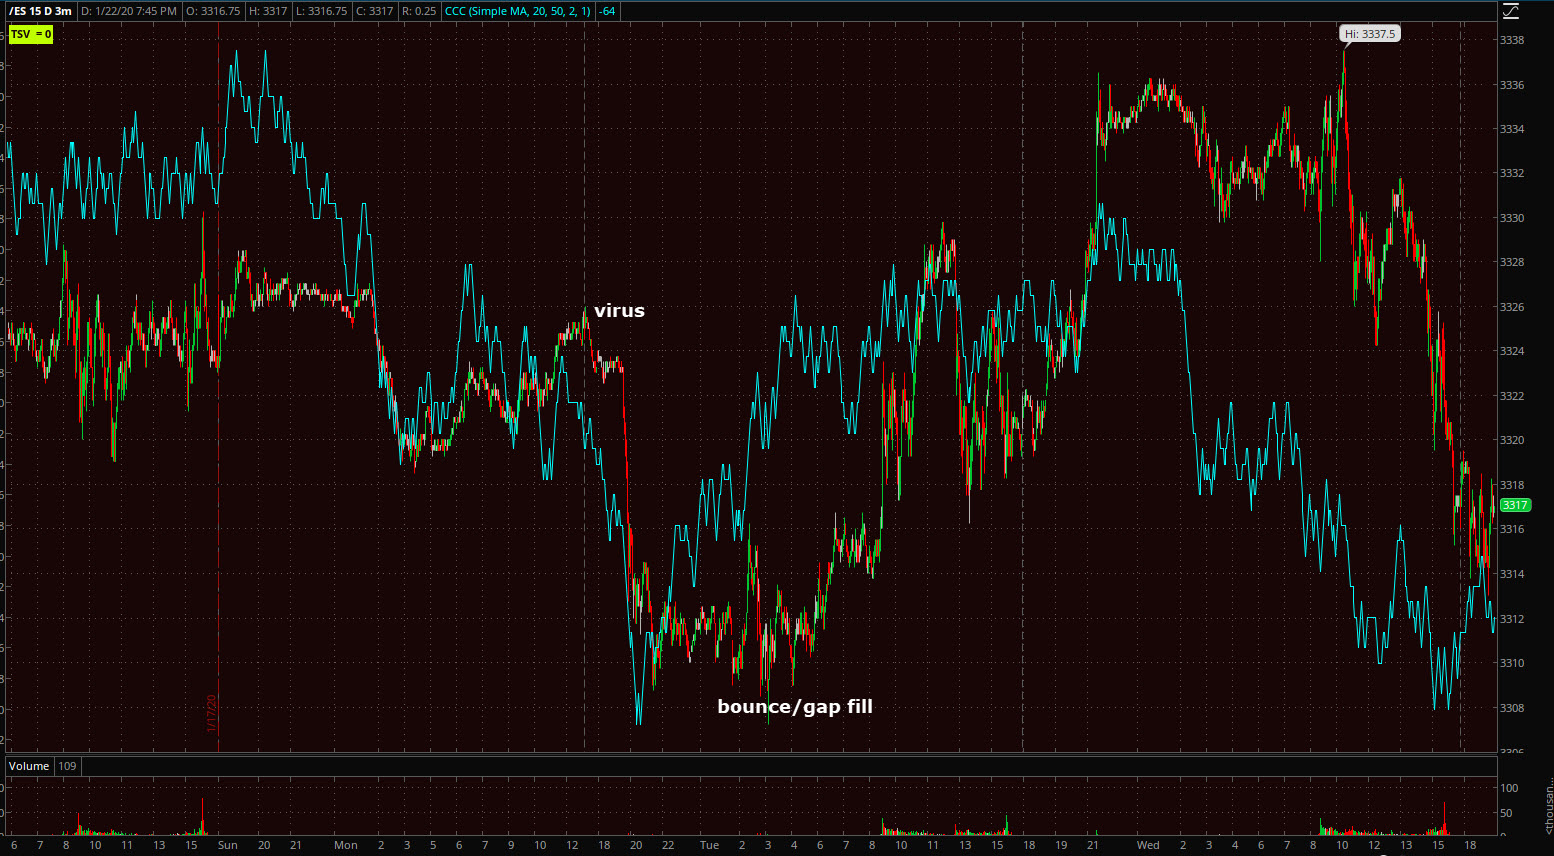
S&P futures (3m) Tuesday morning I expected the average to fill the gap from their lower open as there was a small positive 3C divergence before the open. 3C confirmed ES’s price action most of Tuesday and started negatively diverging overnight as index futures gained. As you can see, prices followed 3C lower after the XLK/Tech sector divergence this afternoon. 3C is not screaming lower, but it is in-line with the modest decline on the 3 min chart.
There’s some evidence of modest buying (support) near $3314 on the shorter, more sensitive 1 min charts tonight.
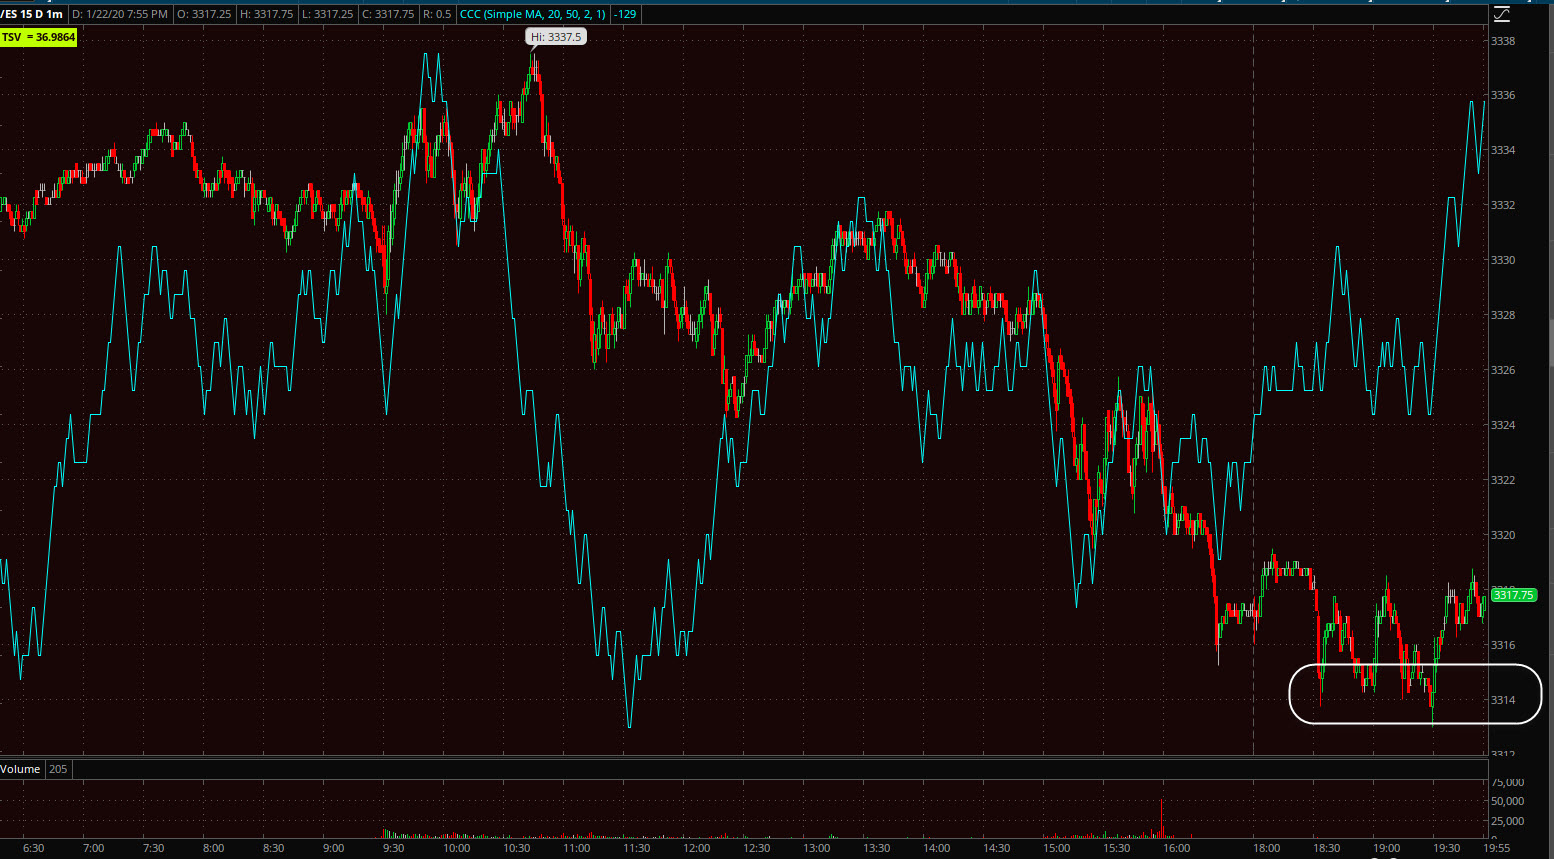
ES (1m)
WTI Crude oil is down -1% to $56.14 after API oil inventories showed a large build in crude supplies.
Perhaps most importantly (and most ridiculously)m I understand U.S. Treasury Secretary Steve Mnuchin is going to be on CNBC tomorrow at 8:15 a.m. ET. He’ll do his best to pump the market before the open.