Stock Market Wrap November 19, 2020
In last night’s session Index futures consolidated yesterday afternoon’s losses in a small bearish flag type formation. Things got a little volatile overnight with S&P futures actually selling off on good vaccine news. Phase 2 vaccine trial data from the AstraZeneca (AZN +0.1%)/Oxford collaboration showed encouraging immune responses in older patients, but index futures dropped (Sell the news?). Price returned to the consolidation phase in a mostly quiet cash session, at least until the afternoon.
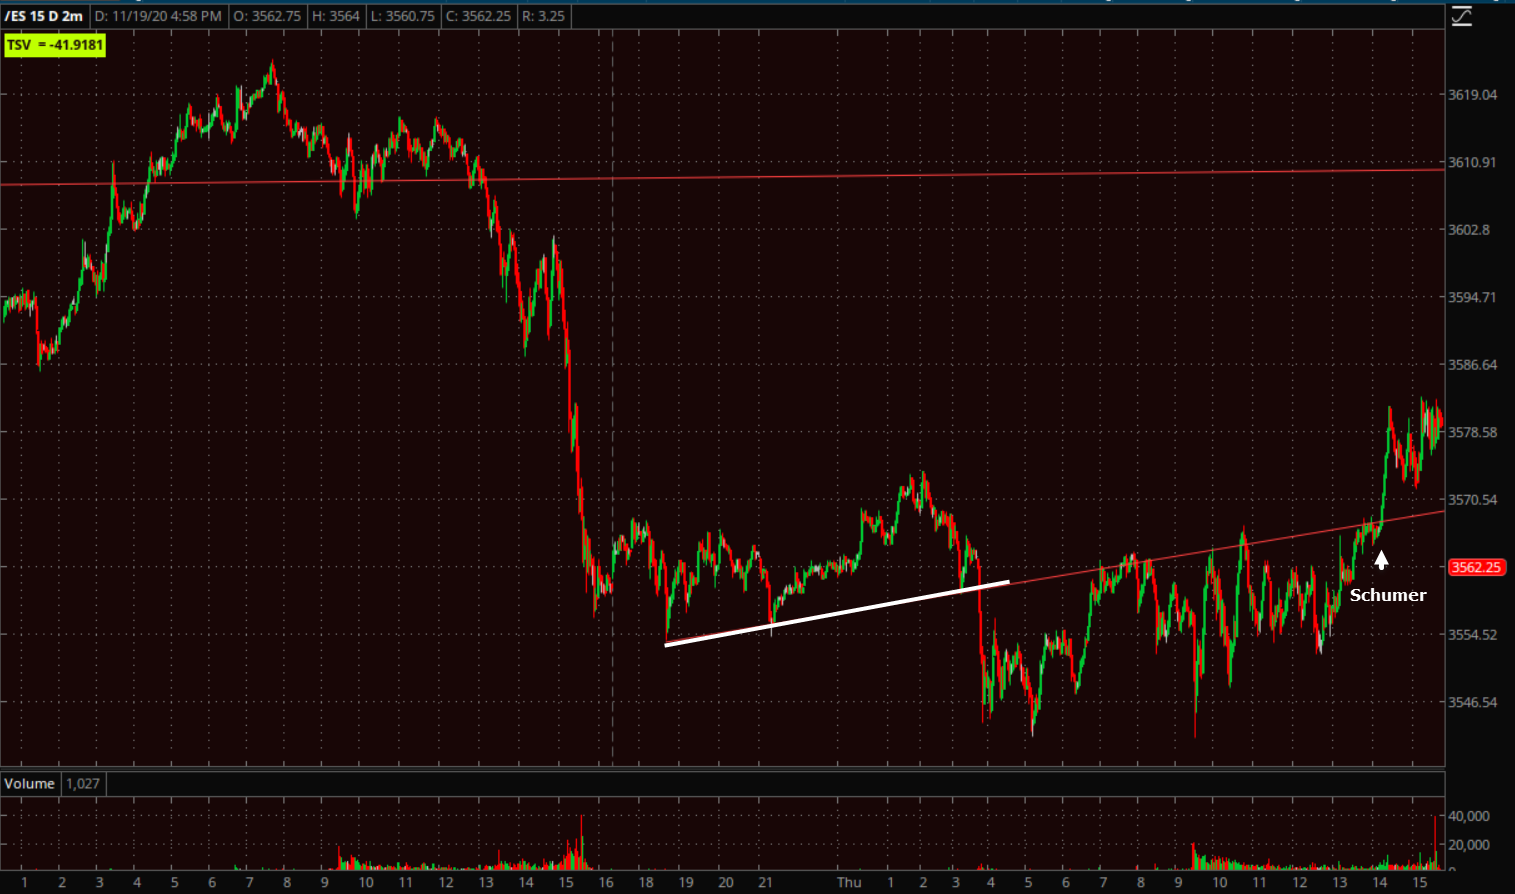 S&P futures (2m) the early overnight session (white trend line) is a typical consolidation after a steep decline. Prices fell below and backtested into the trend line throughout the cash session until the afternoon which saw an advance back above the trend after Senate Minority Leader Schumer reportedly said Senate Majority Leader McConnell agreed to restart stimulus talks.
Politico reported that Republicans said the meeting was about the government funding deadline, not COVID relief. Either way it didn’t change the nature of the day, evident on S&P’s cash chart..
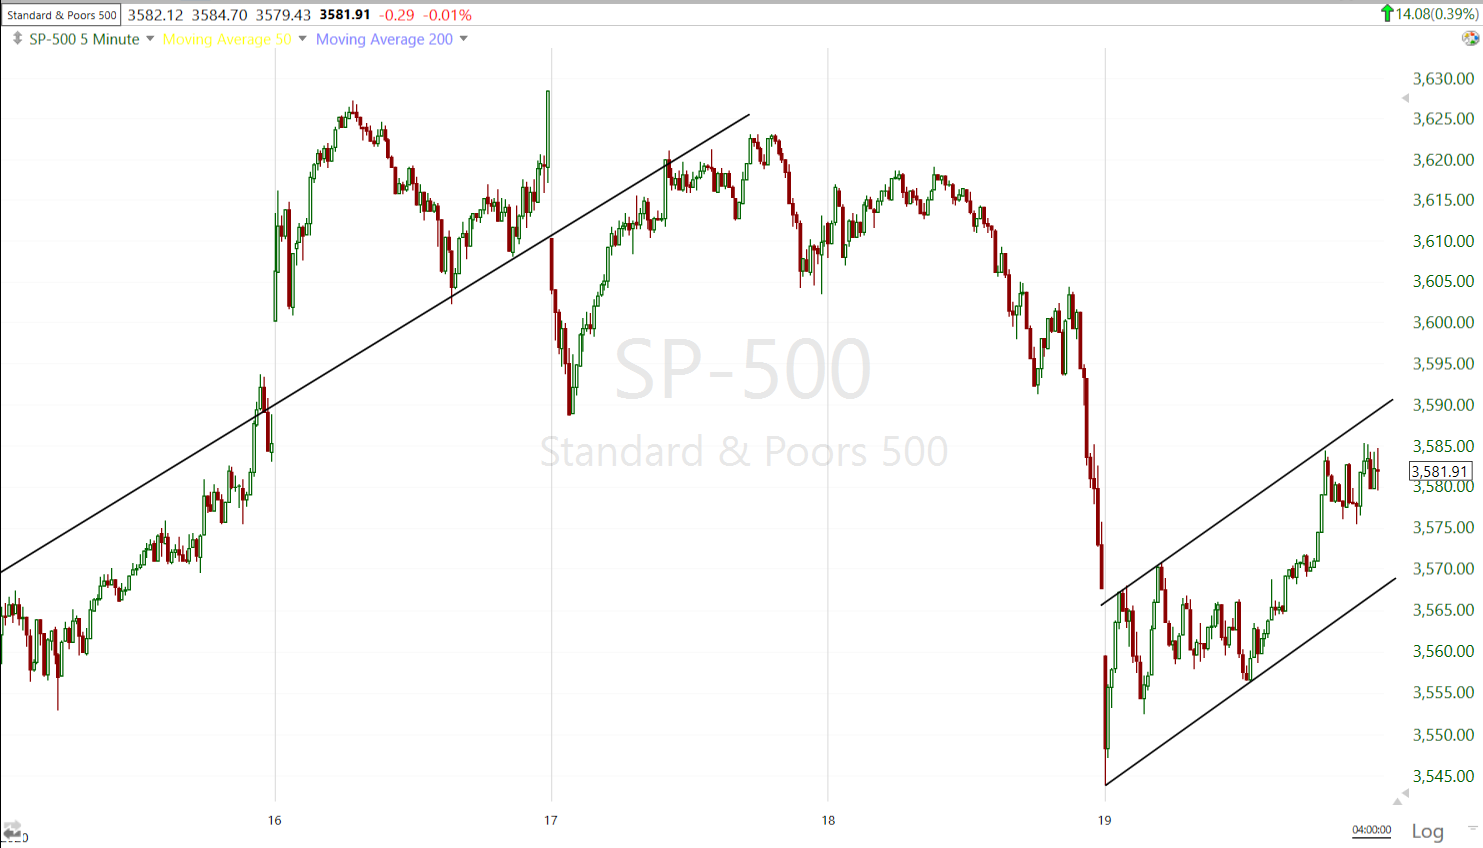 SP-500 (5m) in a bearish flag price pattern, a fairly steep one, but still a flag.
NASDAQ lent the S&P early support as Technology, Communications and Consumer Discretionary outperformed.
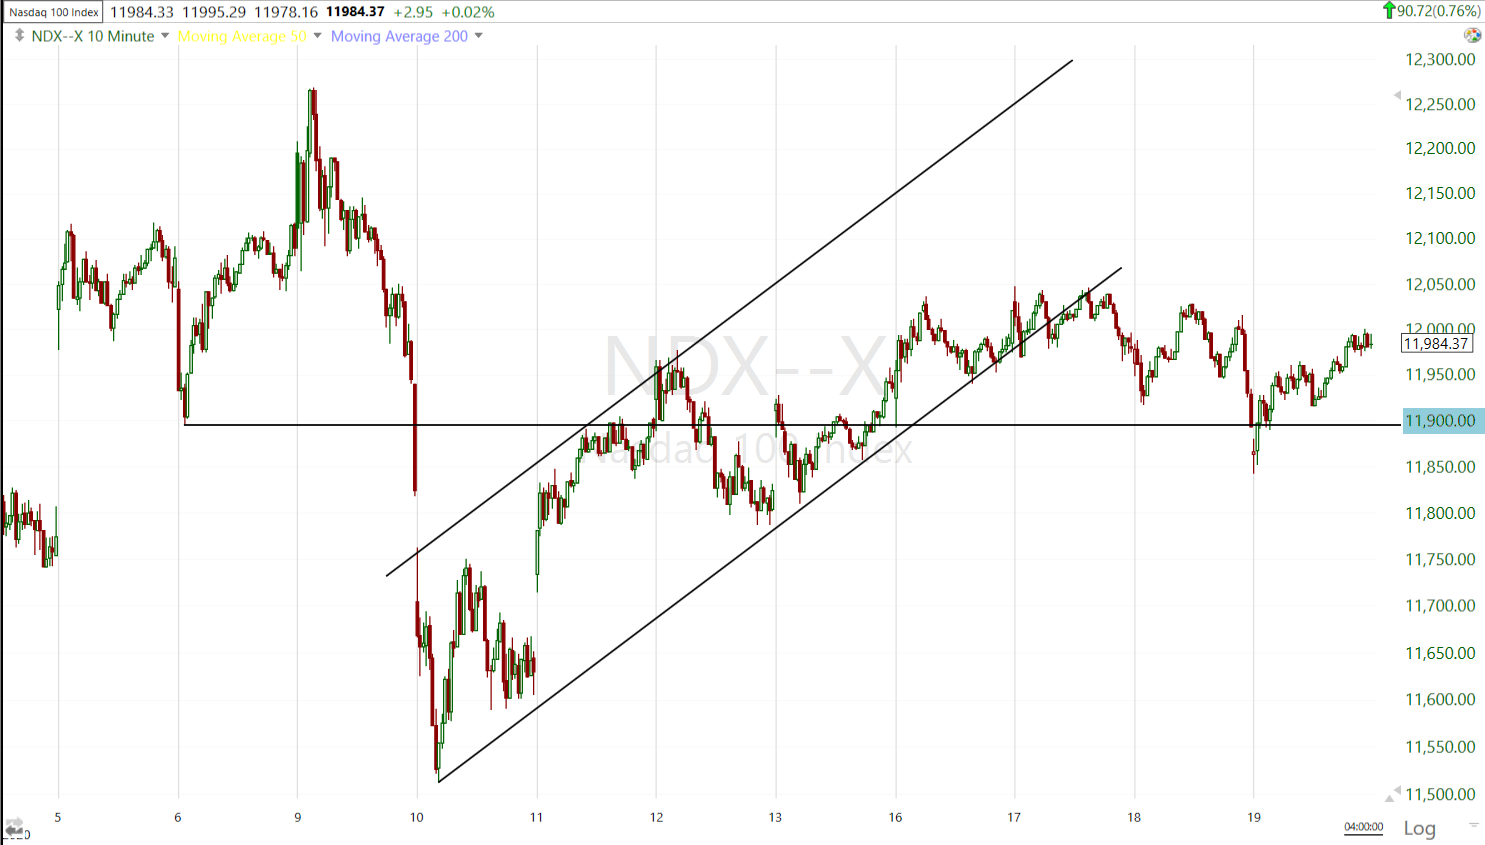 NASDAQ-100 (10m) held the $11,900 level that has been a key near term level for the index.
In economic data Initial claims for the week ending November 14 rose more than expected to 742,000 (consensus 720,000), ending a streak of declining initial claims. Continuing claims for the week ending November 7 decreased by 429,000 to 6.372 million keeping the recent declining streak alive. The report covers the period in which the survey for the November employment report is conducted. The jump in initial claims, which are still exceedingly high, will contribute to expectations for a slowdown in job growth in November.
Existing home sales increased 4.3% m/m in October to a seasonally adjusted annual rate of 6.85 million (consensus 6.49 million). October marked the fifth consecutive month of positive sales gains.
The Conference Board’s Leading Economic Index increased 0.7% m/m in October, as expected, marking the sixth straight month of positive readings. The index for September was unrevised at +0.7%.
The Philadelphia Fed Index decreased to 26.3 in November from 32.3 in October.
Averages
In a somewhat odd day, both NASDAQ and Small Caps outperformed. The former due to relative strength in Technology, the latter due to relative strength in Energy.
S&P 500 ⇧ 0.39 %
NASDAQ ⇧ 0.76 %
DOW JONES ⇧ 0.15 %
RUSSELL 2000 ⇧ 0.84 %
There was nothing surprising or unusual about 3C charts today. They acted as expected for a consolidation day. The more notable development was weakness earlier in the week during price strength due to the Moderna vaccine headlines.
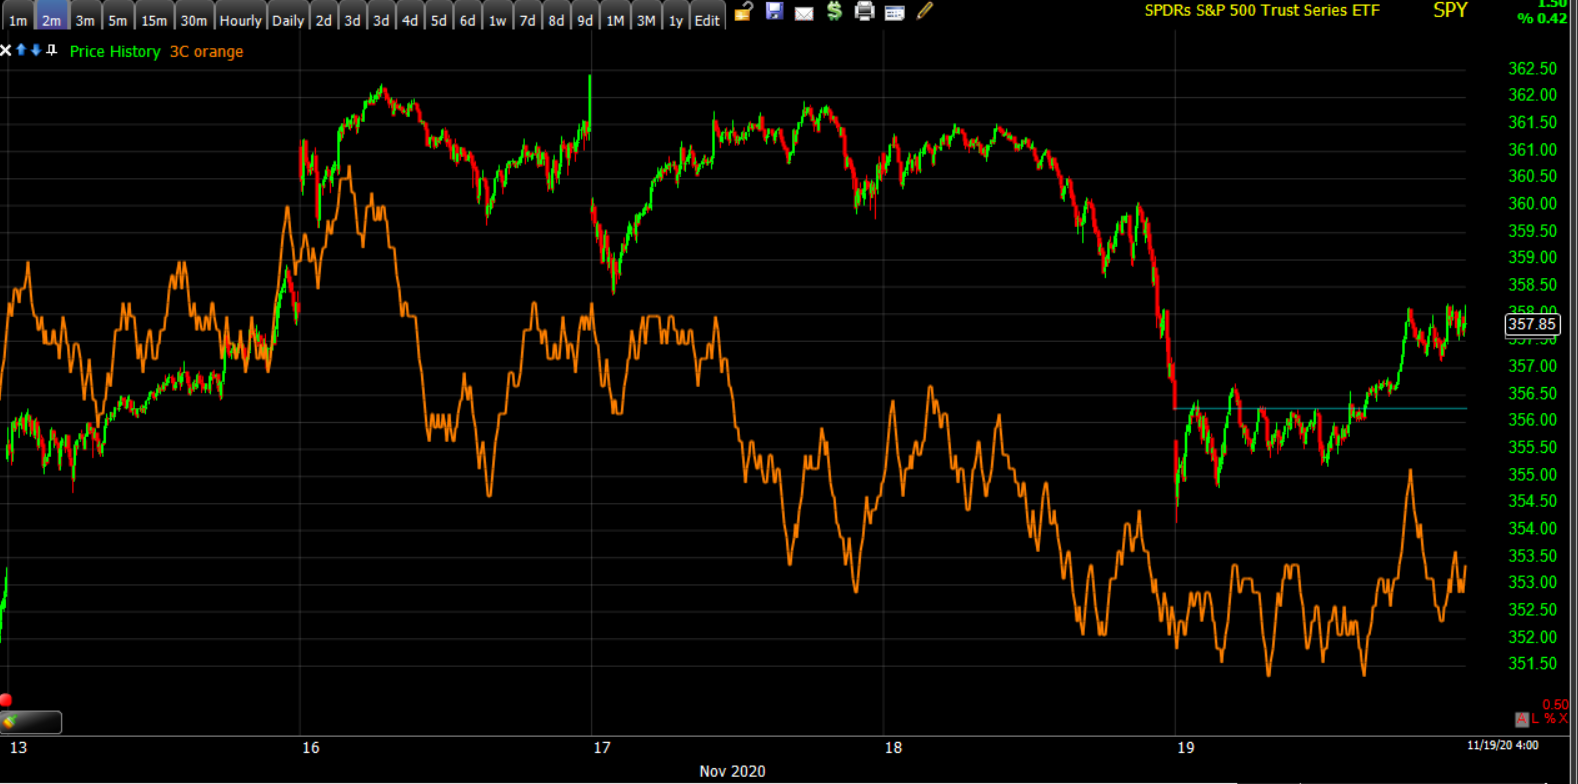 SPY (2m)
S&P sectors
In a somewhat unusual day the secular growth and momentum heavy Tech sector outperformed, and the cyclical/deep value Energy sector outperformed, despite crude oil not doing much.
Within Technology the Philadelphia Semiconductor Index (+1.6%) was a pocket of strength today. NVIDIA (NVDA +0.1%) beat top and bottom-line estimates and issued upside Q4 revenue guidance; Cree (CREE +11.6%) was upgraded to Overweight from Neutral at JP Morgan with a $90 price target.
Utilities were the worst, down for a third day, but don’t appear to be in any immediate trouble with the 50-day moving average -1.6% below.
Materials ⇧ 0.42 %
Energy ⇧ 1.64 %
Financials ⇧ 0.33 %
Industrial ⇧ 0.25 %
Technology ⇧ 0.81 %
Consumer Staples ⇧ 0.27 %
Utilities ⇩ -1.00 %
Health Care ⇩ -0.07 %
Consumer Discretionary ⇧ 0.49 %
Real Estate ⇧ 0.16 %
Communications ⇧ 0.61 %
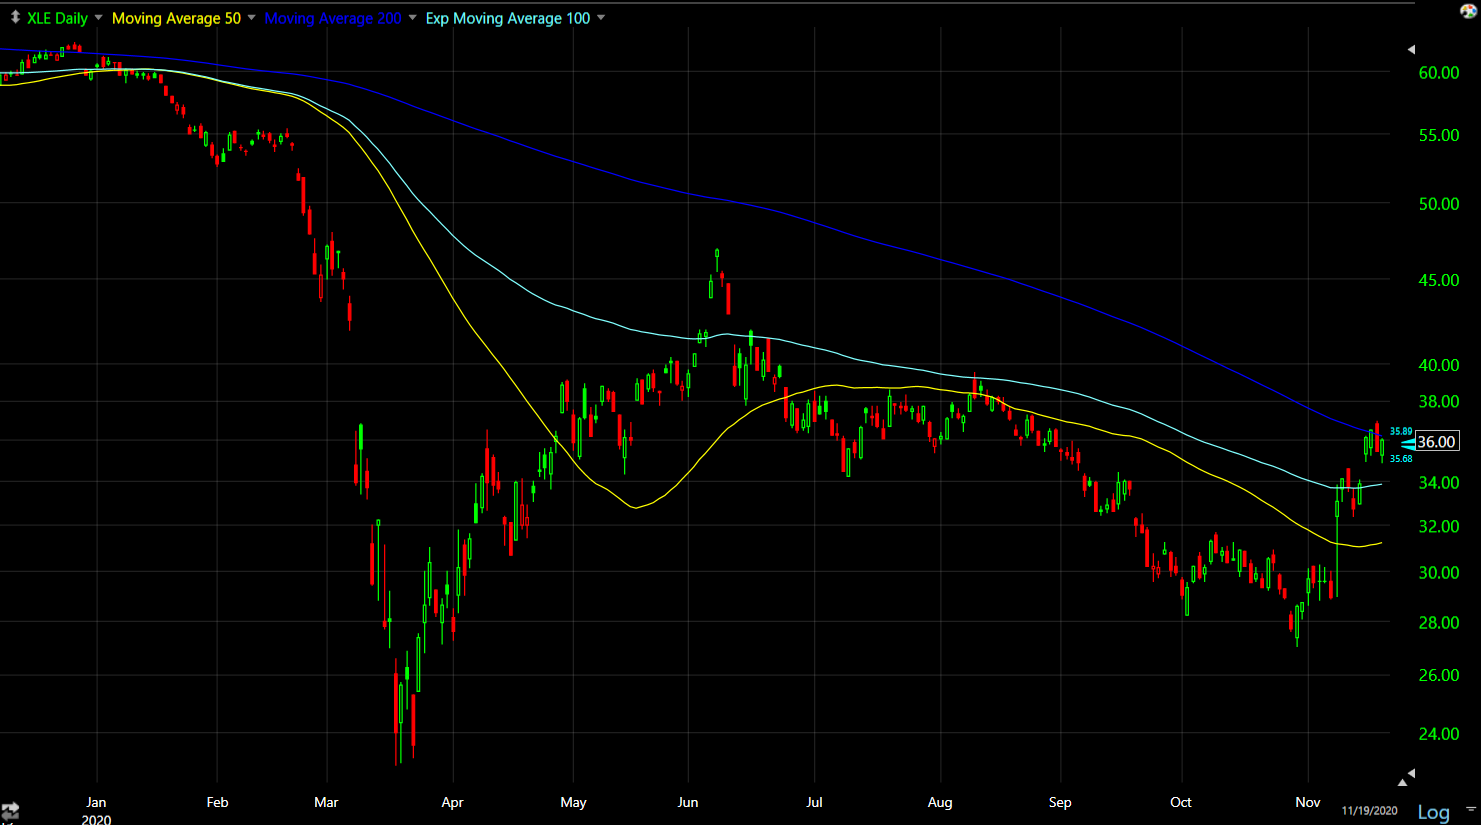 Energy sector (daily) despite the strength today, the sector is still bumping up against the 200-day from below.
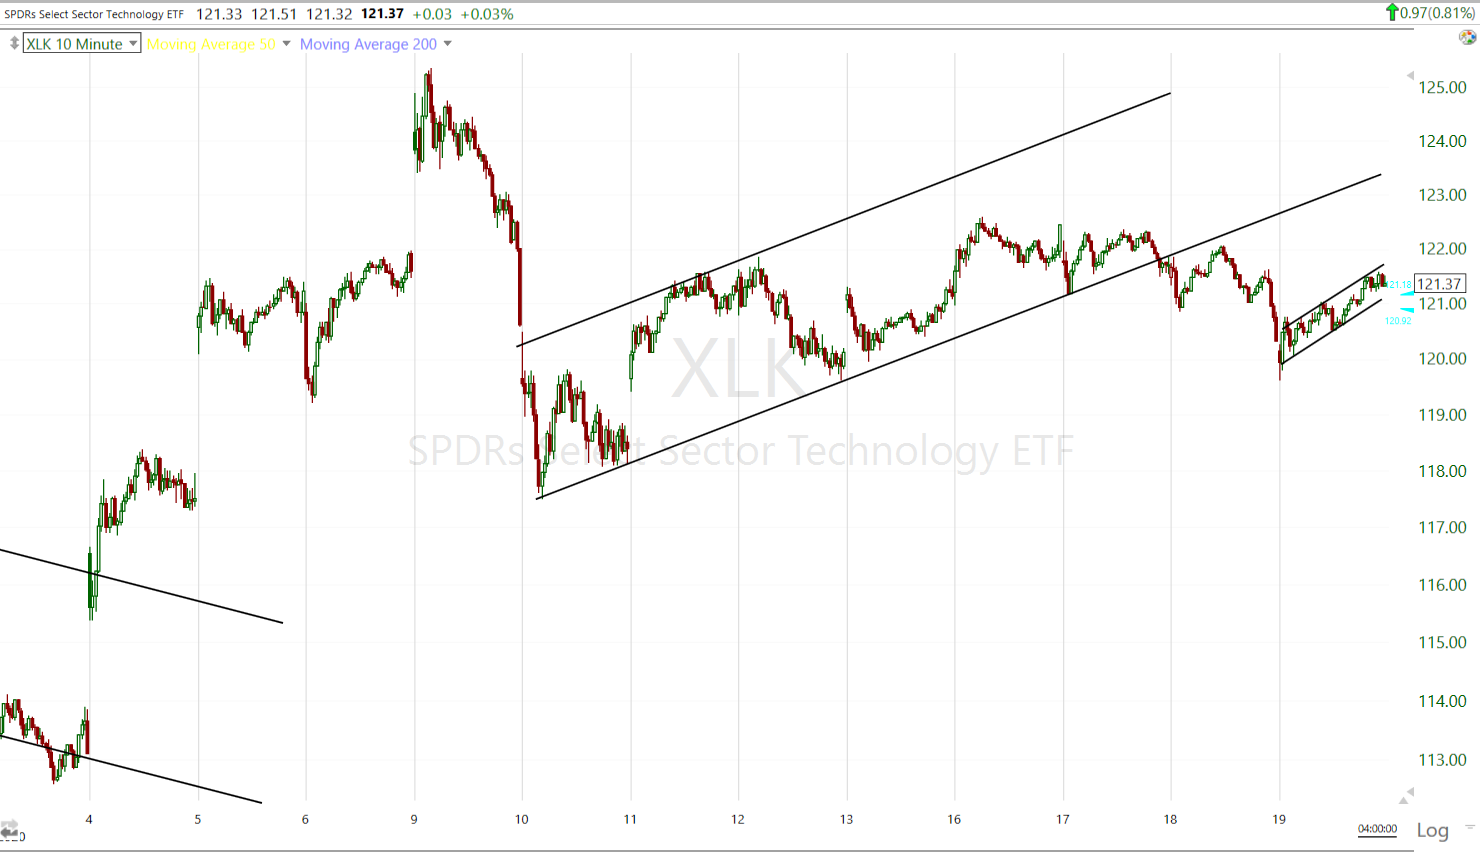 Technology sector (10m) despite the strength today the sector still traced out a small bearish flag like the S&P.
Regional Banks (+0.17%) underperformed the Financial sector (+0.33%) and the KBW Bank index (+0.57%). Meanwhile, the yield curve flattened more increasing the divergence with banks.
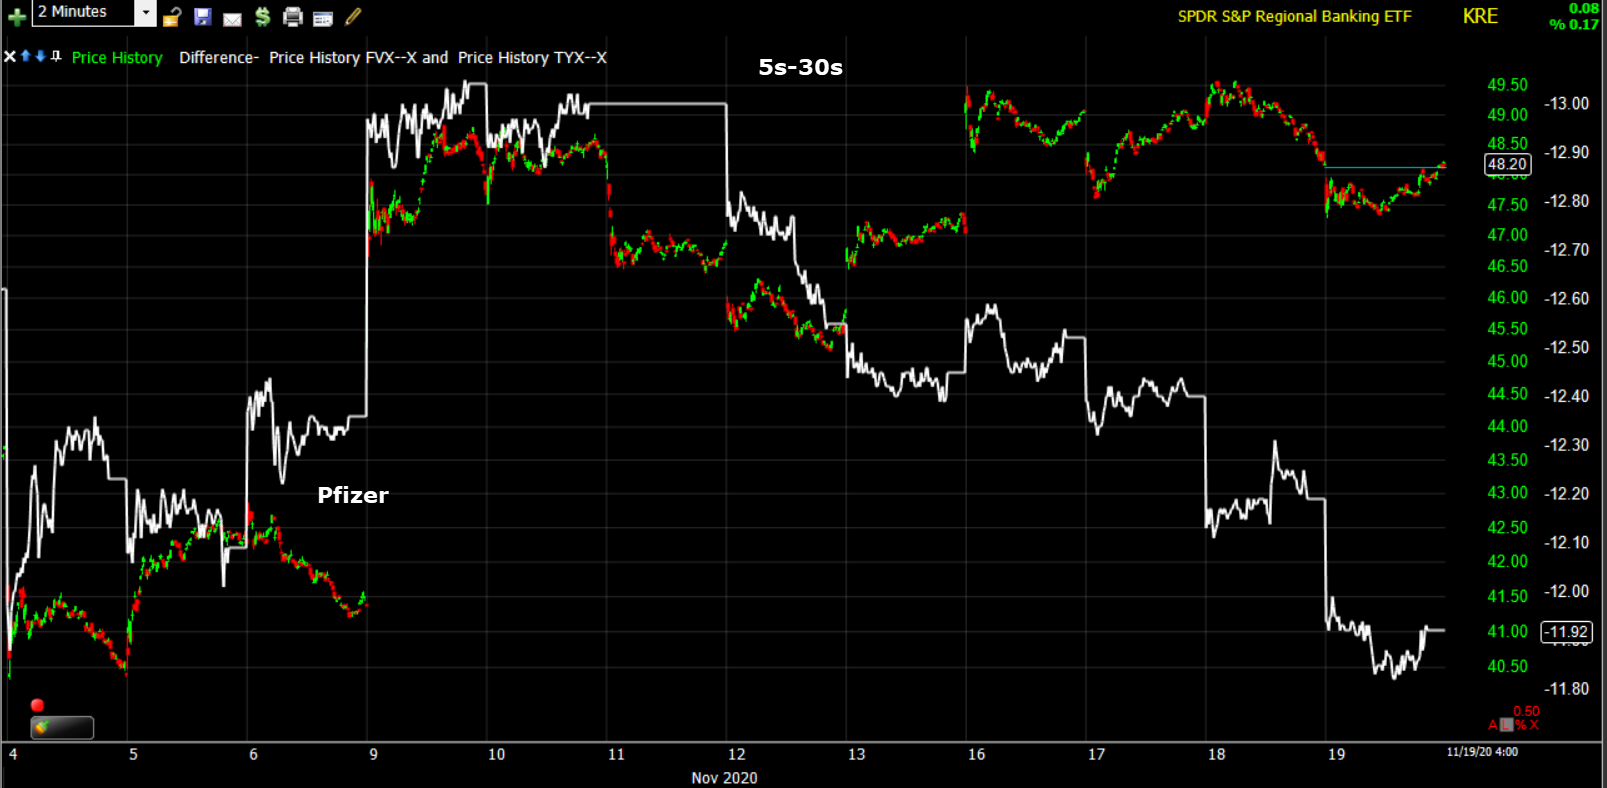 Regional Banks and the 5s-30s yield spread. Notice the yield spread has retraced the entire Pfizer vaccine reflationary steepening.
Internals
NYSE Advancers (1940) outpaced Decliners (1080) on lower volume of 884.5 mln. shares
The Dominant price/volume relationship came in at Close Up/Volume Down, the most bearish relationship. It’s typical of a 1-day overbought condition which internals fall short of, and its typical of a bearish consolidation day.
Treasuries
Longer-dated Treasuries increased again, pushing yields even lower from last week’s highs. The 2-year yield was flat at 0.17%, and the 10-year yield decreased three basis points to 0.85% to further flatten the curve. Like the yield curve, the 30-year yield retraced all of the Pfizer reflationary spike, not something that inspires confidence in the recent value/cyclical stock rotation.
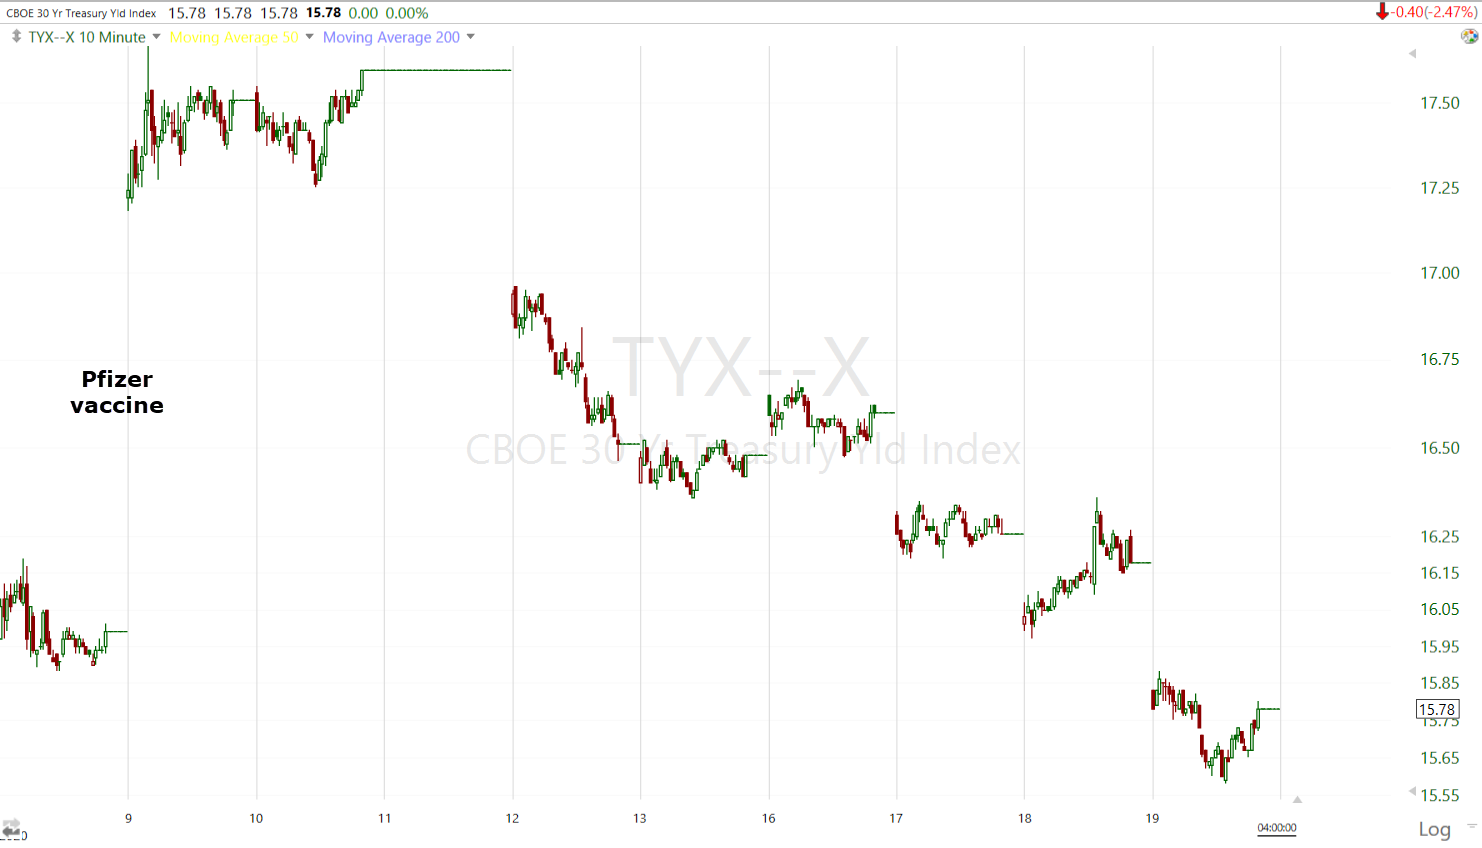 30-year yield (10m)
I think the late May/early June reflationary environment and rotation was the strongest attempt I have seen in the last year or two and it failed, led lower first by yields. In that case the market followed shortly after. In this case it’s not just a lead lower, but an entire retracement. That’s a substantial disagreement between stocks (reflation due to vaccine optimism) and bonds (more concerned about COVID cases increasing and lockdowns). Perhaps bons were pricing in the recent upheaval with regard to the election. Some people at JPM and even Cramer at CNBC have been talking about this as an under-priced risk.
Another safe-haven asset has retraced virtually all of the vaccine spike as well, the Japanese yen or more specifically USD/JPY.
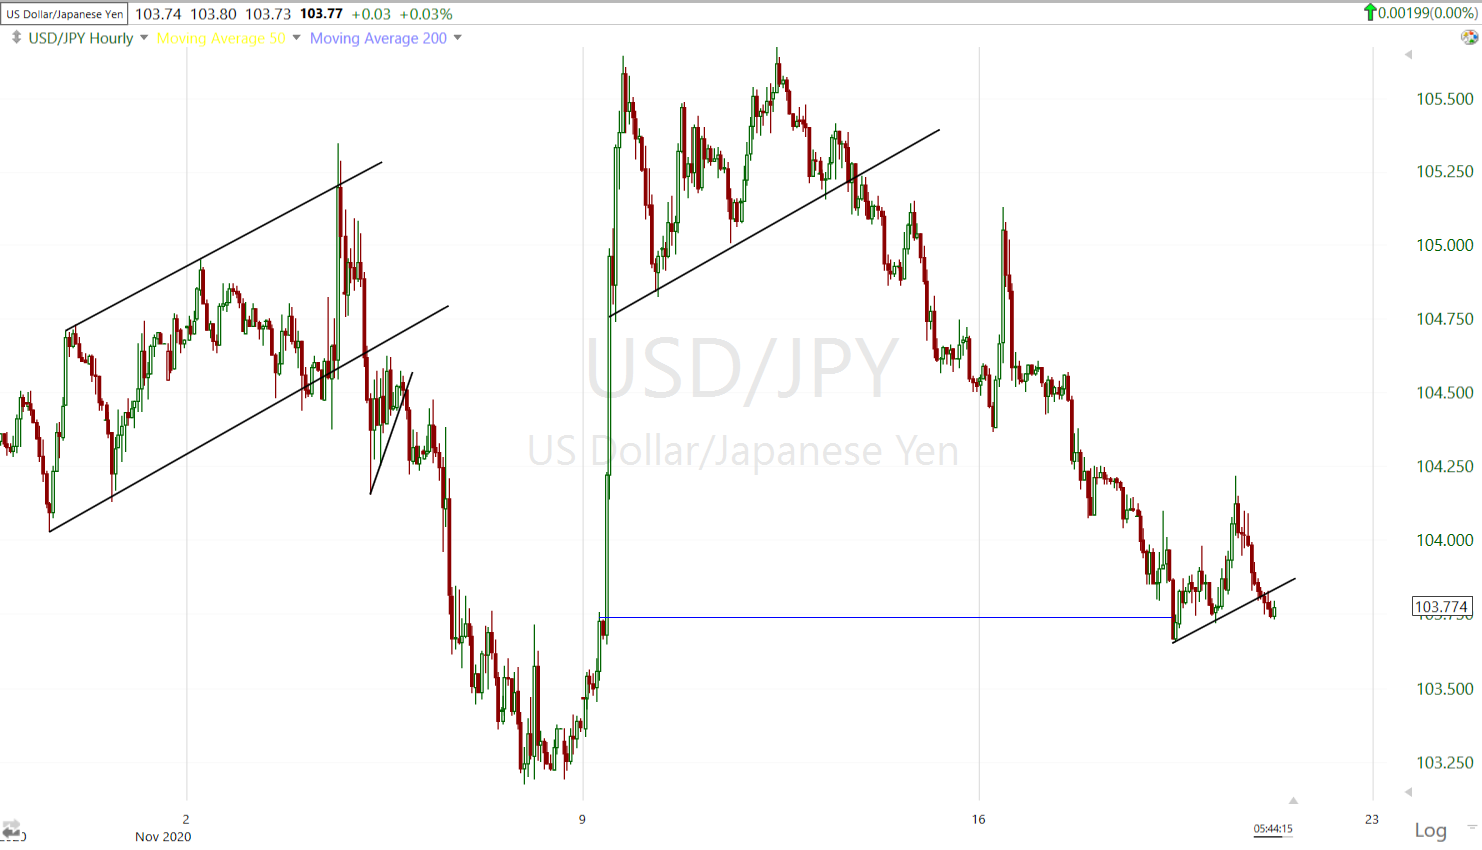 USD/JPY (60m) -also note a similar bearish flag consolidation that actually started before the S&P’s (led) yesterday. Prices started probing below this afternoon even as stocks gained on Schumer’s comments.
Currencies and Commodities
The U.S. Dollar Index decreased -0.1% to 92.27, giving back earlier gains of at least +0.3%. This certainly helped stocks weather the day. The U.S. Dollar Index tumbled more on the Schumer headlines this afternoon.
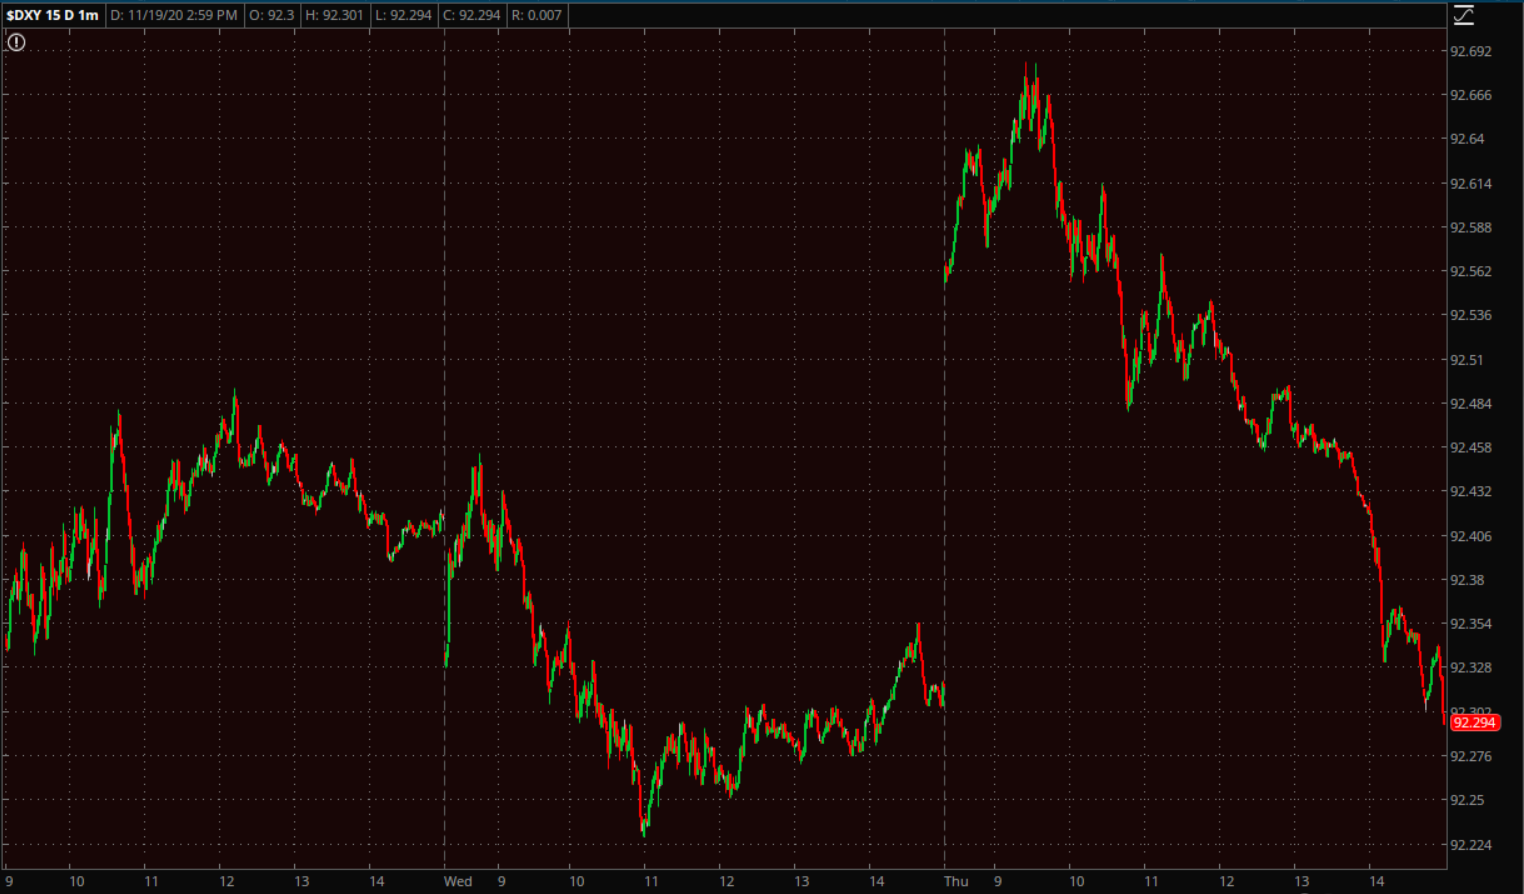 US Dollar Index (1m)
WTI crude futures decreased -0.1% to $41.75/bbl.
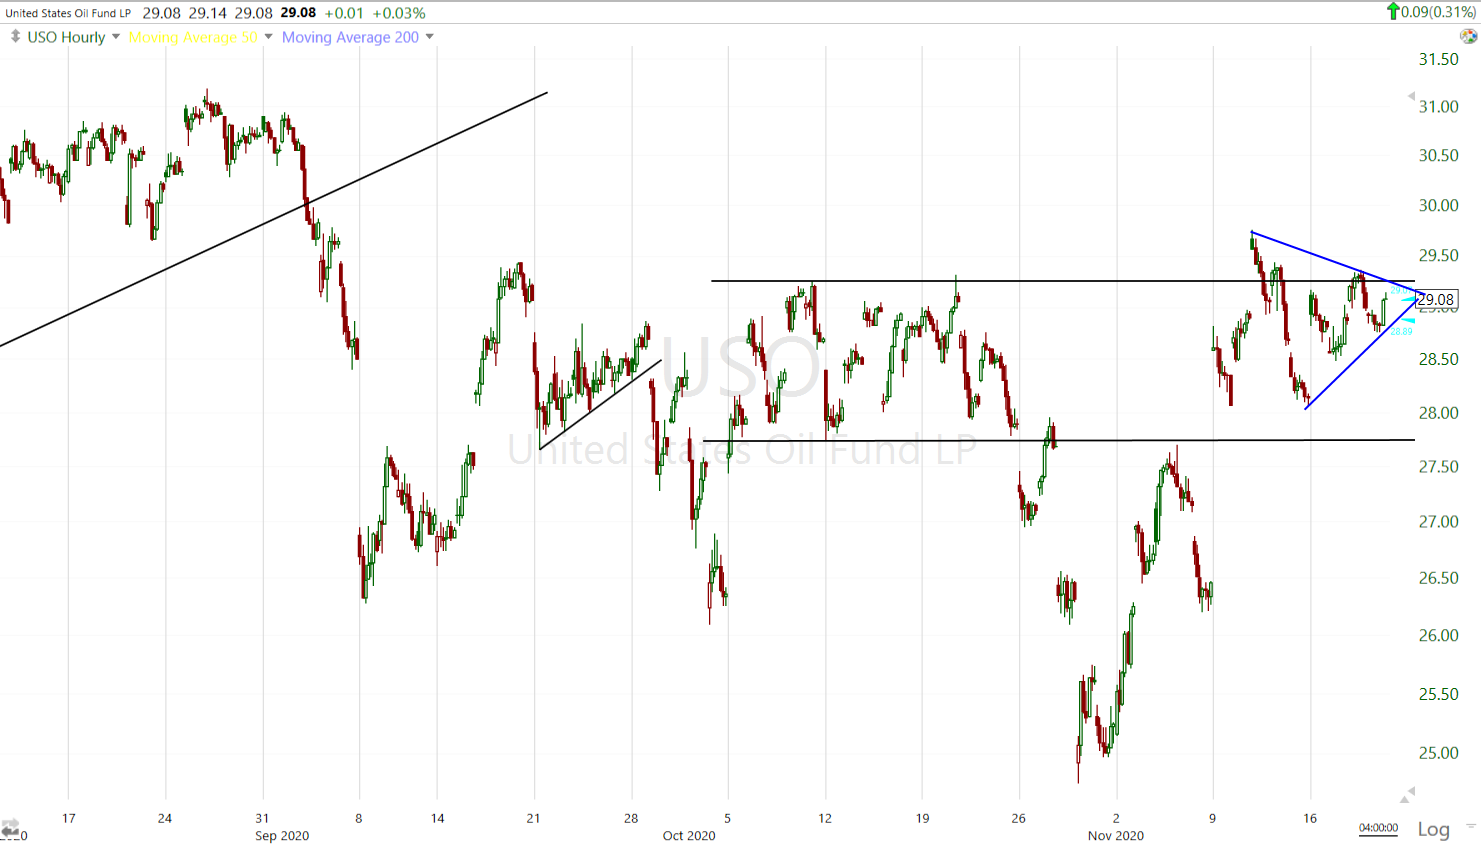 USO (60m) as pointed out, crude is having a hard time with resistance at this range, but this may be a triangle forming, bringing the issue to a head sooner than later.
With regard to the UNG trade idea, most recently covered in last night’s Daily Wrap, in which I noted,
“I’m still looking for price to tag the lower trend line around $10, or perhaps even lower on an equal leg measured move (9.75-ish).”
UNG fell -3.7% today to an intraday low of $9.62, making the full second equal leg lower.
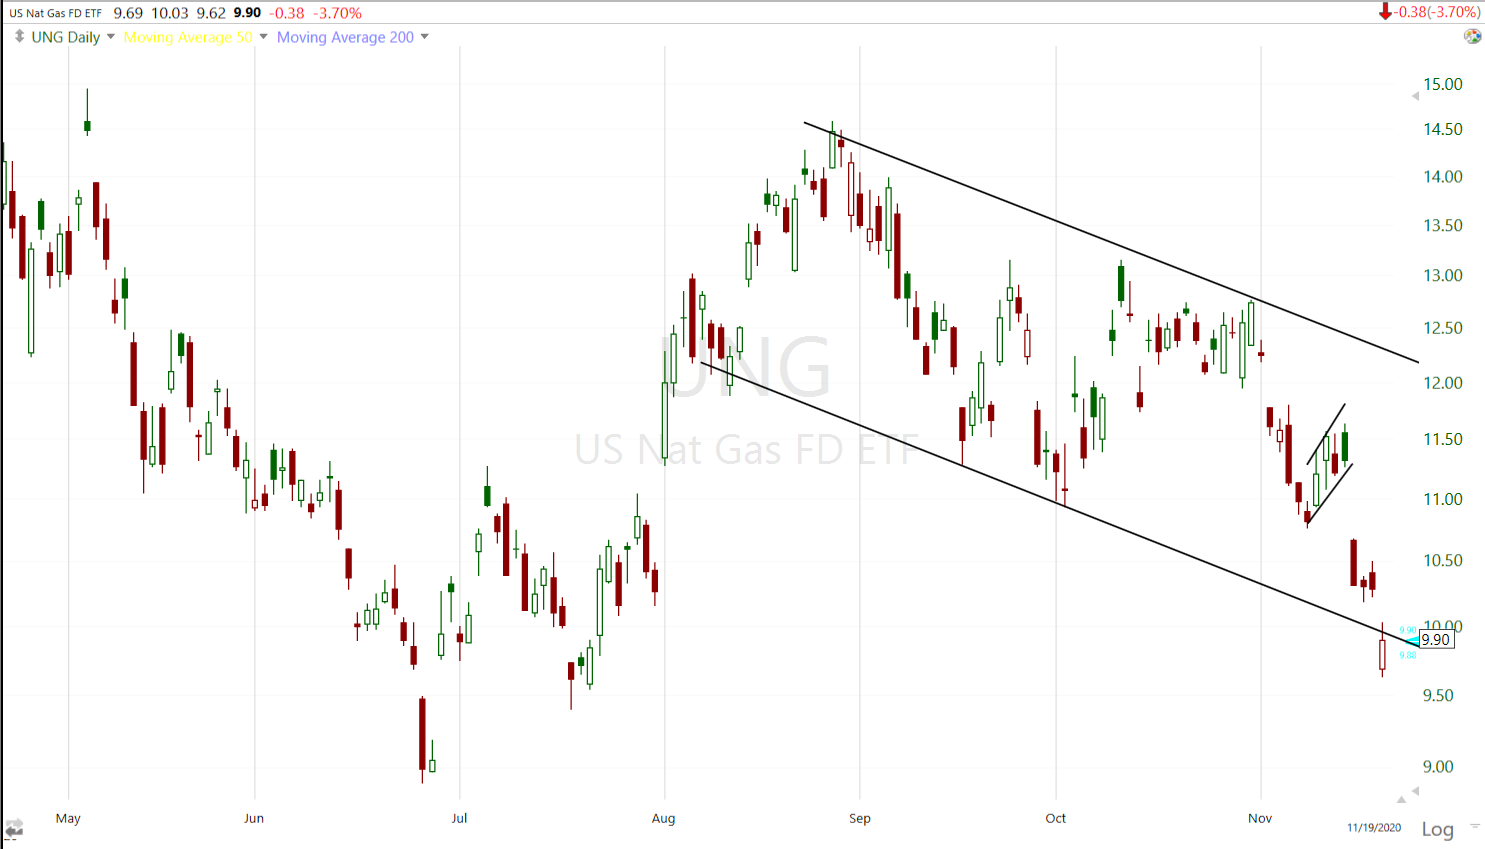 UNG (daily)
In my view price validated the lower trend line in respecting it as resistance intraday.
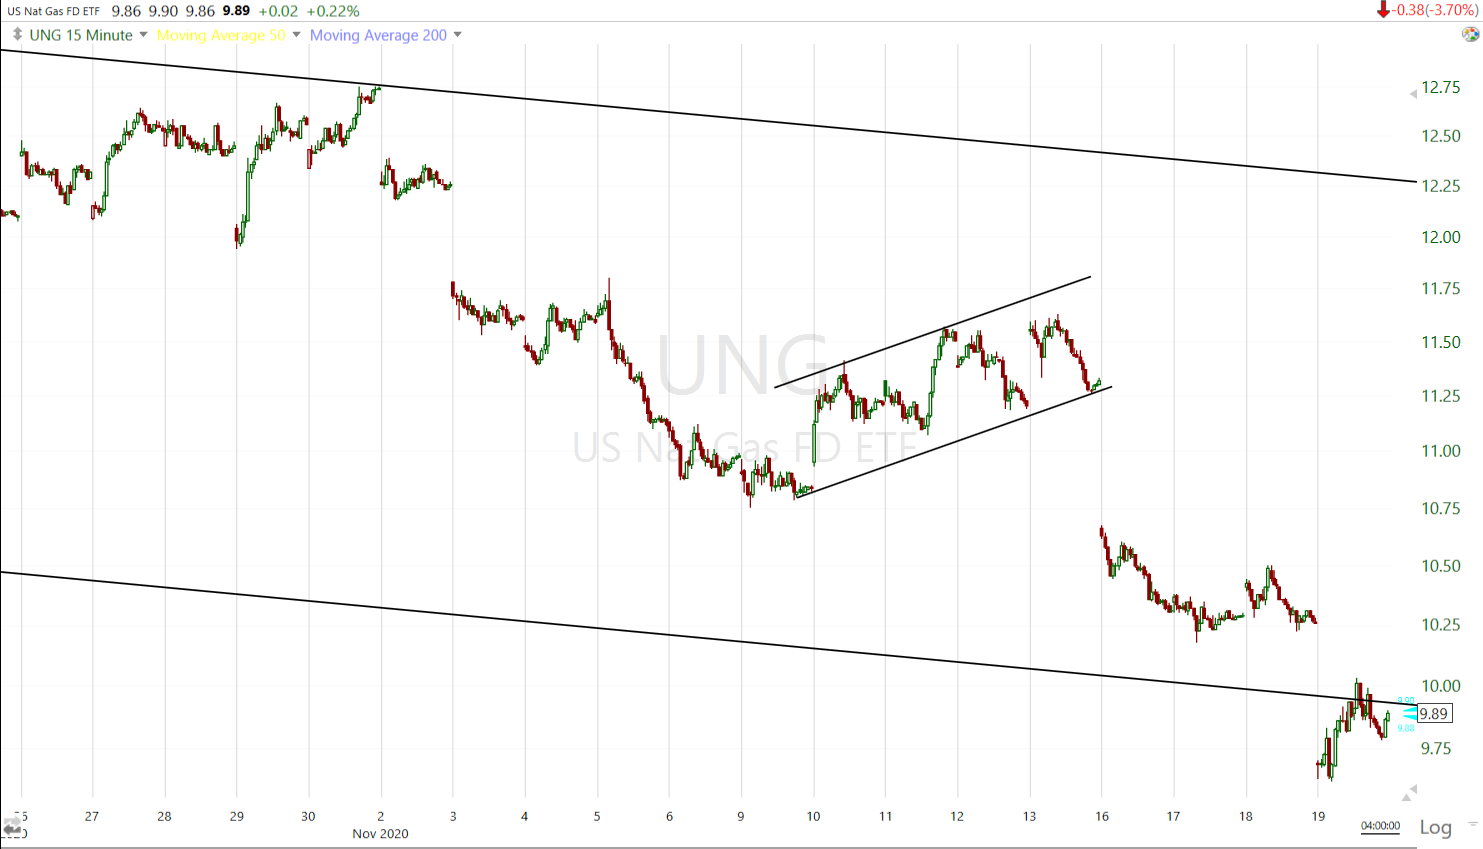 UNG (15m)
This is still high on my watchlist as a trade idea. The plunge below the channel may be a channel buster. The break of the trend line can serve to shake out weak-handed longs and draw in greedy shorts that later are squeezed. Like yesterday, I still want to see some evidence of price stabilizing and/or buying activity on 3C pick up. Here’s another note on the potential trade and set-up from November 17th. To be clear, price falling below the trend line does not invalidate the trade idea/set-up, it could even enhance it.
Speaking of recent potential trade ideas, Gold futures fell another -0.6% to $1,861.50/oz.
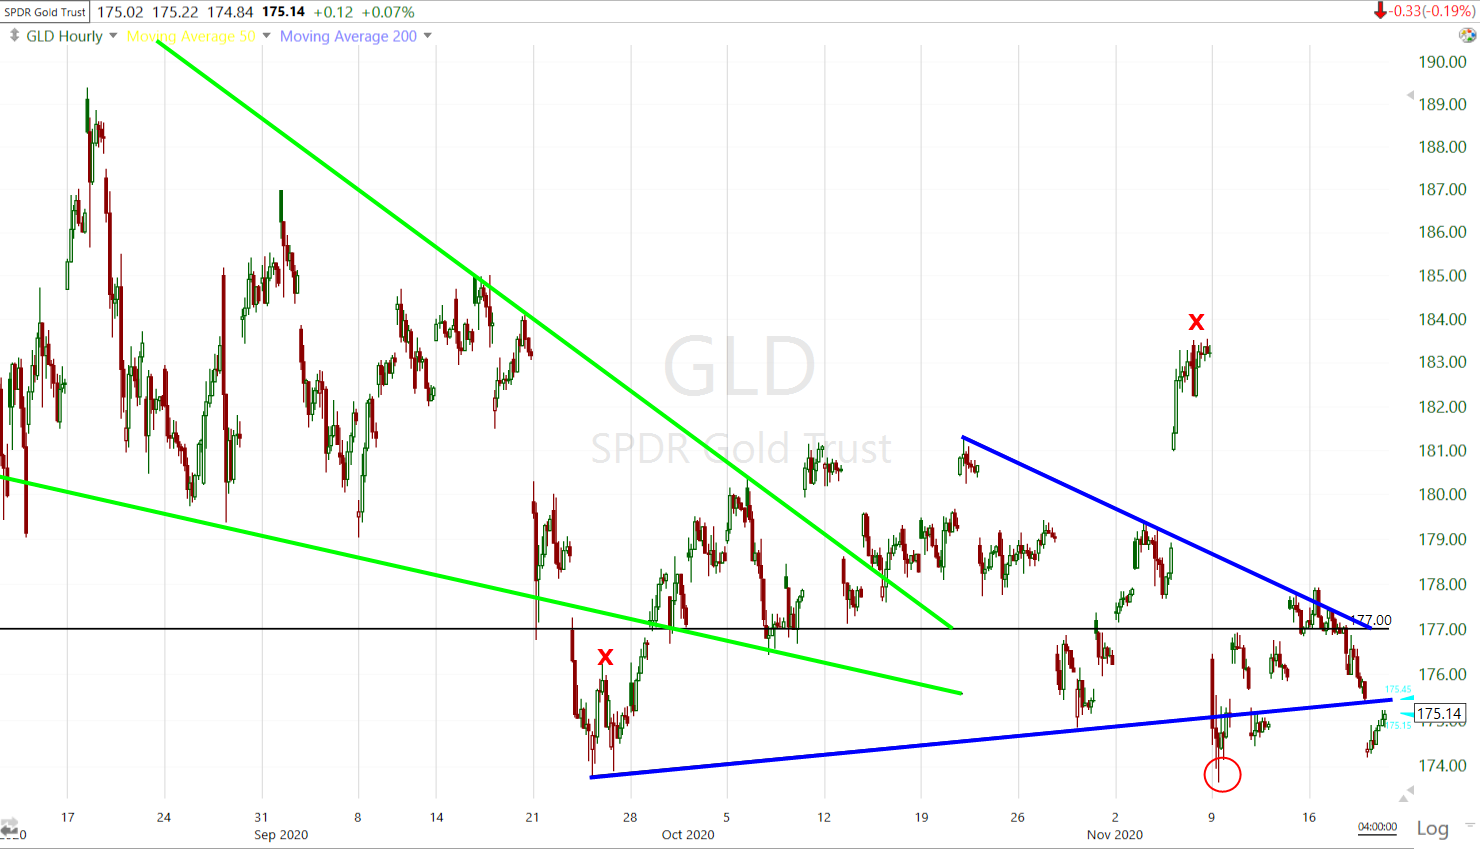 GLD (60m) trading below the recent triangle (blue). In this case I would have preferred price held the trend line reached yesterday. This could still turn out to be an interesting long trade as prices are even closer to the November low/stop, but I do have to see something that convinces me gold is really getting its act together. It had a very bullish 2.5 month wedge consolidation (green) that failed and has had a few opportunities to get back on track and has failed to do so. As I said last night, the most appealing aspect of a long trade here is that a stop (November’s low) is so close the risk is fairly small, but I don’t see much else from gold yet that’s enticing me.
Gold Miners (GDX) may add some color in coming days.
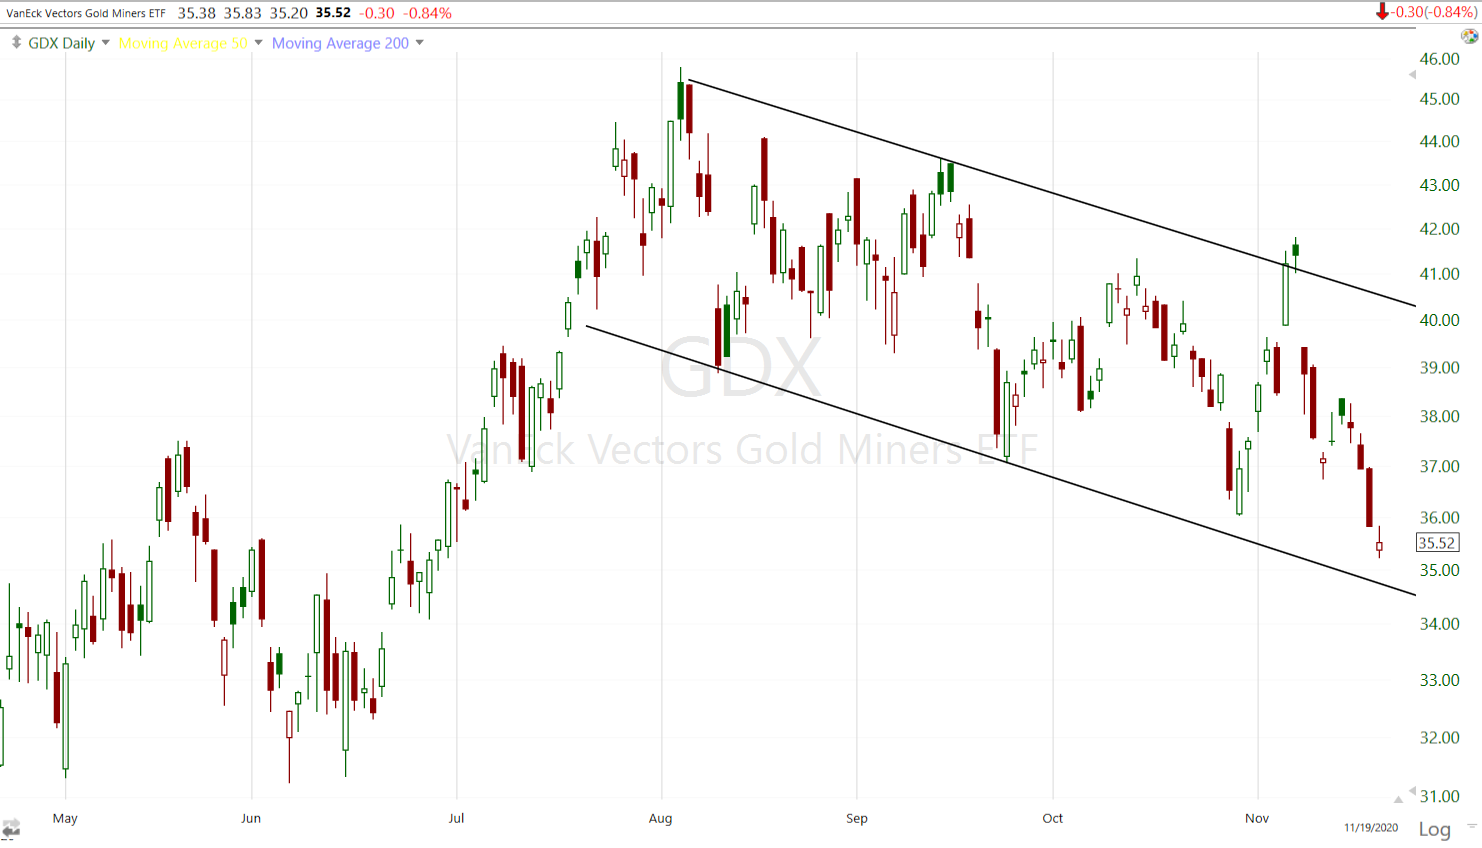 GDX (daily) This could be a large bull flag similar to UNG’s price pattern. GDX tagged its 200-day today at $35.28 and held. GDX has led gold in the past so it’s worth keeping a close eye on.
The more yields fall (10-year), the better the environment in my view for gold since gold has had a strong inverse correlation with real yields (=nominal yields less inflation).
Bitcoin is trading or consolidating around $18,000, which if nothing else can act as psychological resistance. Large whole numbers (like Dow 30,000) often do. Imagine you were one of the people who sold your family’s house to live in a van in 2017 to buy Bitcoin at 18,000 (or higher). It’s been a rough couple of years with the wife and kids showering at parks. You may have told your wife for the past 3 years, “If it just gets back to 18,000 we’ll sell”. Most of us have been there before (maybe not showering at parks), “If it just gets back to where I bought it”. And if you don’t think the psychological component is real, ask yourself why retail stores never mark an item at $10.00. It’s usually $9.99, or $9.88, because they understand the mind’s affinity for whole numbers.
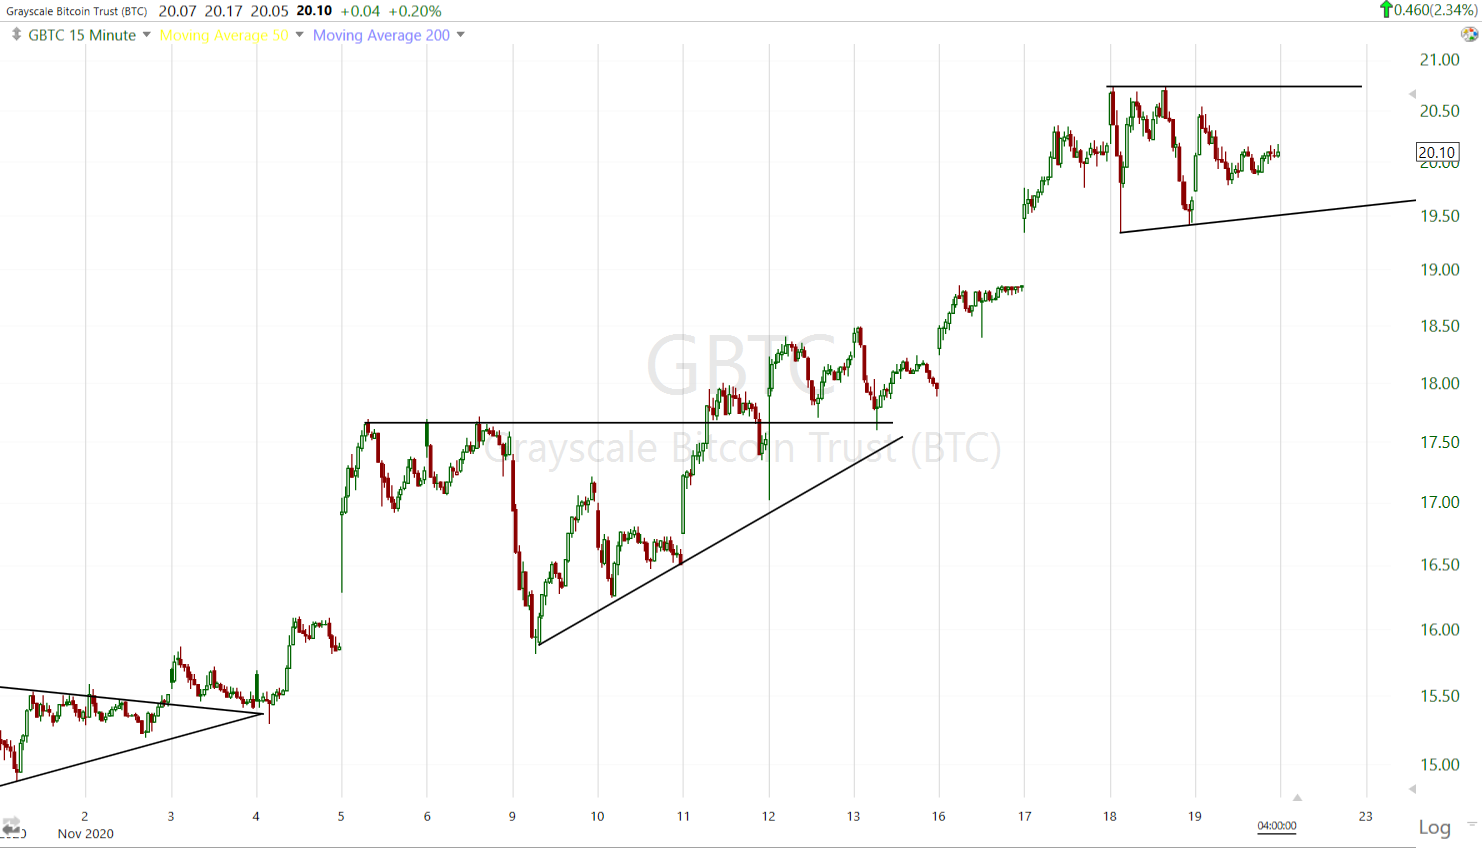 GBTC +2.35% (15m). This “may” be a consolidation triangle, either a symmetrical triangle or a more bullish ascending triangle. Price only fell 1% short of the measured move ($21) where the next consolidation was expected, and that was on a 17% leg up, so pretty darn close. With the recent increased price volatility I’d prefer prices consolidated some more and the volatility calmed down, which would be evident in a triangle as the price range narrows.
Given the recent run (this trade is already a double for me in a few months), the proximity to the expected measured move and next consolidation, the proximity to 2017 highs where many people bought in the midst of a historic speculative frenzy, and the psychological component of 18k, I think a decent consolidation here is reasonable and constructive. I intend to hold unless I see something that suggests otherwise.
Summary
A lot happened this afternoon between Schumer’s comments that suggested stimulus talks were back on and the Republican retort that this was not the case. President Trump’s legal team held a lengthy press conference making clear they’ll challenge the election results. After the close U.S. Treasury Secretary Steve Mnuchin and the Fed clashed.
Mnuchin sought the return of unused funds from the Fed’s emergency lending facilities, but in a rare moment of open disagreement, the central bank pushed back and said the programs served a vital role. Mnuchin sought a 90-day extension for four programs, but requested others expire on schedule on Dec. 31 and the Fed return $455 billion to the Treasury so Congress can spend the money elsewhere.
The International Monetary Fund and Group of 20 nations warned that fresh restrictions on households and companies due to the resurgence of Covid-19 are a risk to the global economic recovery. The IMF noted progress on a vaccine, but also said elevated asset prices point to a disconnect from the real economy and a potential threat to financial stability.
Picking up on that note, John Hussman’s latest note said the valuation of U.S. stocks has never been more extreme, even at the 1929 and 2000 market peaks. Hussman pointed out that he has intentionally excluded the impact of pandemic GDP and profit weakness, which would otherwise make this measure even more extreme. Hussman continues to expect the S&P 500 Index to lose two-thirds of its value over the completion of the current market cycle.
“…we’re also well aware of how closely the speculative features of this market resemble the pre-crash peaks of August 1929 and March 2000, as well as lesser ones like January 1972 August 1987, and October 2007.”
I feel pretty good about the recent S&P short, VXX long and Regional Bank short. I offered a near term downide measured move target for the S&P in one of today’s Market Updates. I think that’s a reasonable probability and nothing I saw today changed that. I think both yields and currencies are supporting the idea of near term downside for stocks and that’s a disagreement between asset classes that has been building since the middle of last week. That’s to say nothing of the S&P’s broadening top where prices once again found resistance this week.
Overnight
A lot happened this afternoon and after the close. S&P futures are down -0.7% and back below the consolidation trend that started last night.
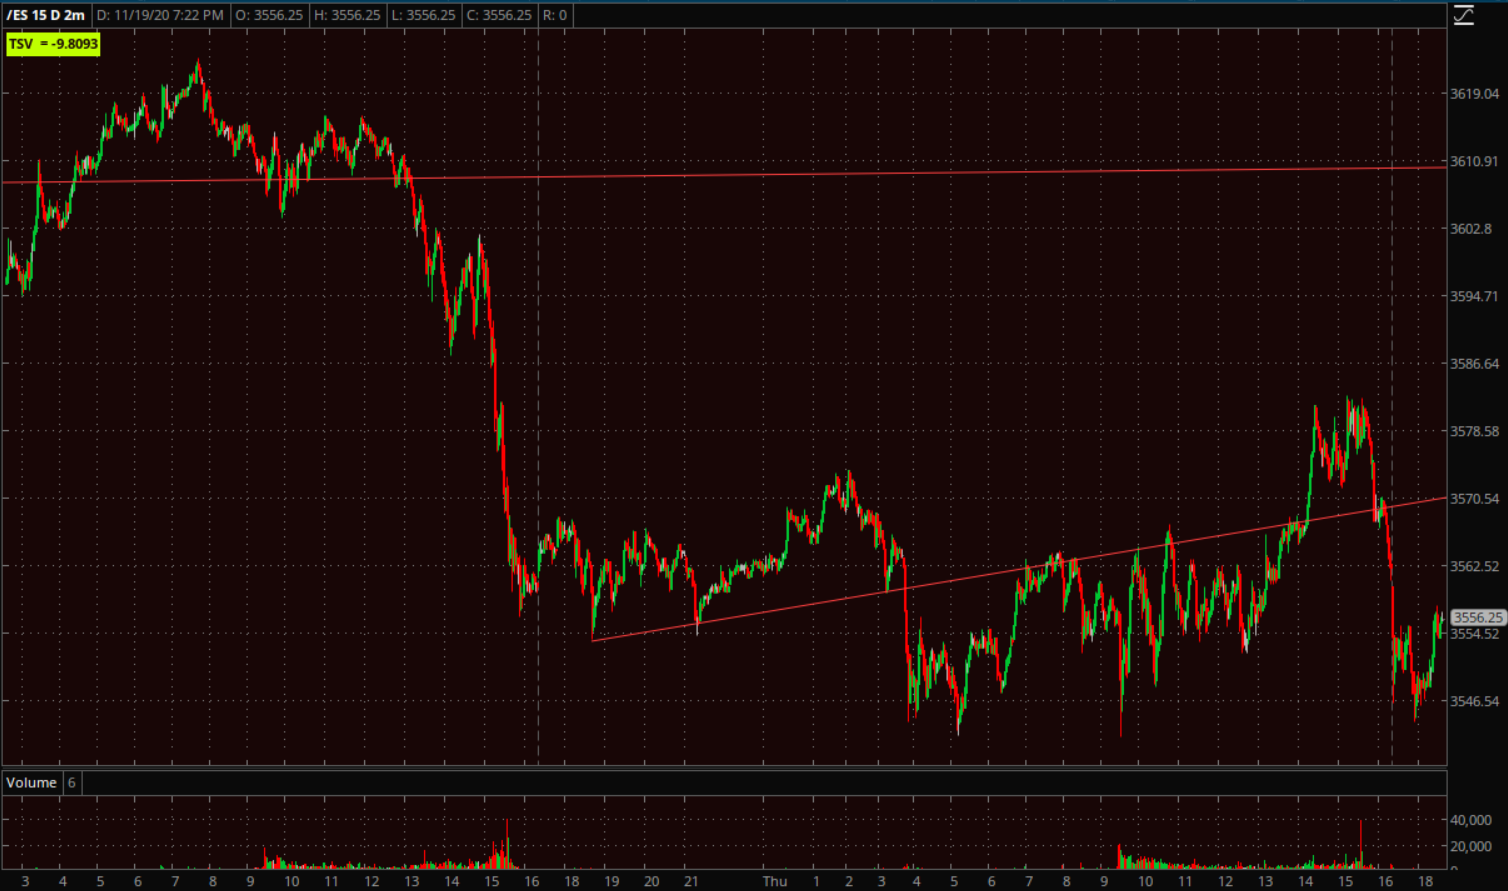 S&P futures (2m) – prices may gravitate toward the trend line and while it’s not a perfect consolidation pattern anymore, it serves the same purpose.
NASDAQ futures are down less (relative strength), and Russell 2000 futures are down more (relative weakness), which is a more defensive posture from index futures.
I suspect price gravitates to the S&P’s trend line in part because of VIX futures.
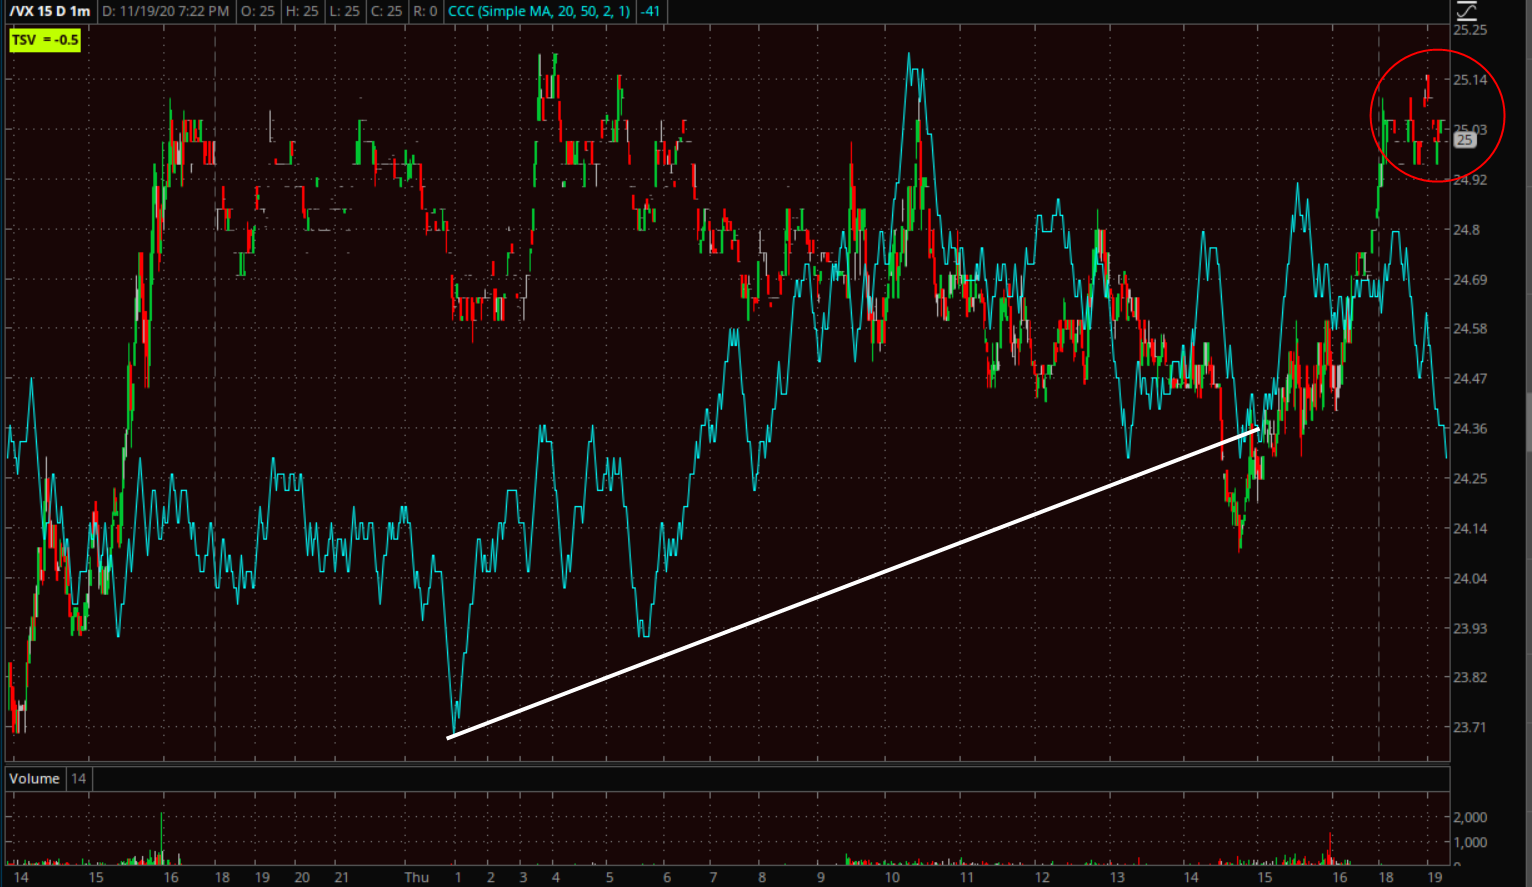 VIX futures (2m) have traded in their own consolidation today, closer to a bull flag with 3C positively diverging. There is a touch of weakness in 3C at near $25 early in the overnight session. This may have something to do with options expiration tomorrow. It’s still very early in the overnight session and this isn’t a big divergence, it simply is what it is presently. It certainly doesn’t change the positive 3C tone throughout the day.
Treasury futures are trading at new highs for the day/week (yields lower), which is probably why small caps are displaying relative weakness tonight.
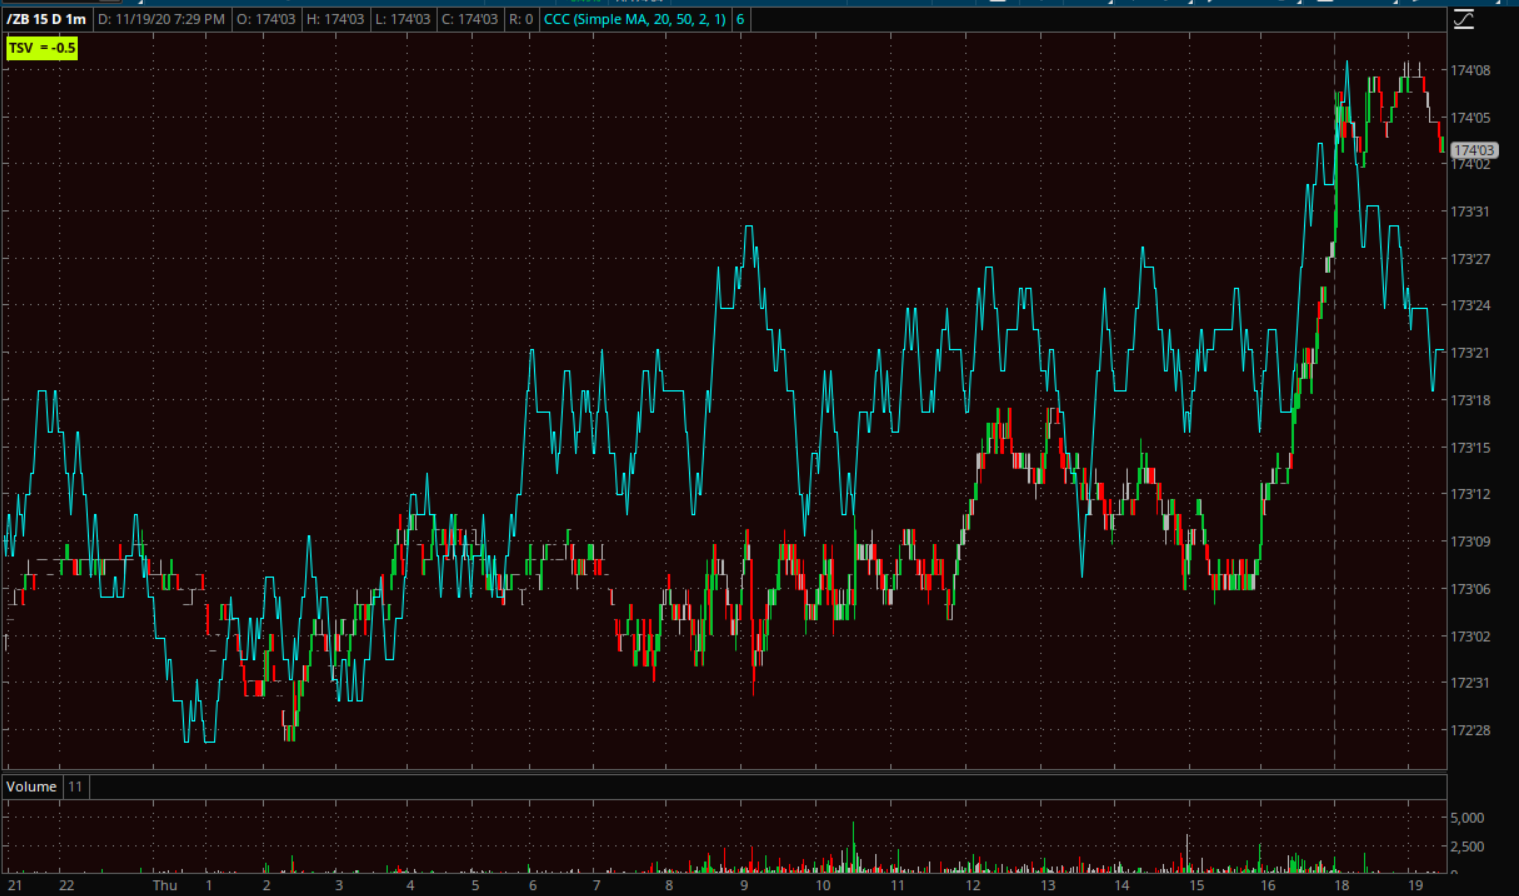 30-year Treasury Futures (1m) and 3C is confirming the upside.
This is actually a very key area for the long bond. I’ll illustrate using TLT’s price chart.
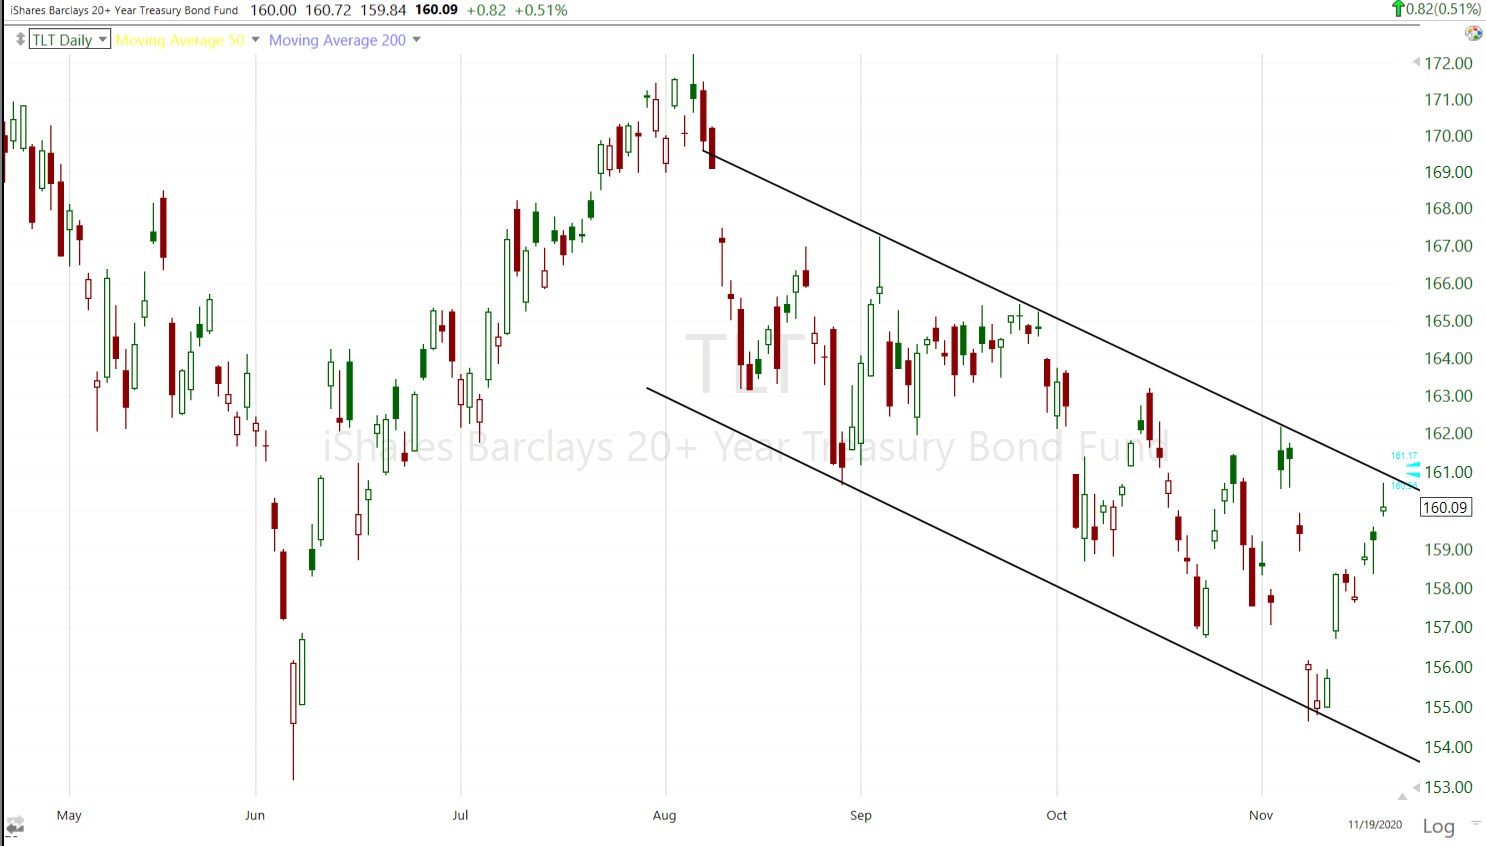 TLT (daily) with a clear down trending channel (higher yields) as the equity market has increasingly been pricing in a reflationary event and rotation to value/cyclicals. This chart is as of the cash close, obviously this is a key are because of the trend. If I add in after market data…
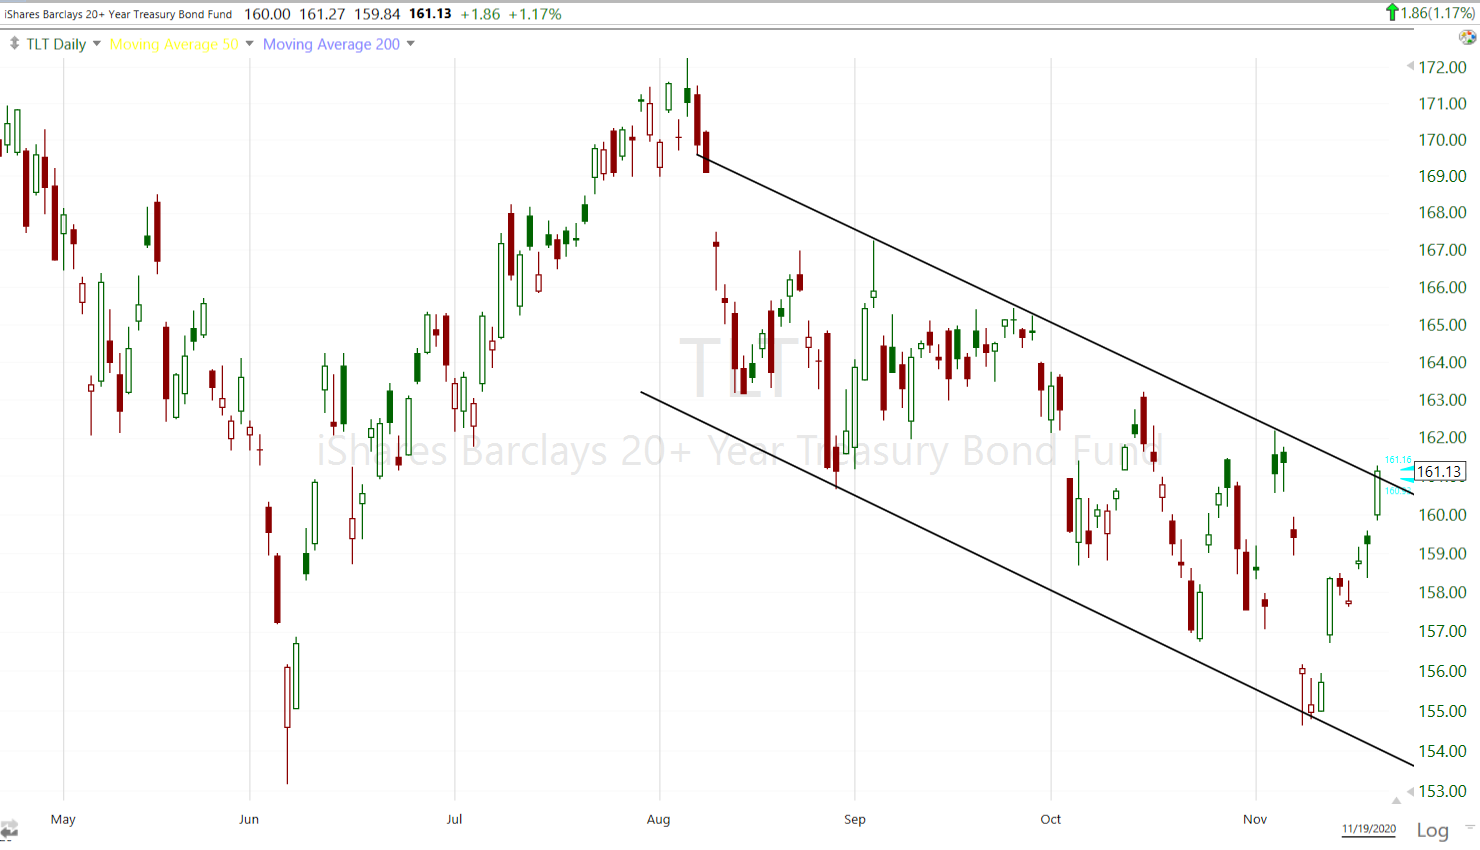 TLT (daily w/ extended hours) price is just peaking above. A change of trend here would be a major development and a major blow to the reflation/cyclical/value trade, not to mention a net-negative for the broader market, although I expect Tech, mega-caps and NASDAQ would fare better on a relative basis, while small caps, cyclicals and value would fare worse on a relative basis.
Keep a close eye on USD/JPY too.
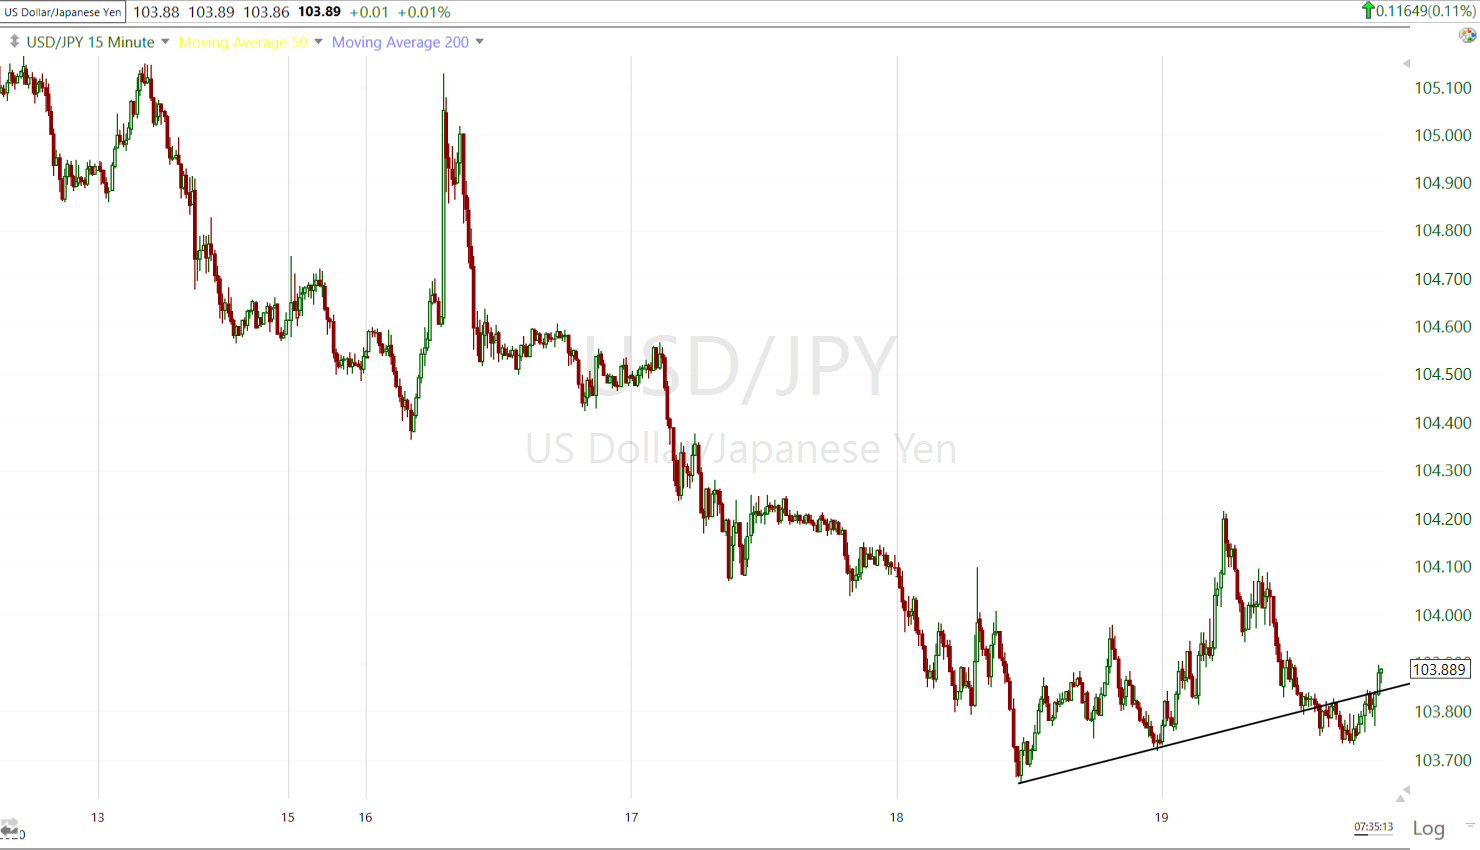 USD/JPY (15m) for my purposes this is the same consolidation as the S&P from last night. Price is above the trend line which is another reason I suspect S&P gravitates toward its trend line overnight. Beyond that and beyond tomorrow, I think the probabilities favor the downside for stocks.
There is no notable U.S. economic data out on Friday.