Stock Market Wrap
Index futures gained overnight on re-opening hopes, but the S&P pared cash session gains of as much as 2%. Positive reopening news included California announcing plans to reopen parts of its economy as early as Friday, joining a growing list of U.S. states to have already opened or outlined plans. Starbucks (SBUX +1.4%) said it expects to have 85% of its U.S. stores open again by the end of the week, excluding dine-in service.
Shortly after the open numerous cyclical sectors faded at local resistance.
 Materials (15m). The Energy sector was another that first hit local resistance, then gave back substantial early gains.
However, a handful of mega-cap stocks like Apple, supported the Technology sector, which in turn supported the broader market throughout the afternoon, along with Health Care, but the S&P didn’t make any further upside progress.
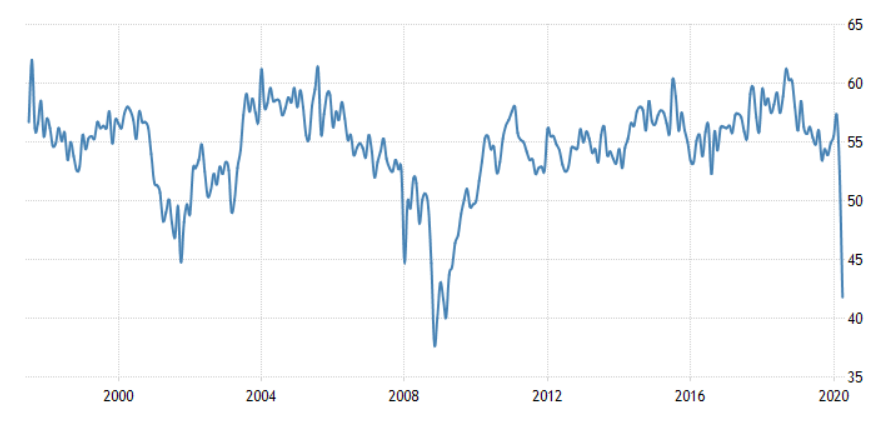
The market looked past less-than favorable news. The ISM Non-Manufacturing (Services) Index for April fell into contraction territory (below 50) with a 41.8% reading, from 52.5. The figure pointed to the first contraction in the services sector since December of 2009 and the sharpest since March of 2009.
In other unfavorable news, United Airlines (UAL -4.5%) warned it will likely cut 30% of its management and administrative staff in October, and Norwegian Cruise Line Holdings (NCLH -22.6%) expressed “substantial doubt” about its future. As a reminder, the airlines and cruise lines were among the stocks that drove the market higher early last week as part of the re-opening rally. Norwegian rallied 51% in 3 days. Just 3 days later and the stock has given back almost all of the move as the company expresses substantial doubt over its future.
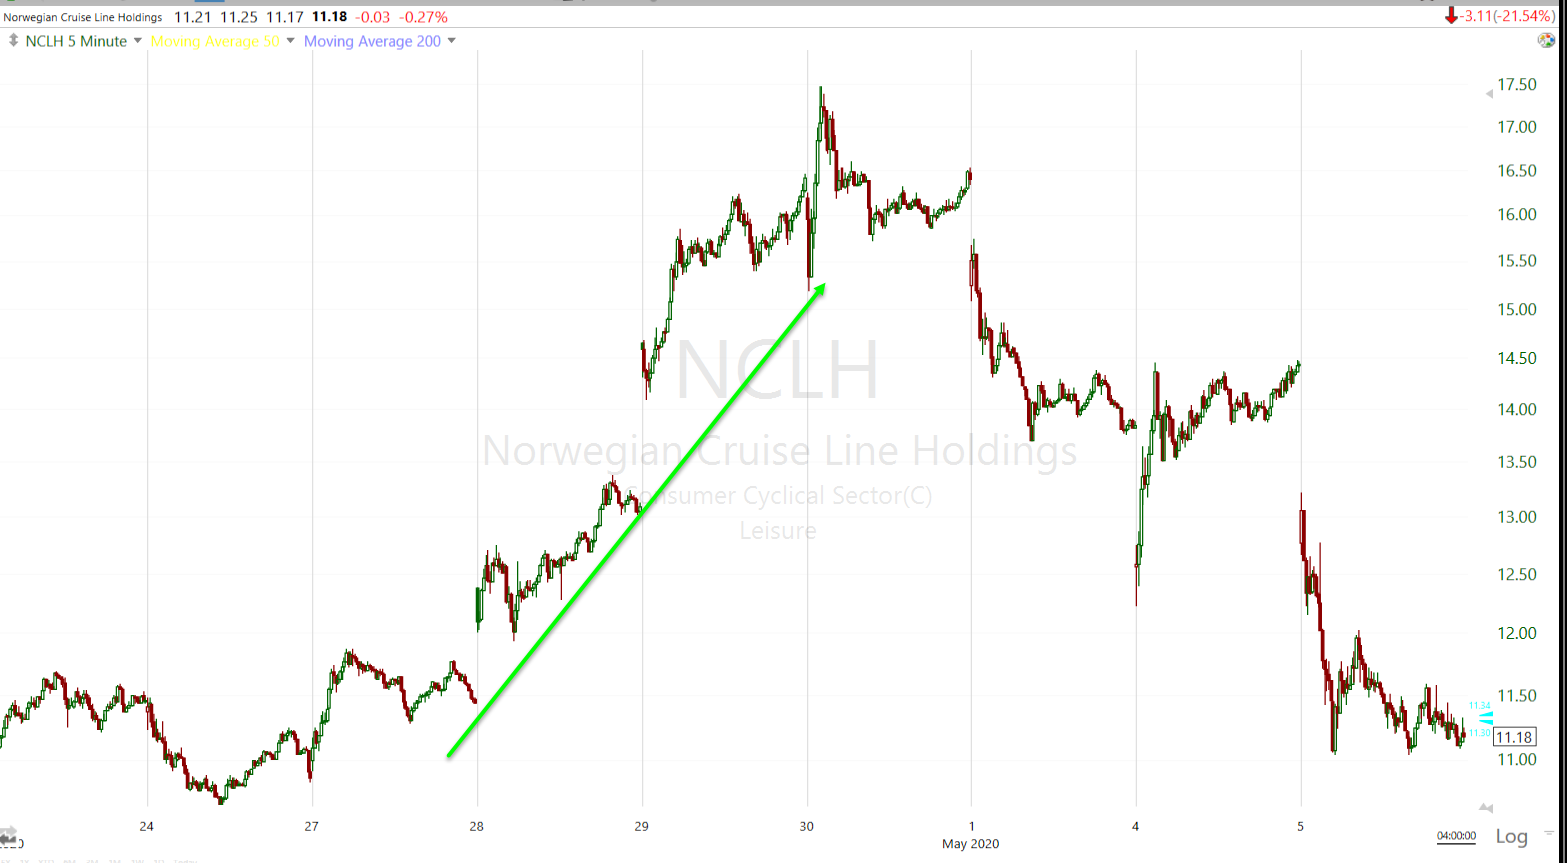
Norwegian Cruise Line (5m) reminiscent of another one of last week’s early leaders and subsequent nightmares, Hertz (HTZ).
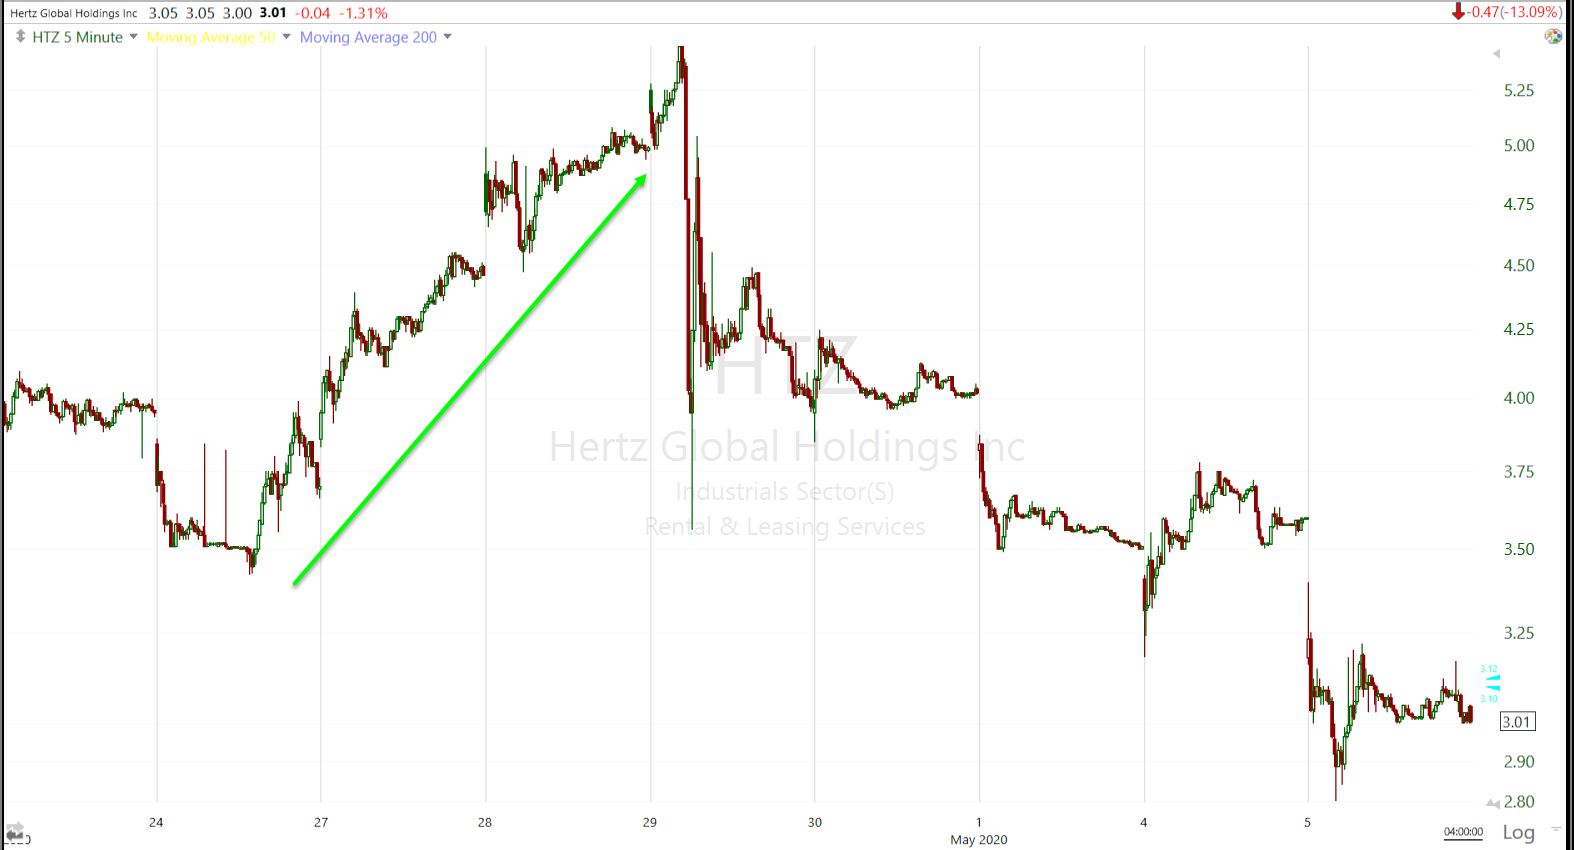
HTZ (5m) rallied 35% in 2 days, followed by bankruptcy concerns the next day. The stock has given back all of the gains, having lost almost 40% over the last week. Things change quickly.
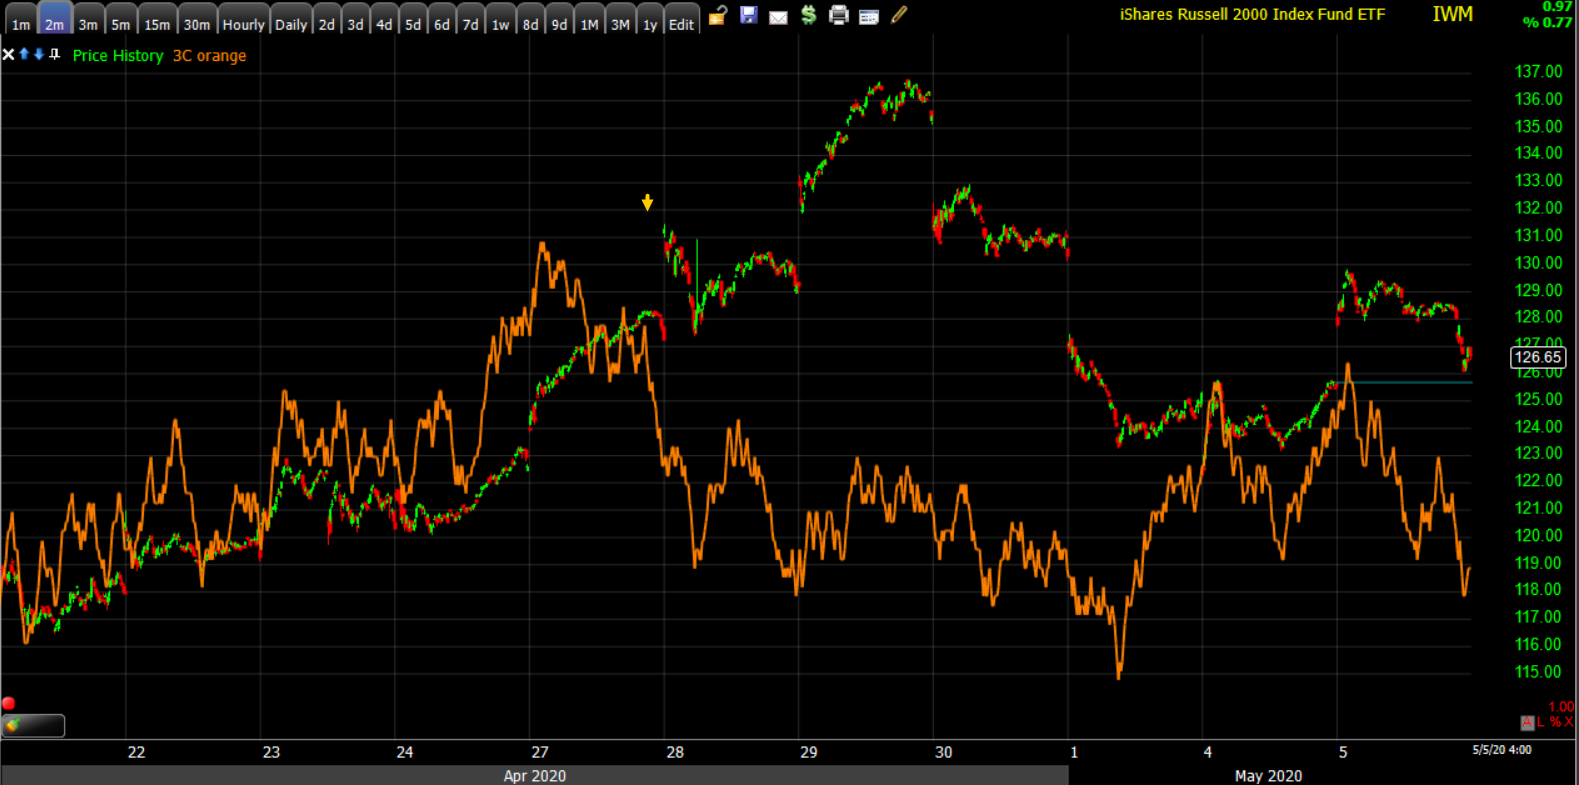
Out of nowhere, VIX came under unusual selling pressure this afternoon. About 30 minutes later Federal Reserve vice-chair Clarida gave an interview on CNBC and the unexpected volatility selling made sense. It’s pretty common to see volatility sold or suppressed ahead of Fed events and speakers and there were a few today. Clarida reiterated the Fed’s willingness to do whatever it takes, but there was little reaction in stocks. The major averages started sliding during Clarida’s interview shortly after he said that unemployment was going to surge to levels not seen since the 1940’s.
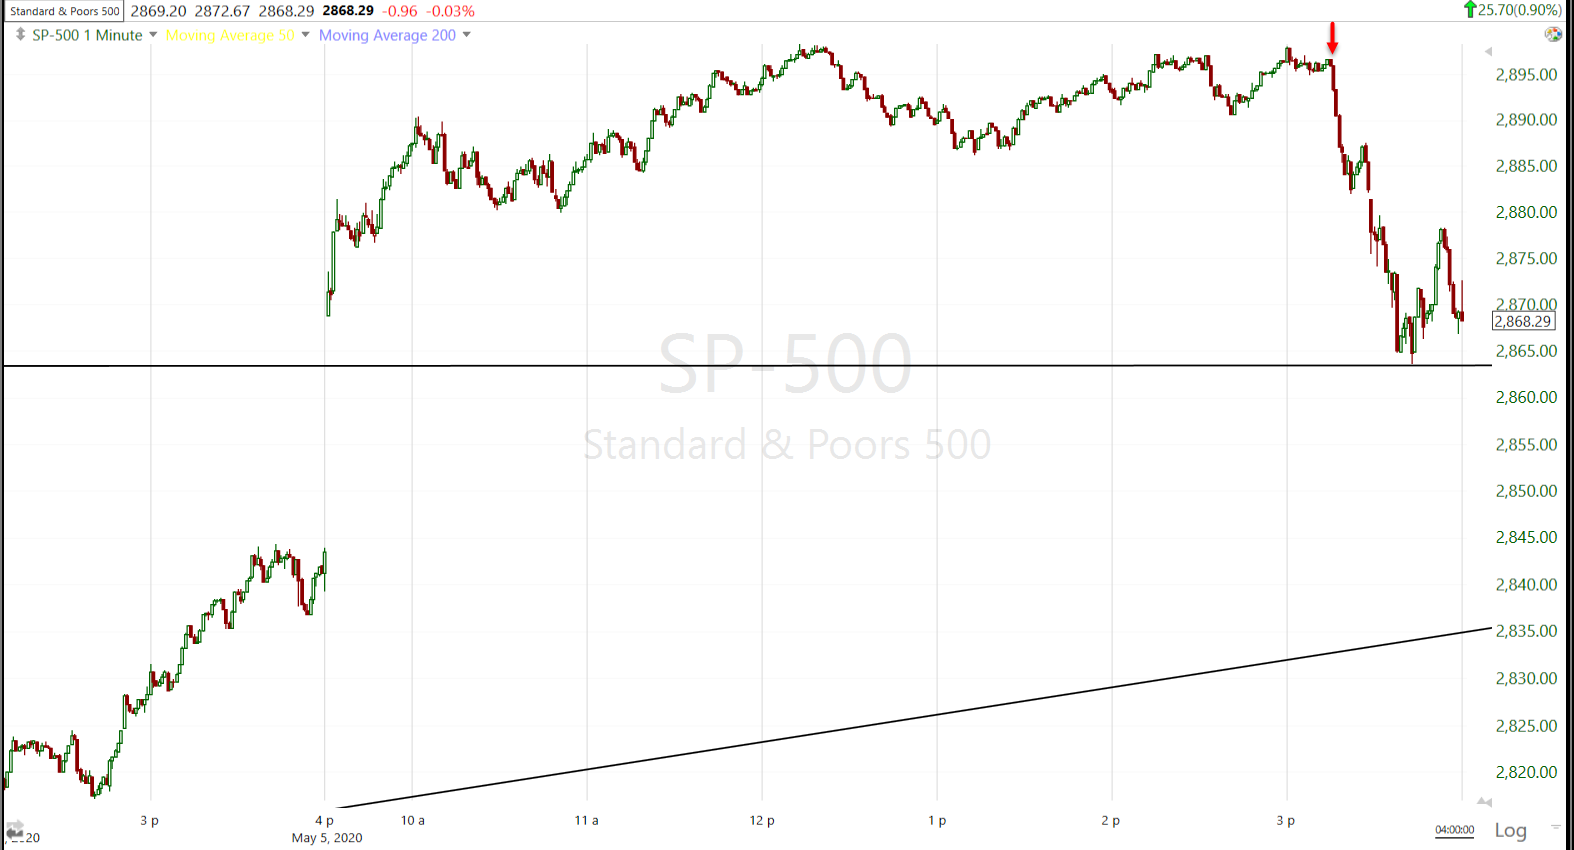
SP-500 (1m) Clarida’s unemployment comment at the red arrow.
In reassuring comments, St. Louis Fed President James Bullard said the central bank’s efforts are “very much an experiment.” Chicago Fed’s Charles Evans was more cautious, calling the lifting of restrictions “a bold decision with pretty high risks.”
In other news, Mike Pence said the administration is considering disbanding the coronavirus task force, possibly as soon as Memorial Day. The VP portrayed the group as having accomplished its goal.
Averages
The S&P gave back all cash session gains to end just about where it opened. Small Cap Russell 2000 started the day with clear relative strength, up as much as 3.3%, then lost the leadership role first as cyclical sectors hit resistance and then as Financials were weighed on by the banks going red.
S&P 500 ⇧ 0.90 %
NASDAQ ⇧ 1.09 %
DOW JONES ⇧ 0.56 %
RUSSELL 2000 ⇧ 0.75 %
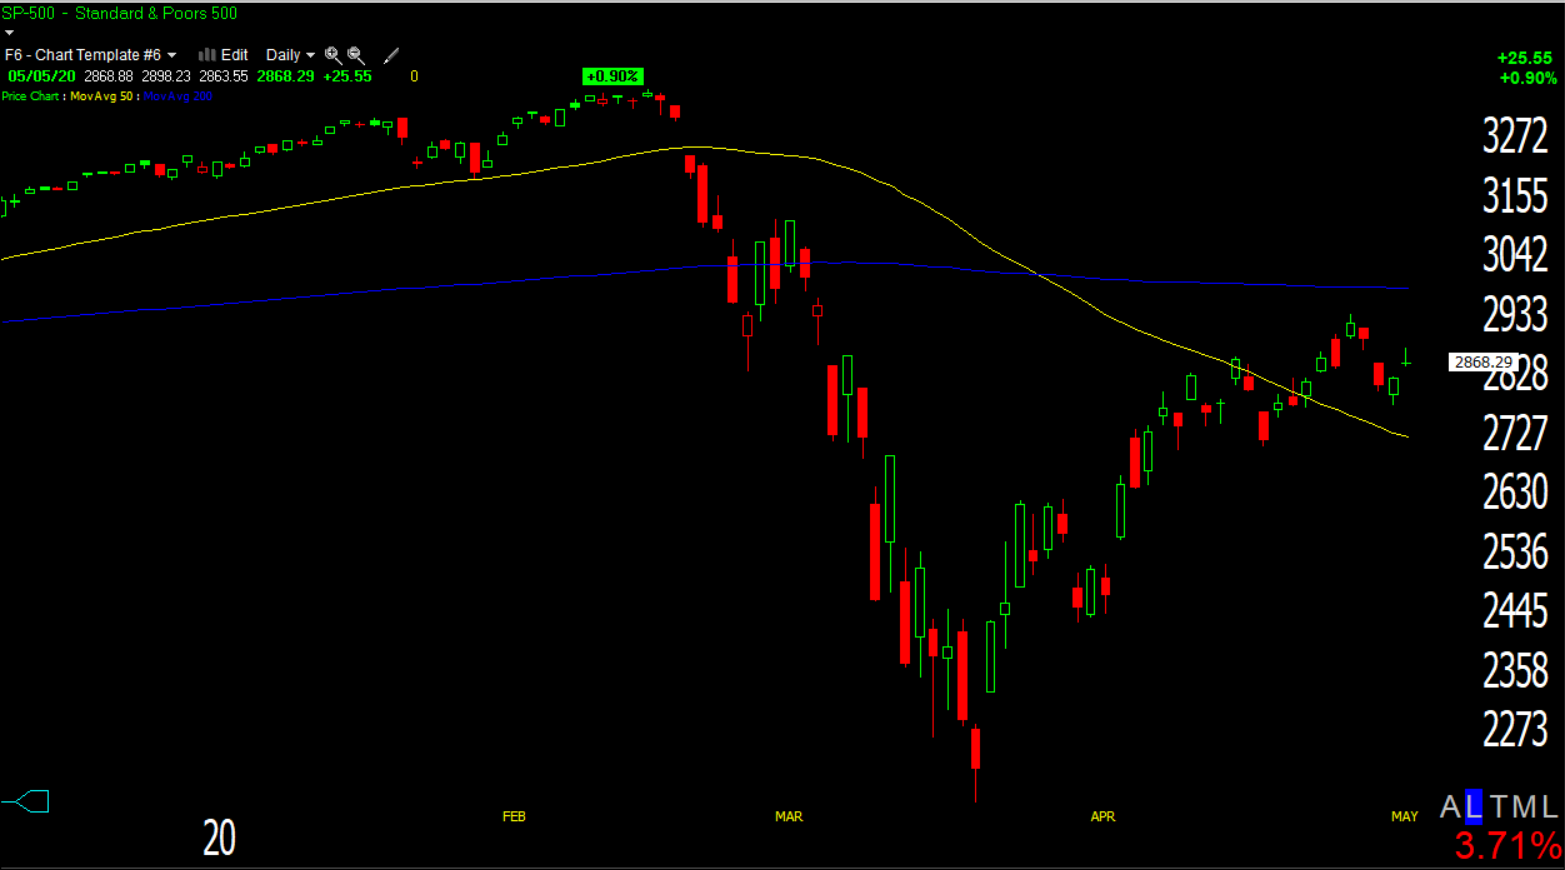 SP-500 (daily) posted a small bearish candle like a gravestone doji star, which depicts an inability to hold higher prices during the day, then closing about where it opened and near the low of the day. All of the gains for the day were made in the overnight session.
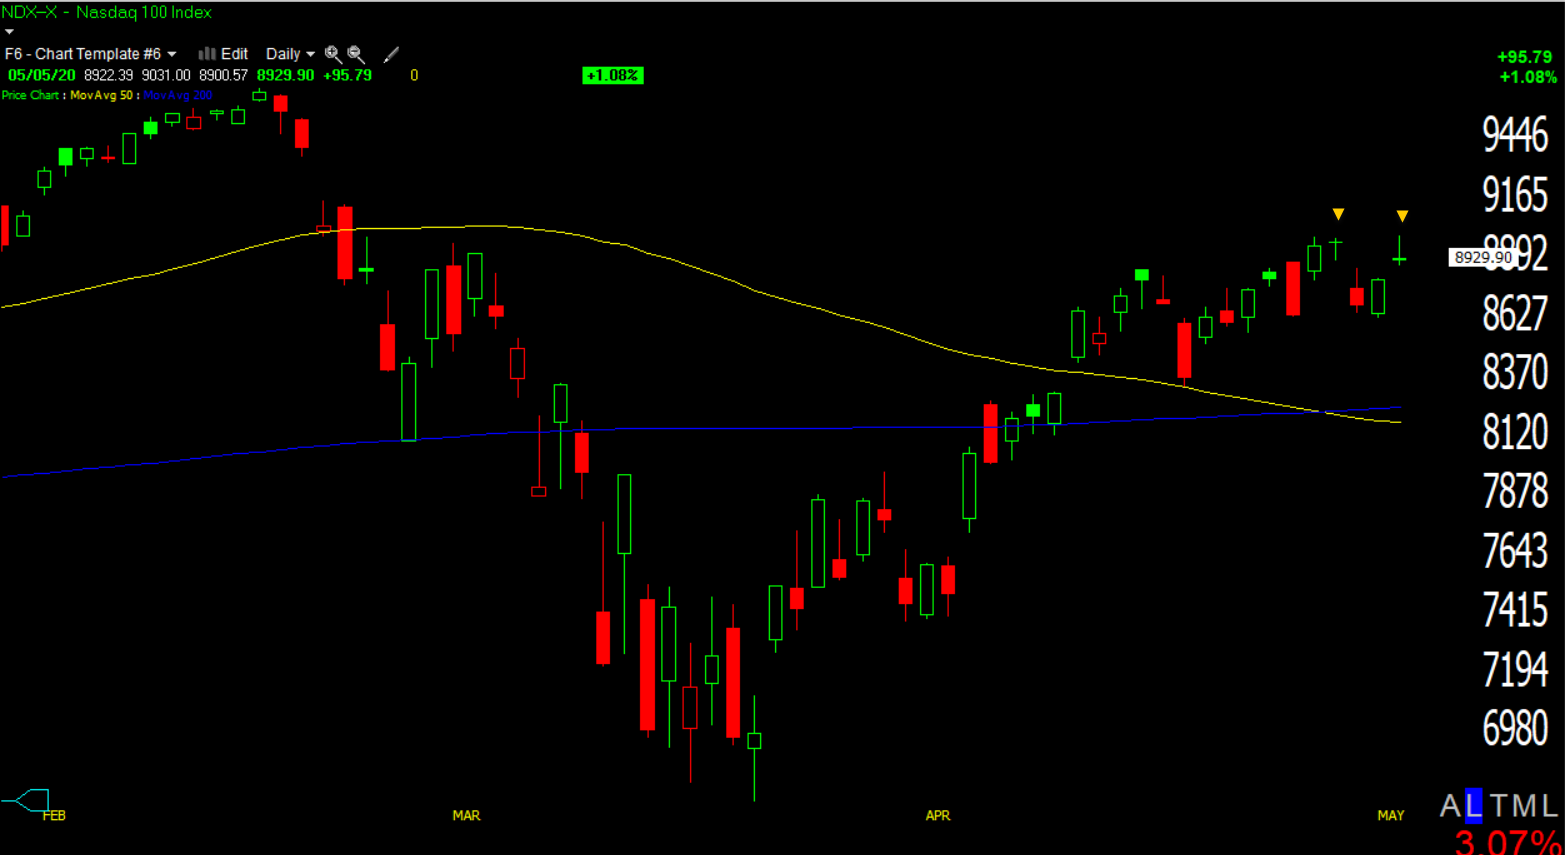 NASDAQ 100 (daily) posted a similar candlestick near a similar star candlestick marking the NASDAQ’s high from last Thursday.
Illustrating the negative change in character in small caps…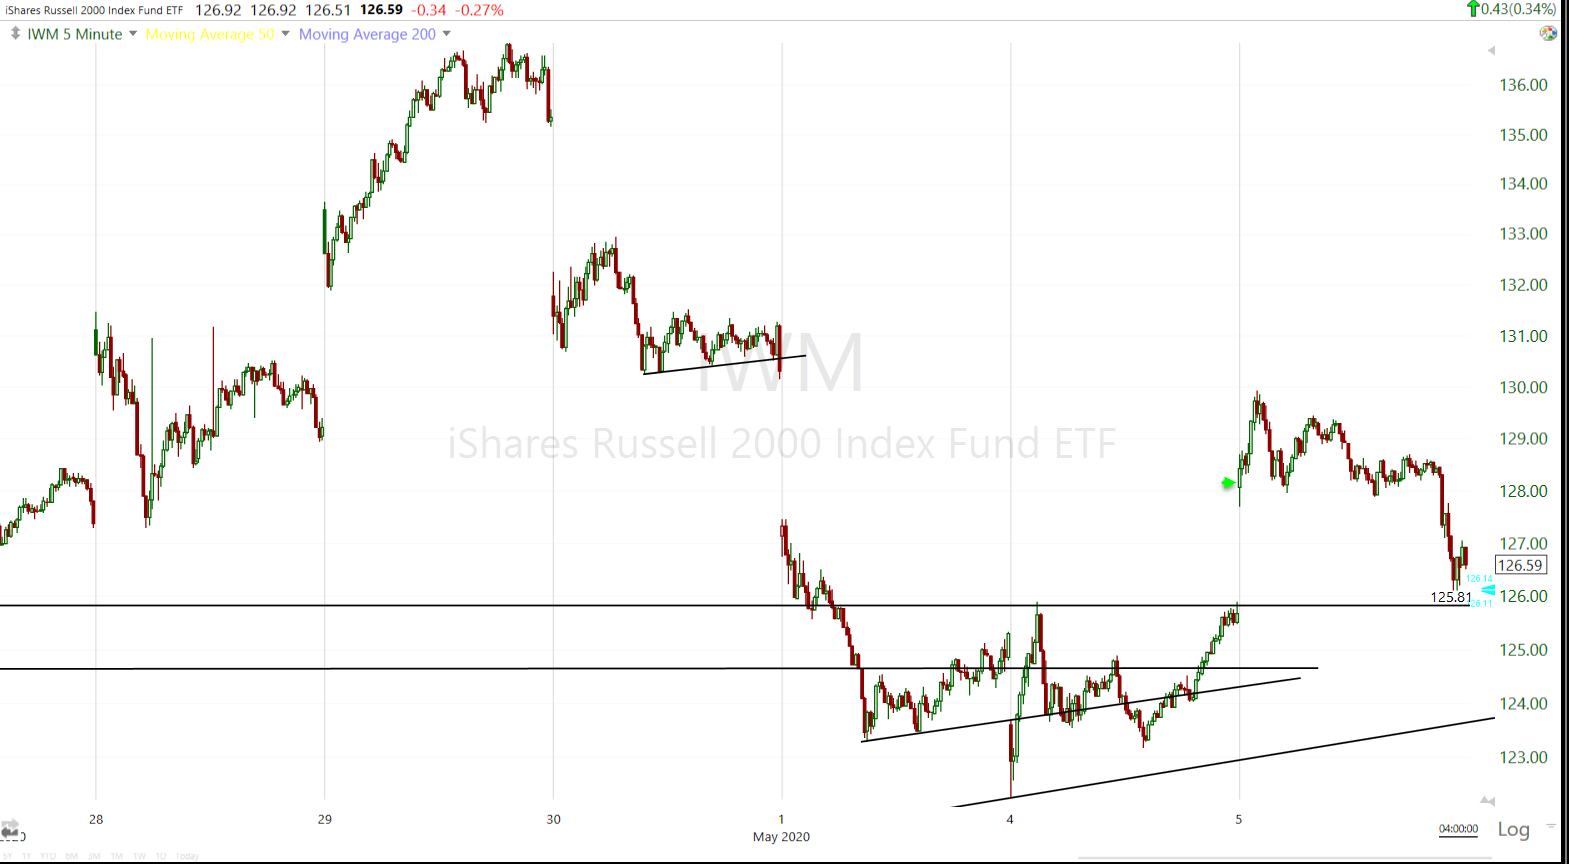 IWM (5m) while S&P closed near where it opened, IWM closed well below where it opened, but held around the 2018 low.
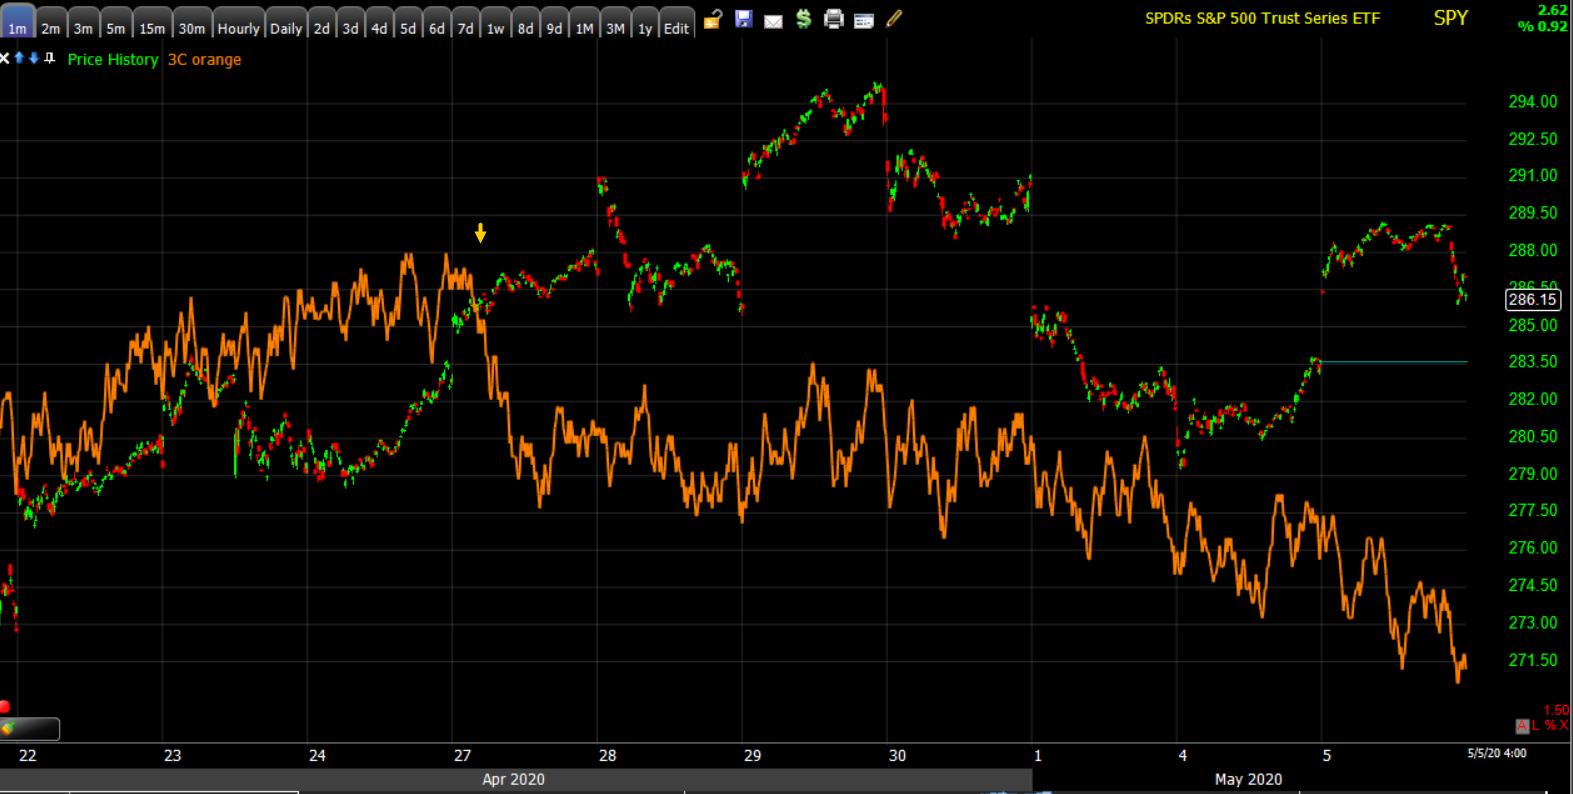 SPY (1m) no improvement in 3C today as it tracks lower.
 IWM (2m) nor here.
The rally early last week was characterized by a dash for trash as investors rushed into beaten up stocks on re-opening hopes. As touched on in the weekend video, the companies with the worst balance sheets rallied the most, including airlines, cruise lines, retailers, restaurants, travel, while the strongest balance sheets underperformed. I think it’s interesting that the 3C charts above negatively diverged sharply early last week, just after those stocks pulled investors into the market.
S&P sectors
The day started with strong leadership from the Energy sector, but the sector gave back almost all of its early +5% gains after stalling at resistance this morning along with other cyclical sectors like Materials. The two most heavily weighted sectors, Technology and Health Care, took over the leadership role. The Technology sector was driven by a handful of mega-caps, mostly Apple, Alphabet and Microsoft. Amazon was not part of that leadership after a failed breakout last week.
The health care space received a sentiment boost by news that Pfizer (PFE +2.4%) and BioNTech SE (BNTX +9.2%) dosed their first U.S. patients in a clinical trial of a potential COVID-19 vaccine.
Financials were another early leading sector, but were dragged lower as the banks sold off. Outside of Tech and Health Care, all S&P sectors finished lower than the benchmark S&P-500.
Materials ⇧ 0.26 %
Energy ⇧ 0.08 %
Financials ⇩ -0.32 %
Industrial ⇧ 0.39 %
Technology ⇧ 1.38 %
Consumer Staples ⇧ 0.09 %
Utilities ⇧ 0.82 %
Health Care ⇧ 2.17 %
Consumer Discretionary ⇧ 0.36 %
Real Estate ⇧ 0.64 %
Communications ⇧ 0.52 %
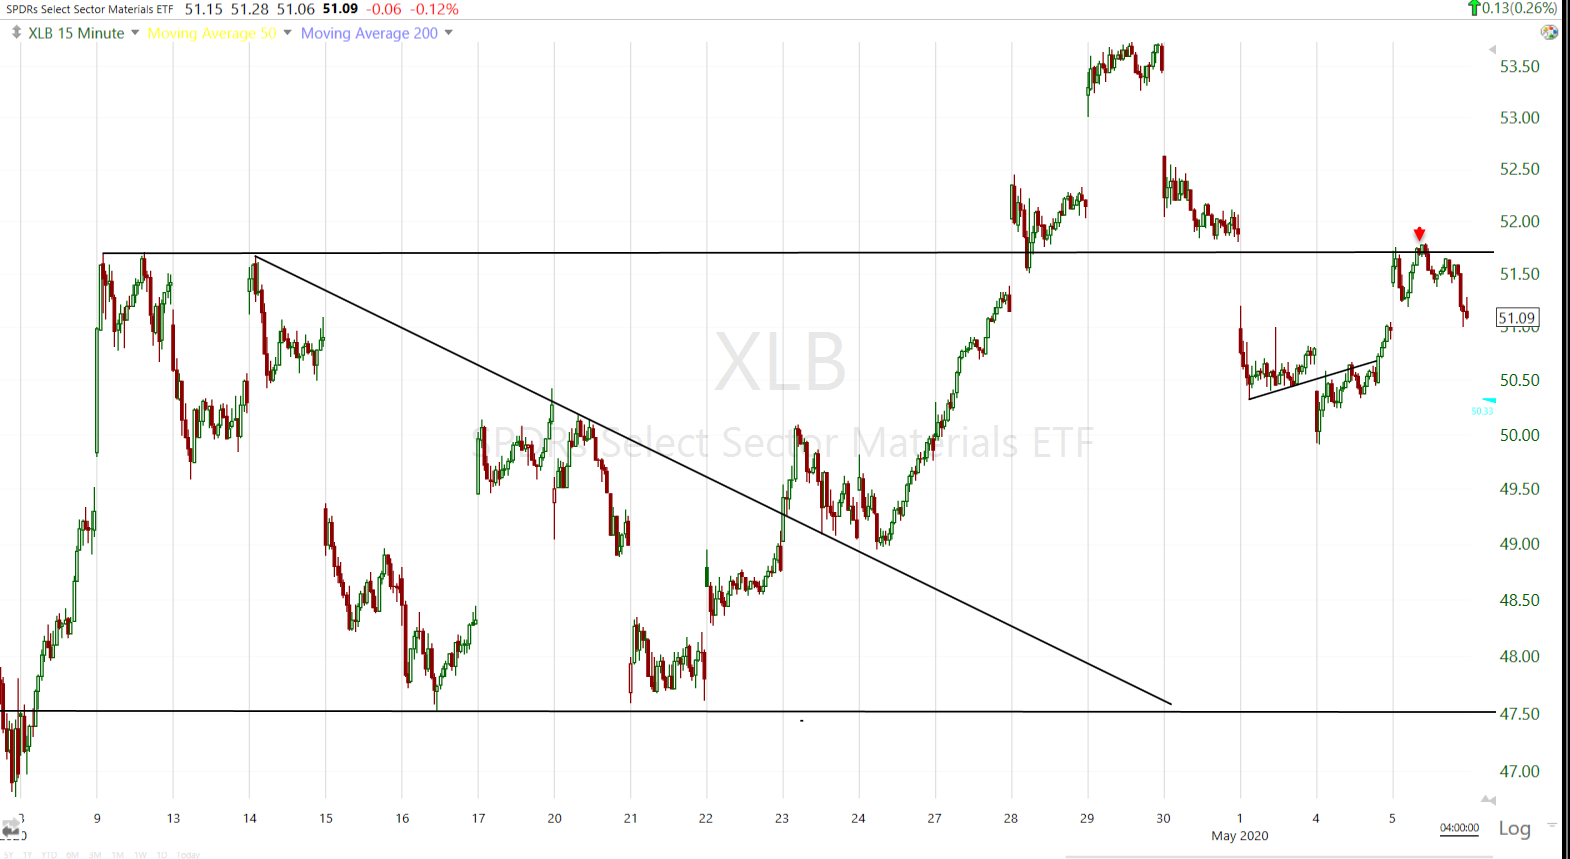 Materials (15m) the local resistance area is also an important level defining a lateral market range that stocks broke out above last week, but failed to hold above. The level has flipped from resistance to support and back to resistance.
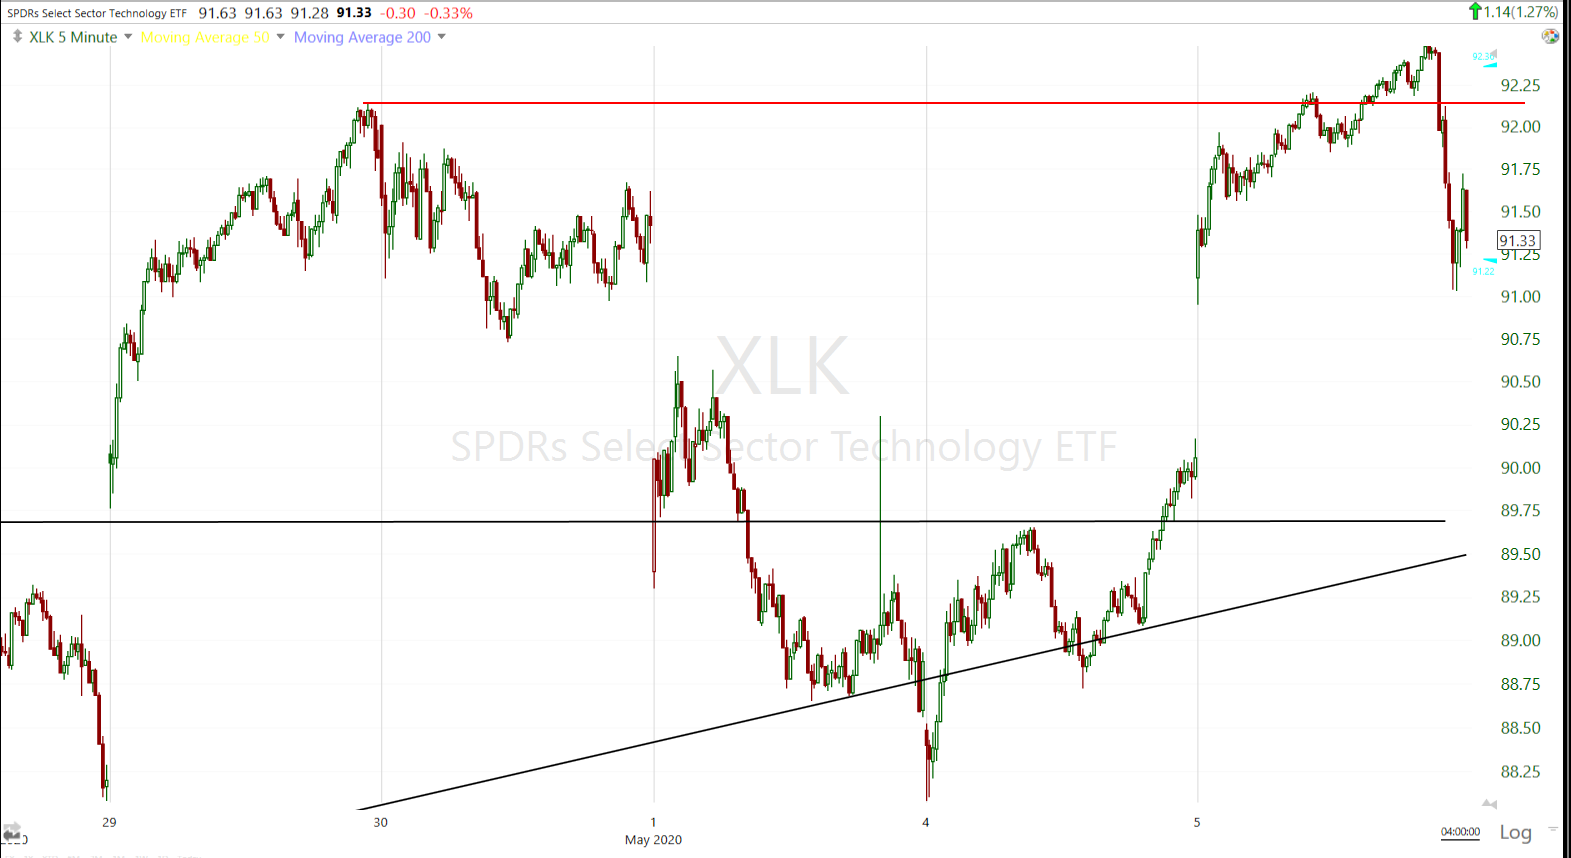 Technology (5m) briefly traded above local resistance, then fell on Clarida’s comments.
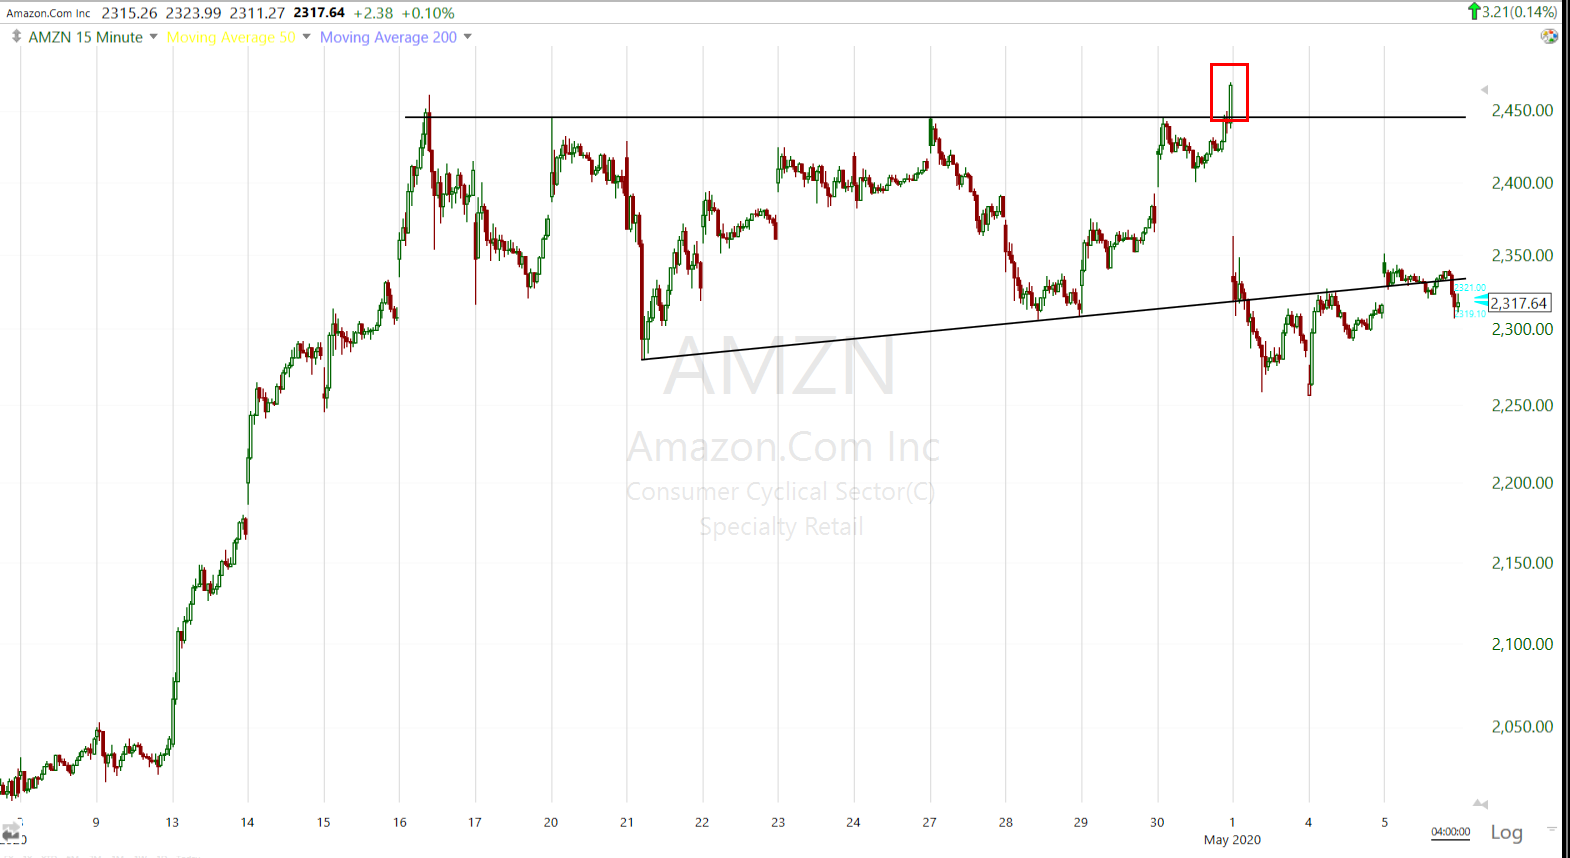
Amazon (15m) struggled under the failed ascending triangle after last week’s earnings and failed breakout attempt.
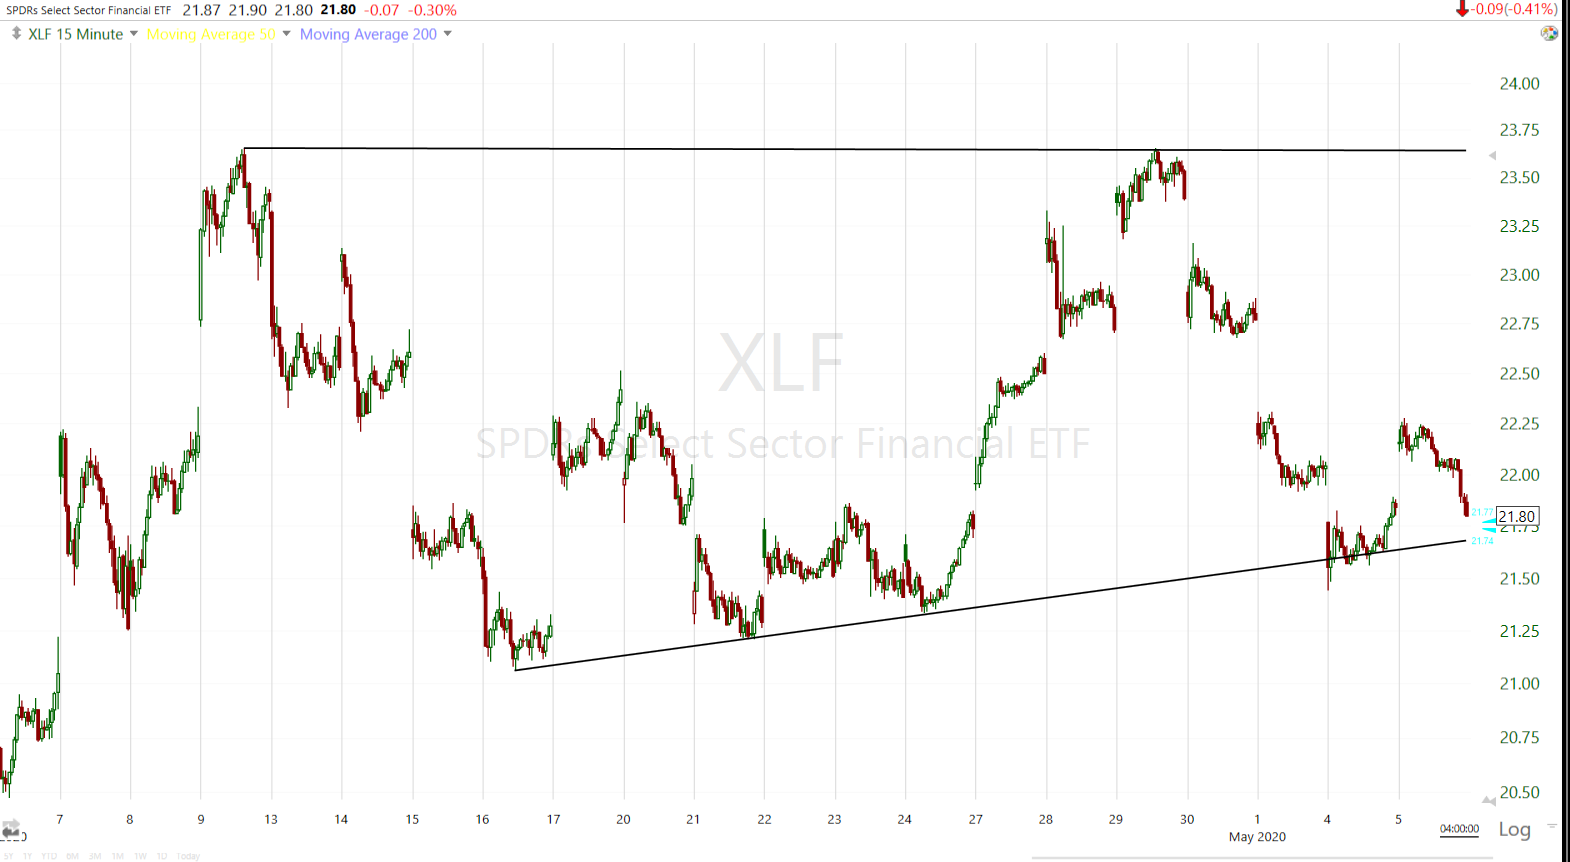 Financials (15m) are still trading near the bottom of their 3 week range/consolidation as the banks traded poorly today.
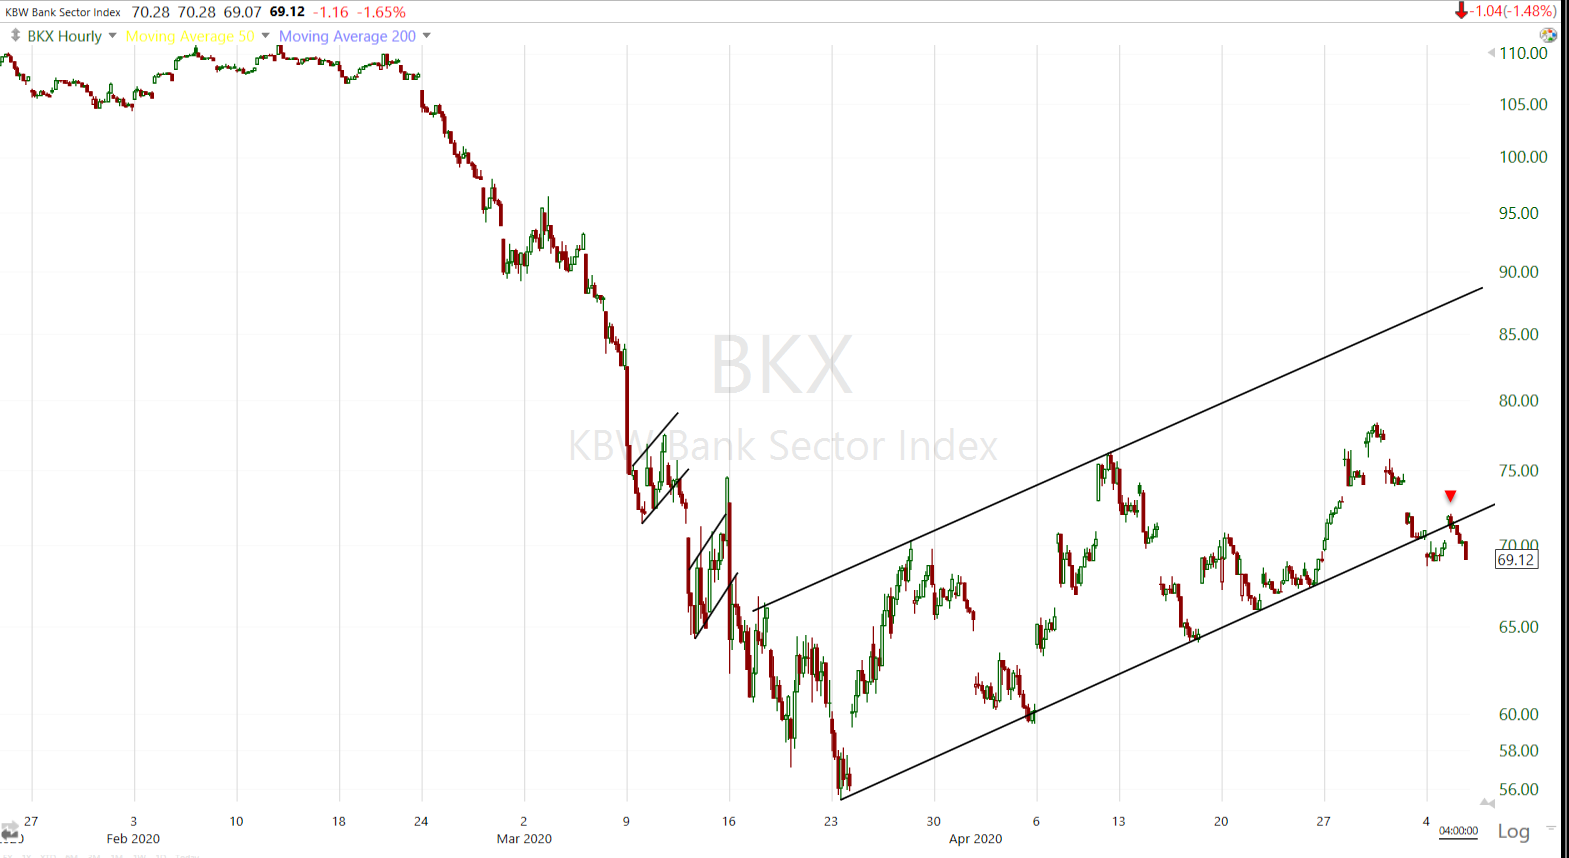 KBW Bank Index (60m) failed to get back above the 6 week flag-like pattern. The banks breaking this trend is a change in character for the market and further increases probabilities of last week’s failed breakout being an important event.
Small Cap Russell 2000 has a lot of exposure to Financials/Banks, which is why it went from early strength to closing weakness with the banks.
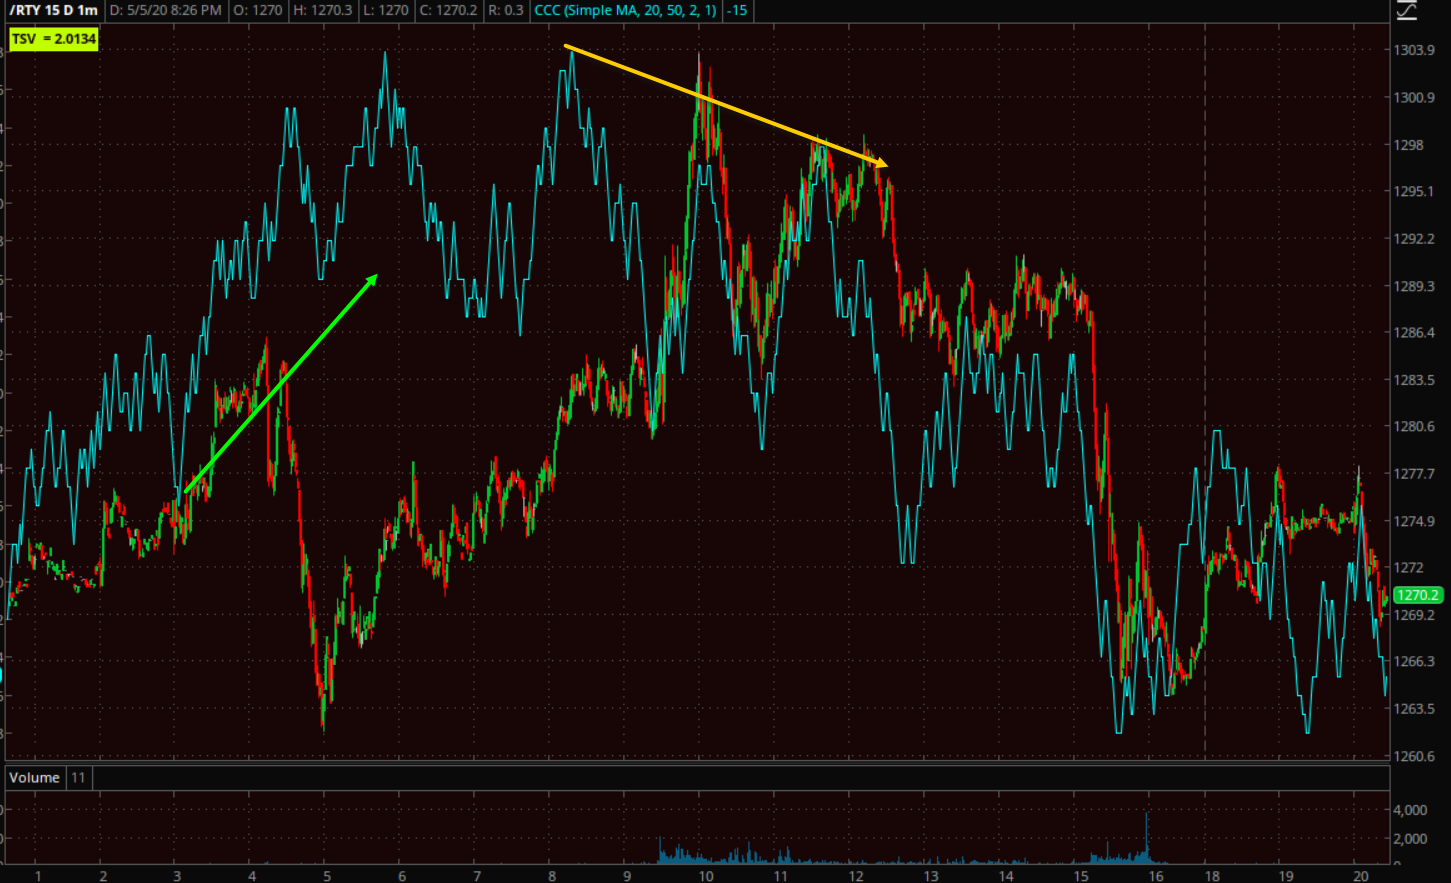
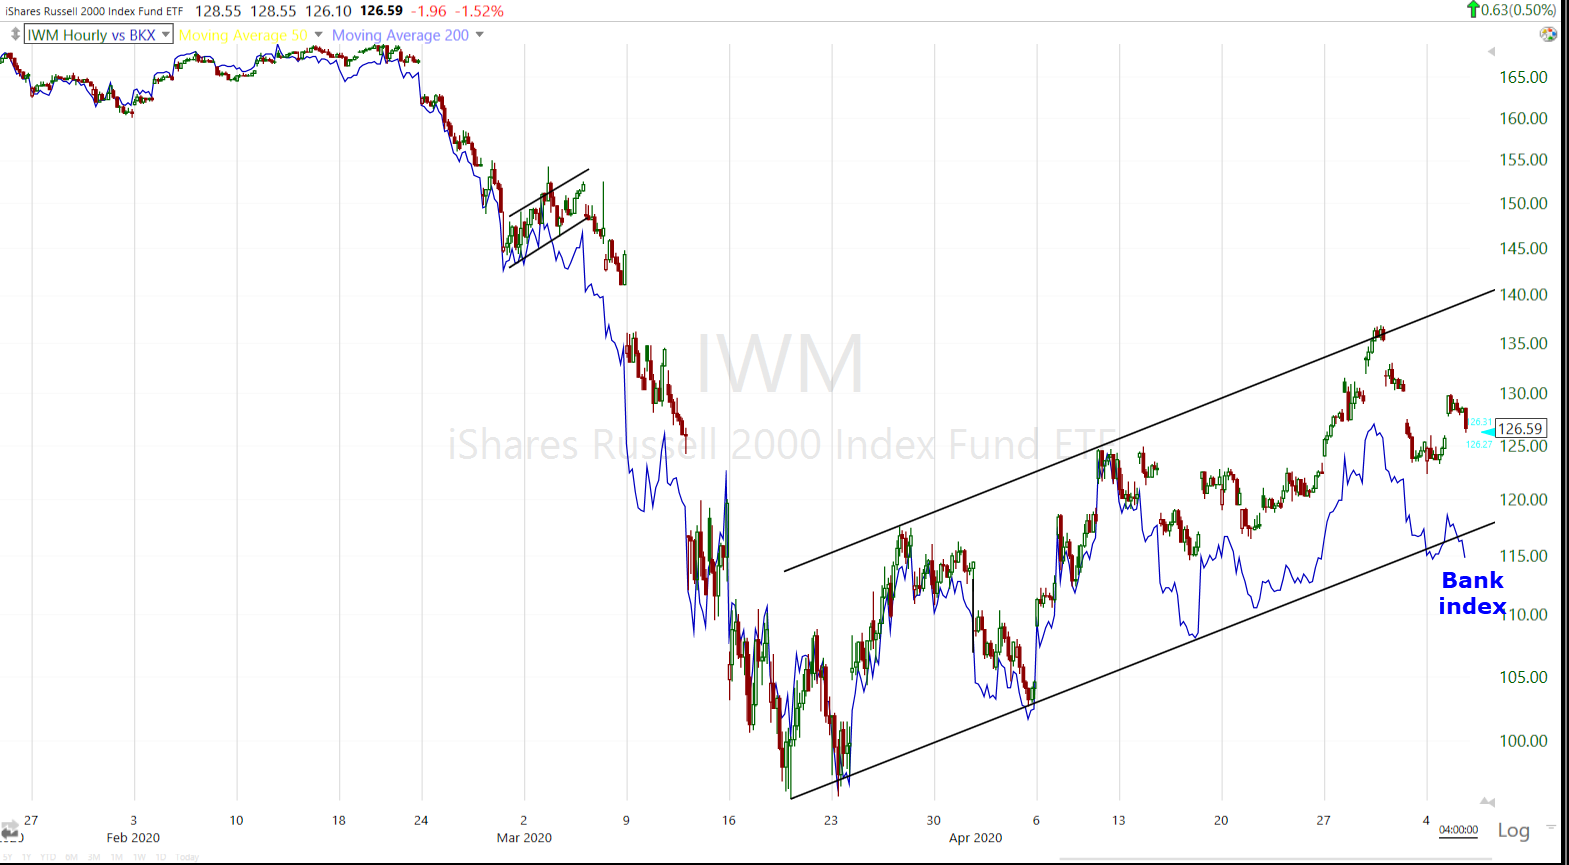 IWM (60m) is nearly the exact same flag-like pattern as Banks which I overlaid in blue and normalized. As you can see above, the group’s weakness is more significant for small caps.
Taking a step back and looking at the daily charts of some of the banks, they don’t look like what I’d expect to see at a market low…
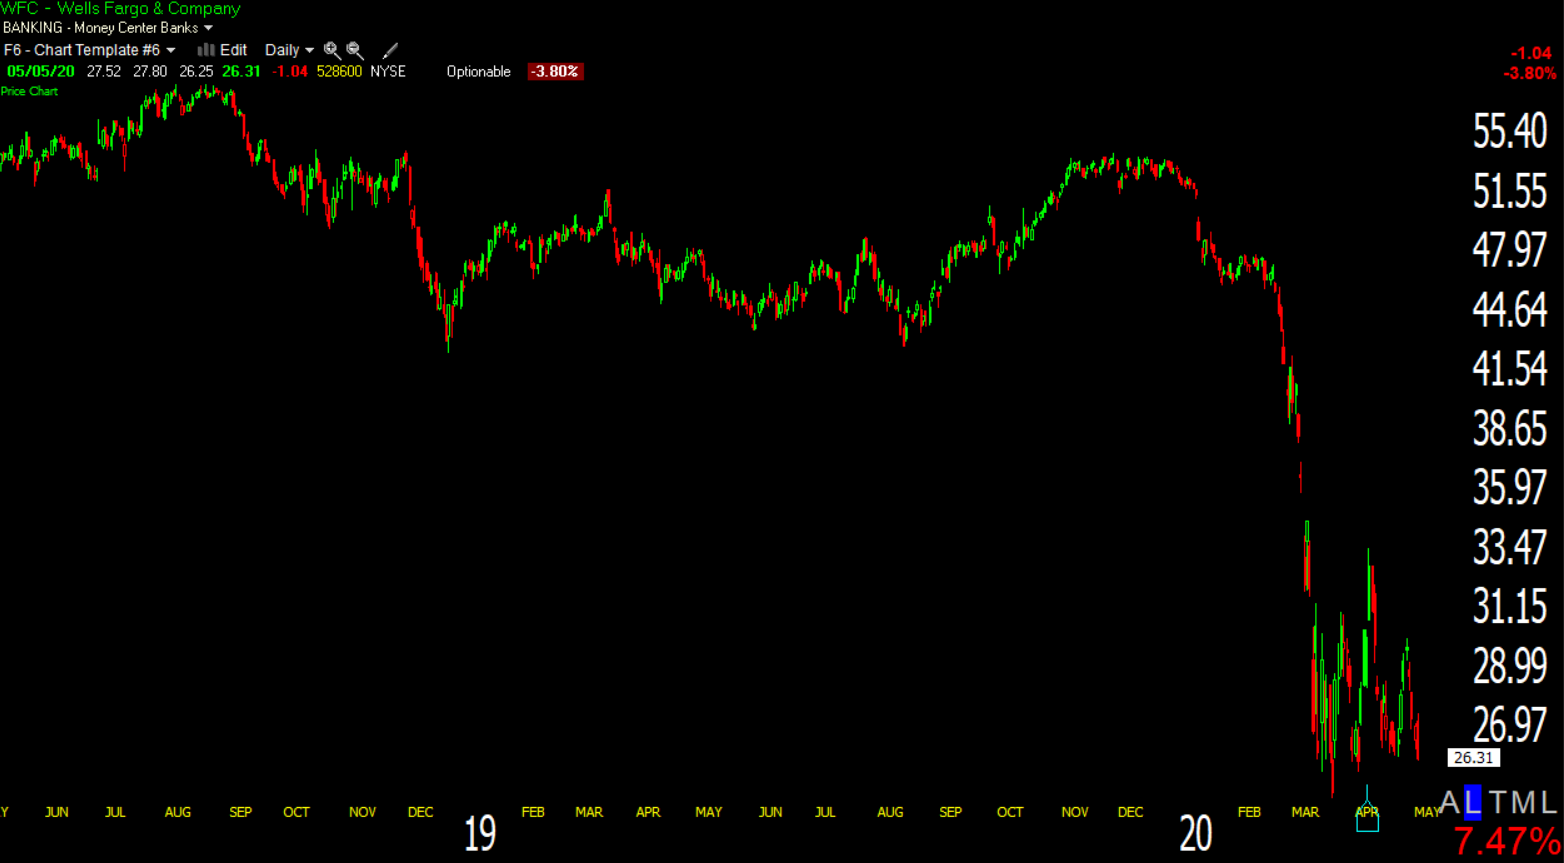 Wells Fargo (daily) -That’s a very bearish chart.
For some context, here’s WFC about 6 weeks after the bear market low in March 2009.
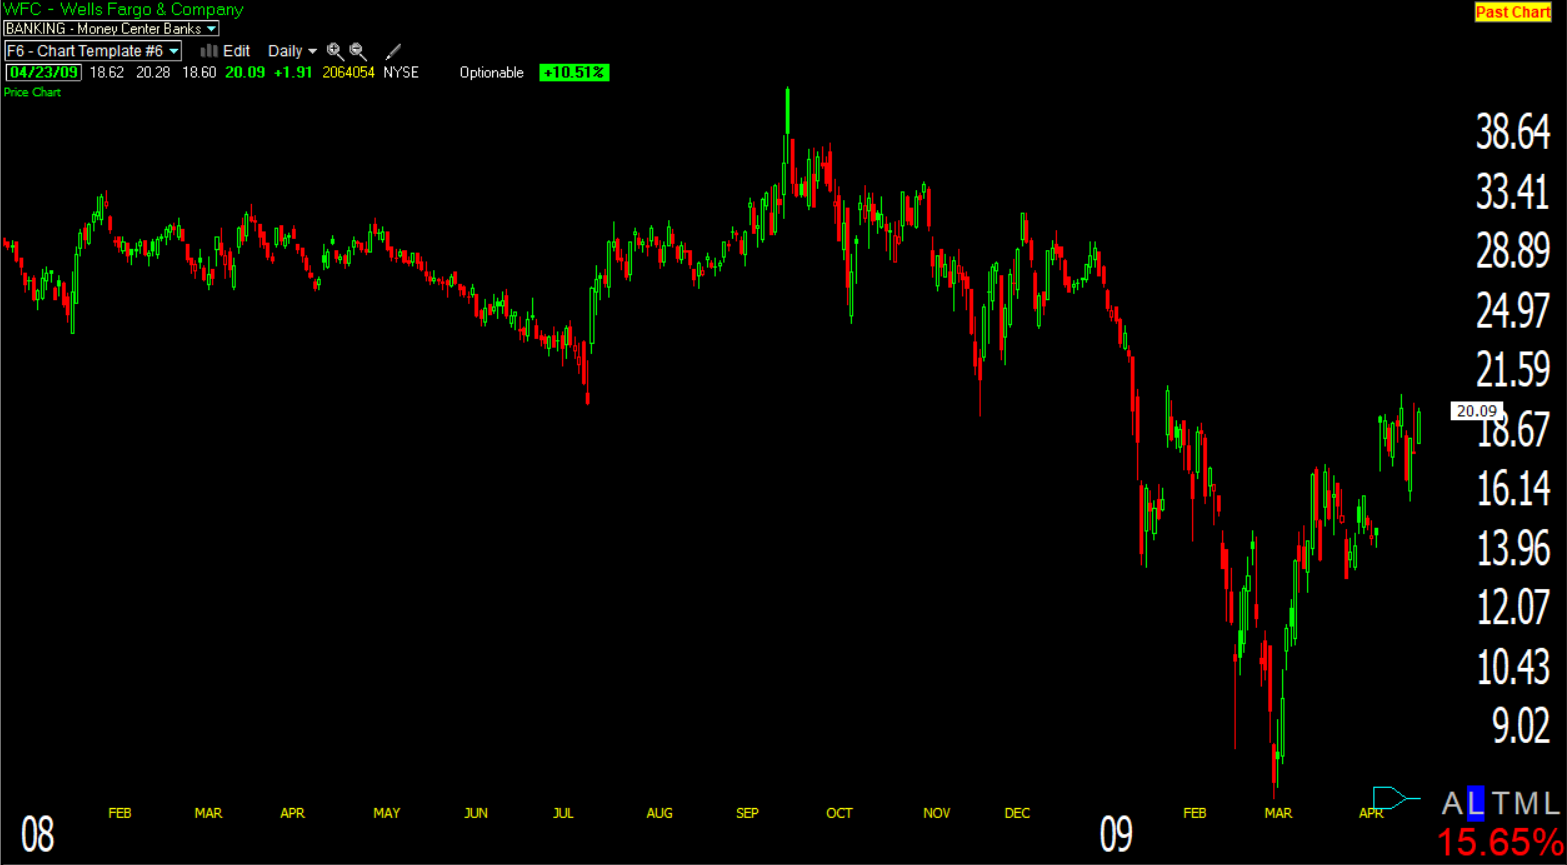 WFC (daily) this chart looks a lot better with a rally, a bullish consolidation and upside follow-through. And keep in mind, this was a financial crisis centered around the banks and it looks a lot better back then than it does now.
Or what many would consider to be best of breed, JP Morgan…
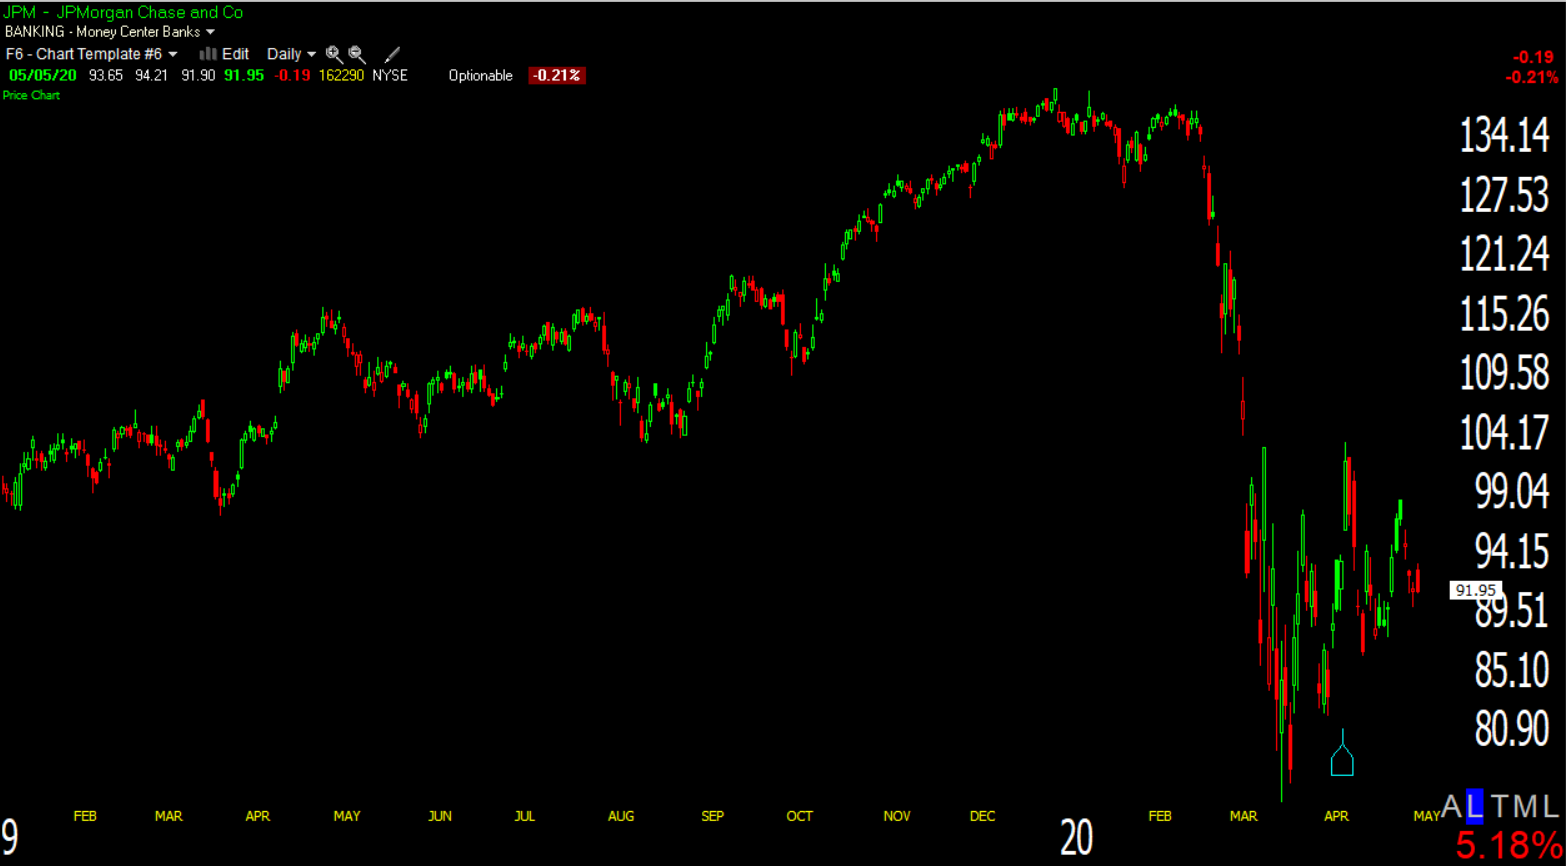 JPM (daily) again this looks a lot more like a big bearish price consolidation (like a bear flag or bear pennant) than a market low in a crisis that’s not even centered on banks.
Internals
Internals started the day strong along with small cap leadership, then ended mixed. NYSE Advancers (1626) and Decliners (1274) on diminishing volume of 927.1 mln. shares. Volume has been falling for 4 weeks.
The Dominant price/volume relationship came in at Close Up/Volume Down, the weakest and most bearish relationship.
Today would reflect a 1-day overbought condition if advancers were at least 2:1 over decliners. Instead, internals reflect a lack of conviction on the part of buyers.
Treasuries
U.S. Treasuries ended the session little changed. The 2-year yield was unchanged at 0.17%, and the 10-year yield increased two basis points to 0.66%.
Currencies and Commodities
The U.S. Dollar Index increased 0.3% to 99.78. Dollar strength has been a net negative for stocks recently. Today it was driven by Euro weakness as Germany’s top judges ruled over the legality of European Central Bank stimulus. They ruled that some actions taken by the country’s Bundesbank to participate in the asset purchase program were unconstitutional, and if not remedied, the bank will have to sell bonds already purchased. What an interesting case- challenging QE. Who would have thought?
The Aussie and Chinese Yuan are consolidating (bearishly) last week’s losses after having broken their own substantial trends.
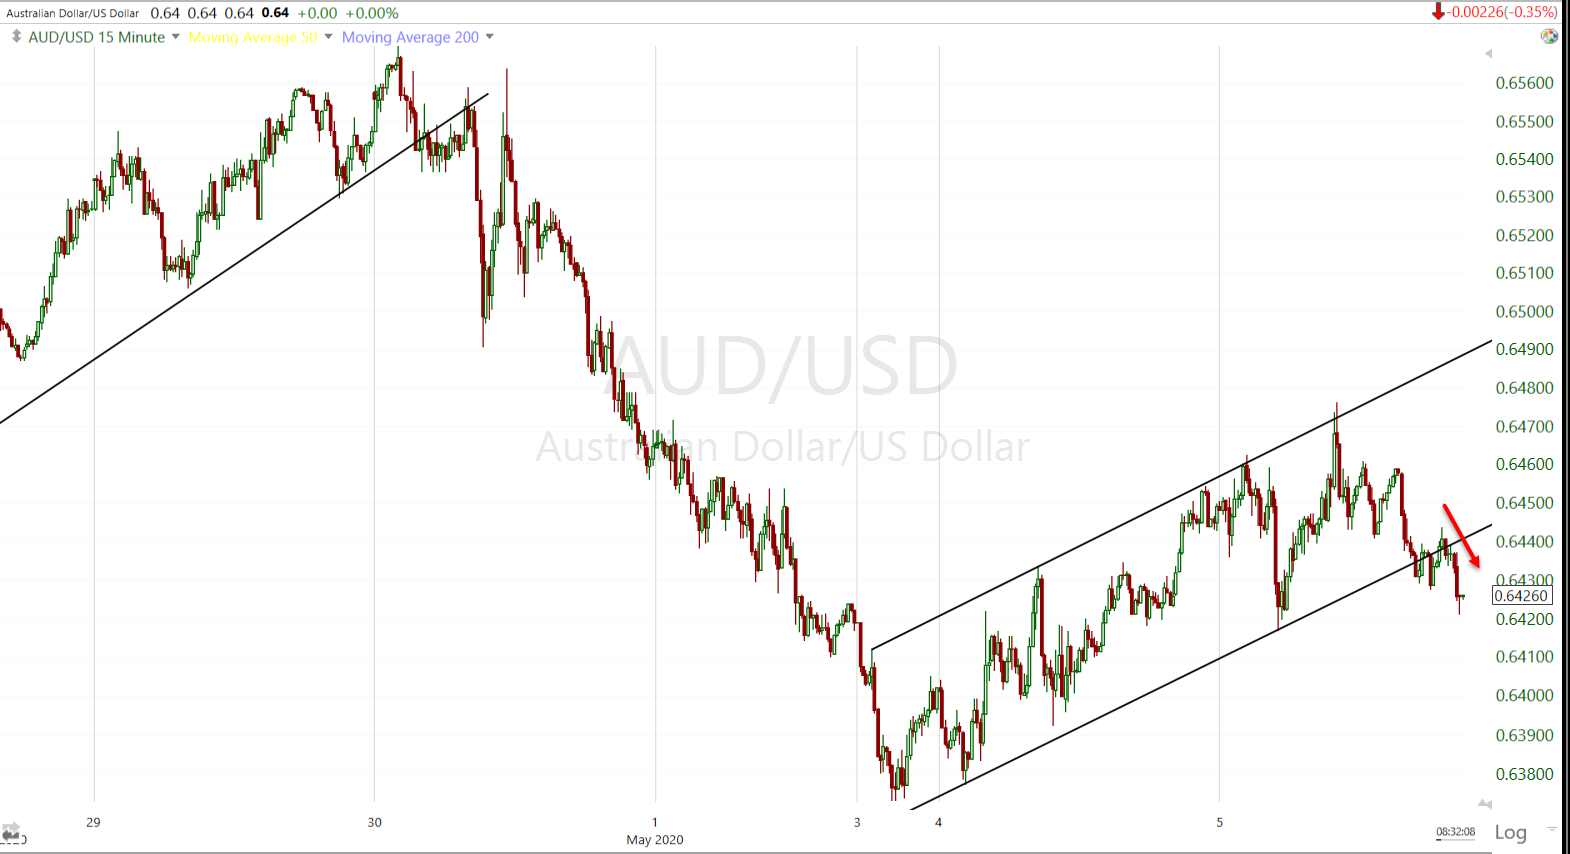
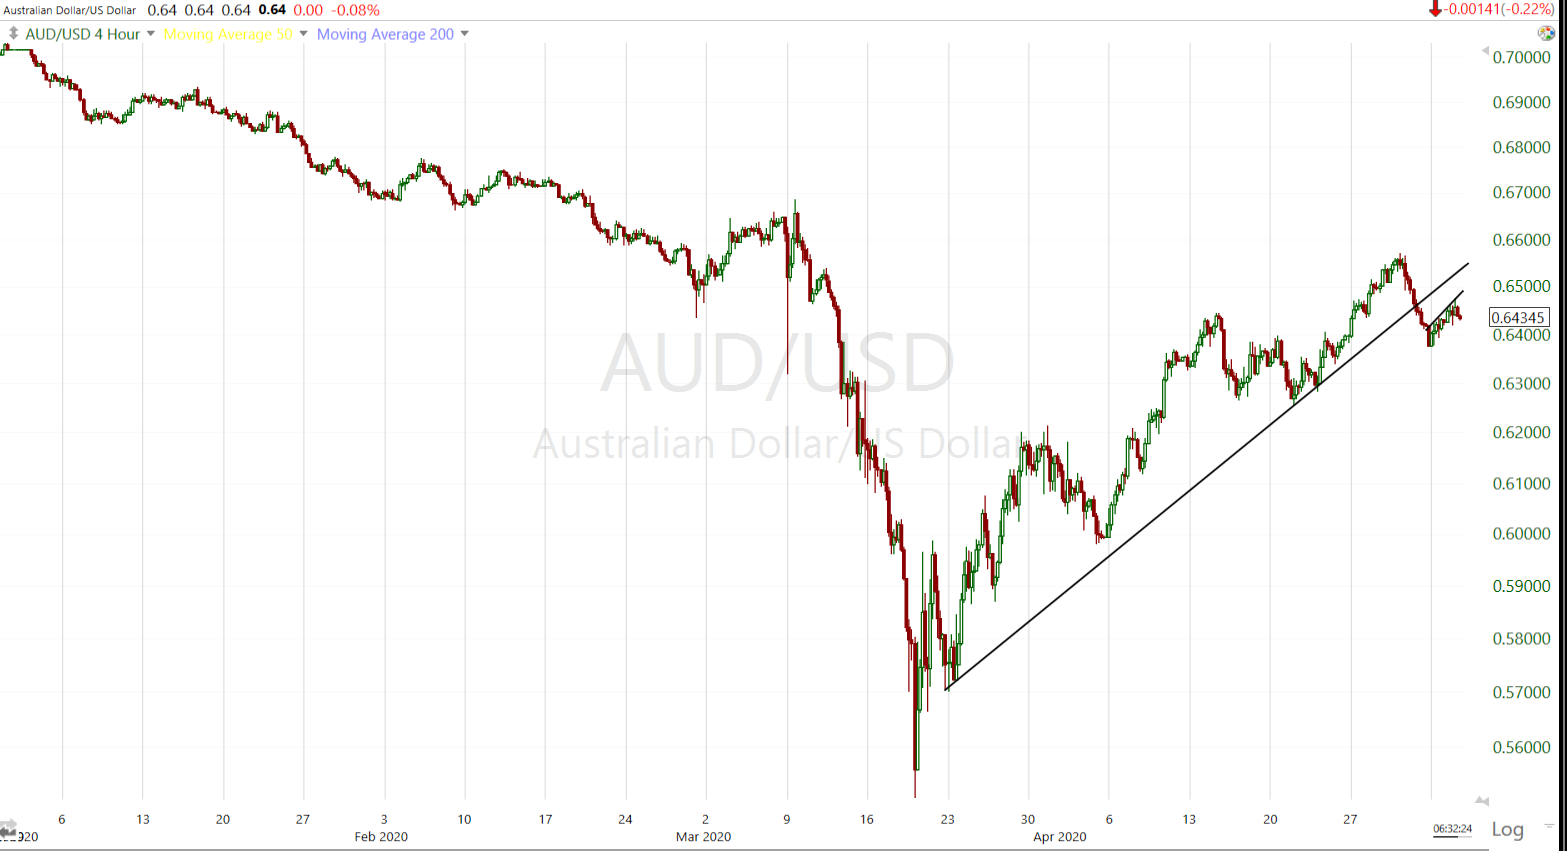 AUD/USD (4 hour) 6 week trend broken
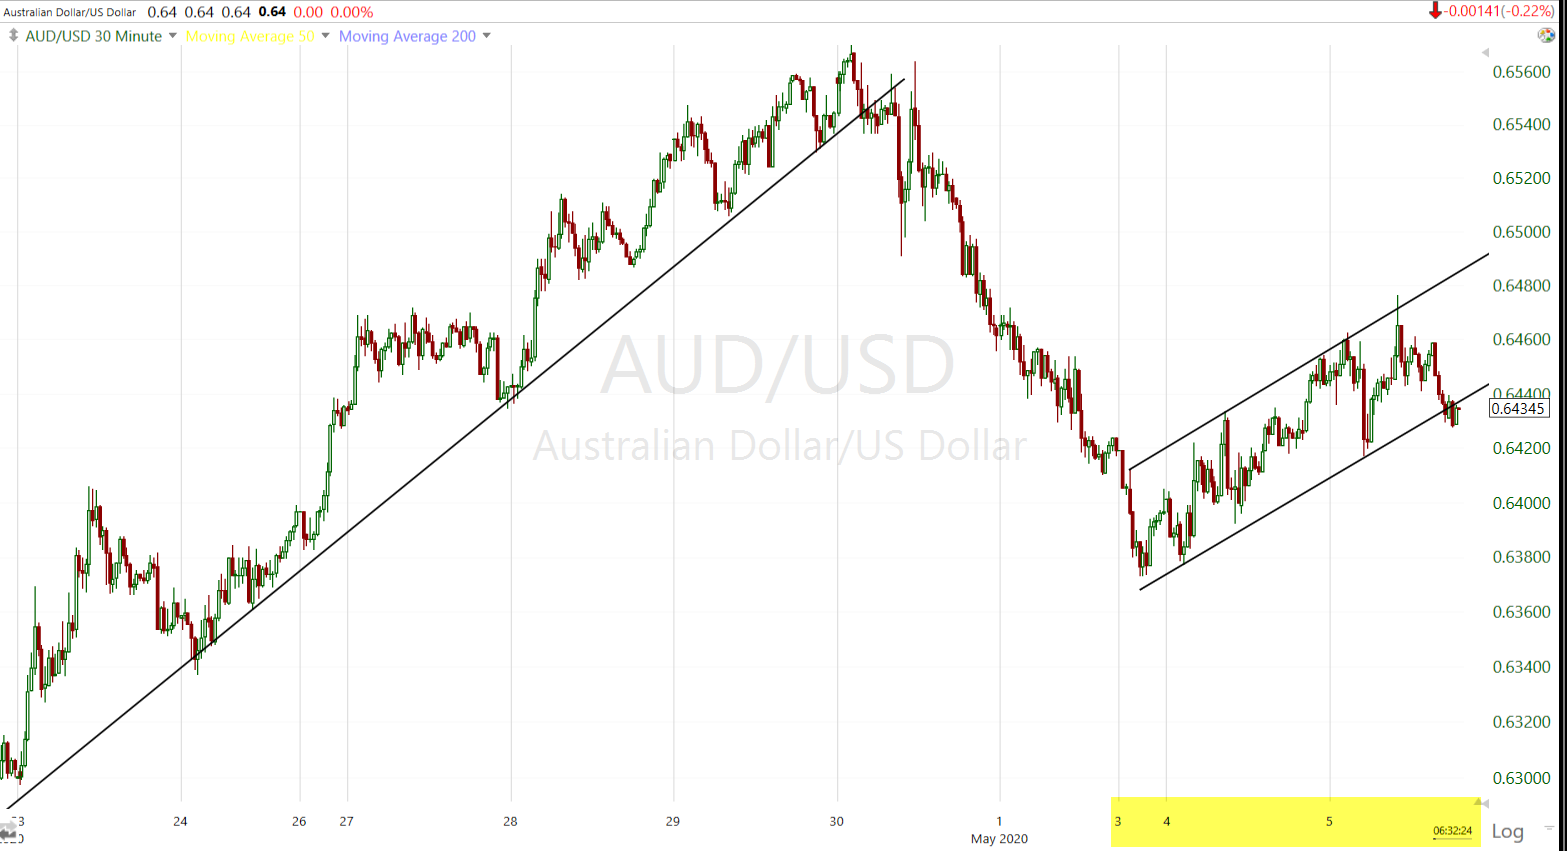 AUD/USD (30m) the low conviction bounce off Sunday’s low is a bearish correction/consolidation.
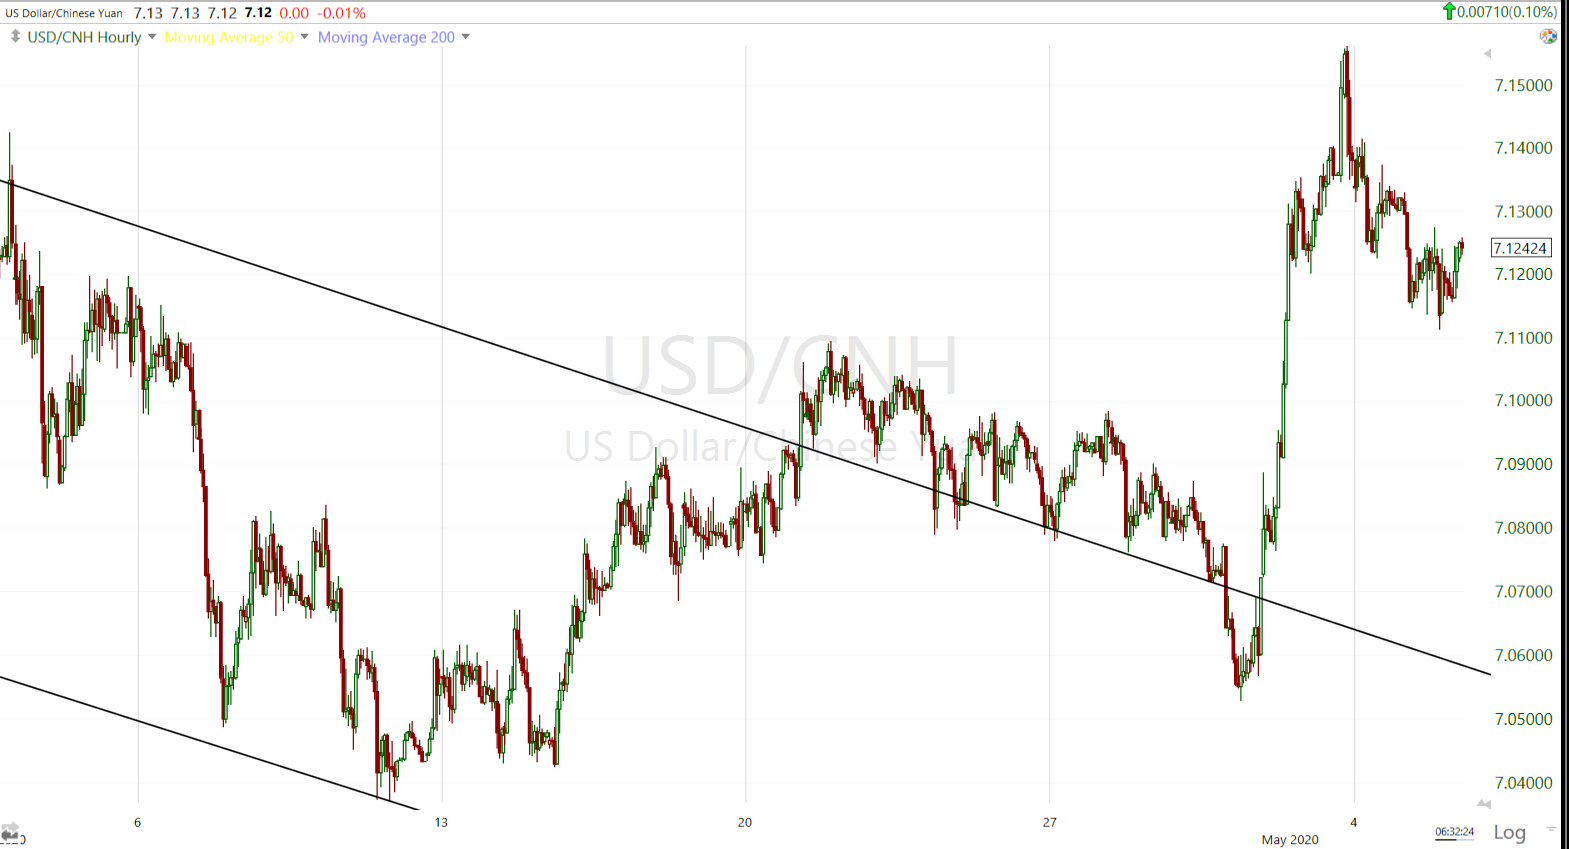
USD/CNH (60m) the yuan is also consolidating after last week’s sell-off. The currency market is clearly still concerned about escalating U.S.-China tensions and what form they’ll take.
The re-opening enthusiasm still buoyed oil prices by 20% to $24.53 amid expectations for a demand recovery.
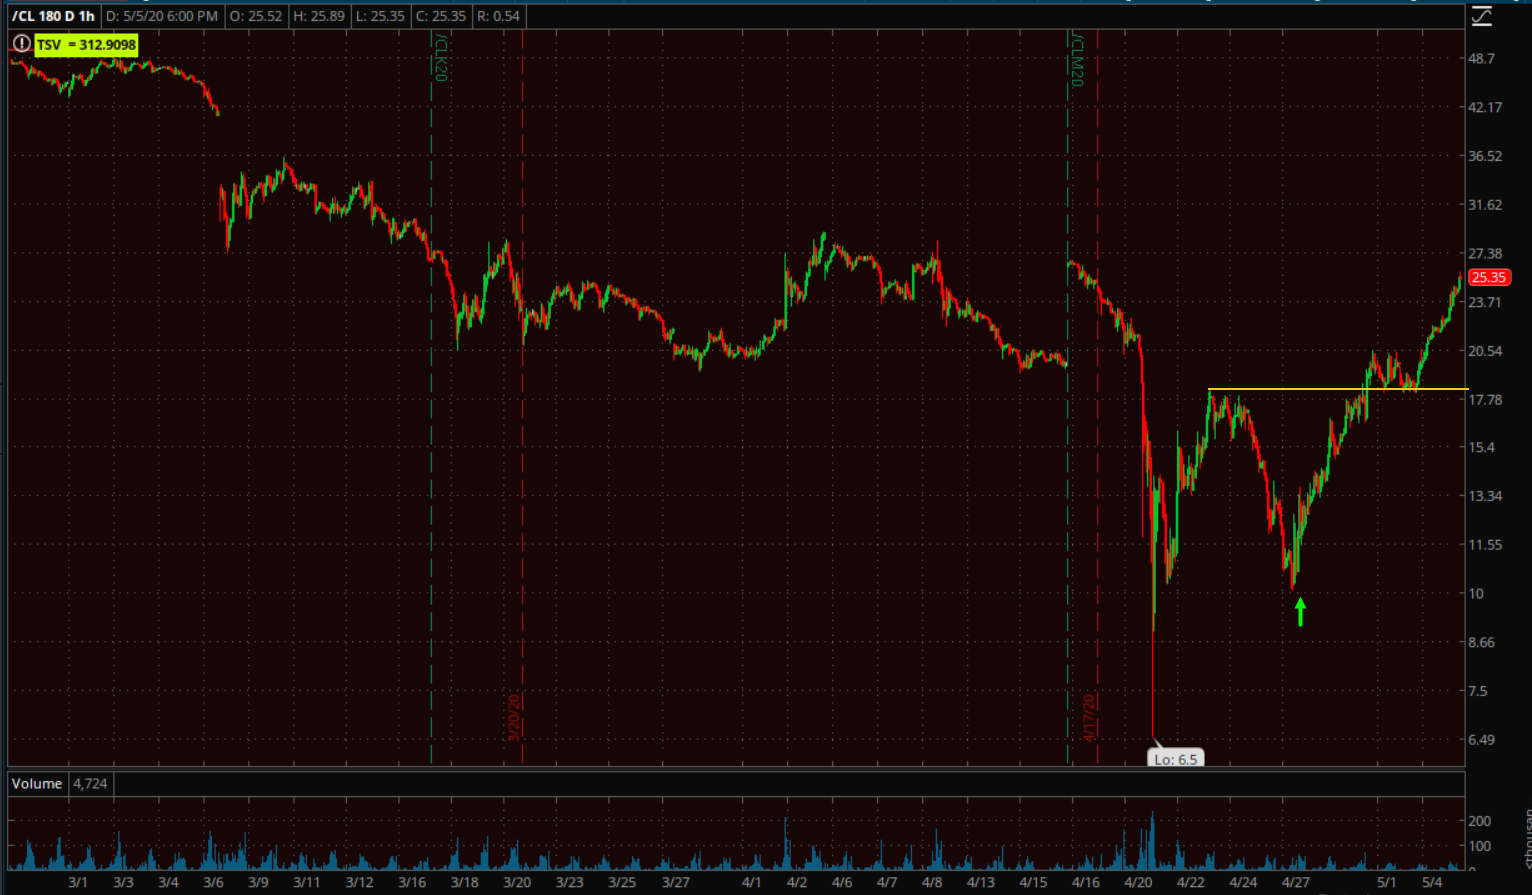
WTI Crude futures (60m) continuing last week’s rally, which made a higher high.
Summary
We’re still in earnings season and earnings season tends to be range-bound or lateral and choppy. In part, this is why I’ve phased into my Small cap short position. Because of the 5 weeks of sideways price trend, there are a lot of technical levels nearby. Moving averages converge with prices and the ranges create numerous support/resistance zones.
Last week’s breakouts from 5-week ranges failed with weakness on 3C charts evident early in the week. From a risk-reward perspective, to me that was an ideal time to enter/add to my short and I did add some. I prefer to sell short into price strength and cover into price weakness, the opposite of buying price weakness and selling price strength. If market signals are so clear and shift probabilities immediately, I’ll fill into a soft or consolidating market, but I prefer not to sell short into outright weakness, or chase price. For me it’s striking a balance between probabilities and risk/reward.
What I’d like to see to fill out the rest of my small cap short is some clear market/macro signals that stocks ignore. For example, the Aussie or Chinese yuan breaking down from the week’s consolidation, or S&P sectors breaching important support/ranges while the averages ignore the signals. On Friday the averages fell with those signals in FX. No major average or S&P sector has locked in a failed breakout yet, but Transports, and a few sectors like Banks/ Financials are close.
A potential set-up would be the Aussie or Yuan breaking below their consolidation and/or some S&P sectors doing the same (market signal), as the averages fill their gaps (selling into strength), ideally on clear divergences. All things being equal, prices like to fill gaps.
Overnight
After the close Disney reported earnings, profits plunged in the second quarter by more than half and Disney suspended its dividend.
Overnight S&P future are near flat, down -0.10%, but the tone tonight is a little dicey as compared to this time Monday night.
Russell 2000 futures (1m) show a positive divergence in the early morning hours after Europe opened (green), and a relative negative divergence into the U.S. cash session (yellow). 3C is close to leading to the downside and is the weakest looking of the index futures. Small Caps entered today’s session with clear relative strength and lost all of it by the close.
WTI Crude futures initially gained in early after-hours despite an unexpected build in crude inventories, but crude just lost the gains and is down slightly -0.5%. Monday night crude’s strength set a positive tone for the overnight session, that’s missing tonight.
AUD/USD (15m) is looking a bit weaker early tonight as well.
Looking ahead, investors will receive the ADP Employment Change Report for April and the weekly MBA Mortgage Applications Index on Wednesday. The Bank of England has a policy decision on Thursday. Friday brings the key U.S. jobs report for April, expected to show a severe impact from the pandemic. The median forecast in a Bloomberg survey of economists calls for a 21 million plunge in payrolls.