Subscriber’s Daily Wrap
The Daily Wrap is posted every Monday through Thursday for subscribers. Since there’s so much of interest going on, I thought I’d share this one publicly. I hope you enjoy it and find some use and value in it.
In last night’s Daily Wrap I wrote,
“All of the major averages ended the day at session lows, which is never a good sign for the next morning’s trade.”
Today’s market tone was incredibly similar to yesterday, fairly narrow ranges not far from unchanged in low volatility trade early on, but sharper selling in the afternoon, just today the sharper selling started 2 hours earlier than yesterday. This smells like the mechanical, rules-based trading systems known as CTA’s, deleveraging as I mentioned earlier today. There’s no discretionary decision making for CTAs; price moves above or below a level and they have a certain percentage to buy or sell. If price moves even further to the next level, they have a larger percentage to either buy or sell. It’s a predetermined formula and they execute on it, there’s no “Well I think technical support may hold here” in the decision making process. CTAs are basically the modern or current take on systematic trend following, and because they have similar rules, they tend to transact together, whether buying or selling.
Employment data has been mixed lately, from a very strong trend up until a couple of months ago when it became more uncertain and mixed. However, this morning Initial Jobless Claims came in strong, which contributed to the move in Treasury yields. Claims dropped to 239,000 from 250,000 last week.
Ultimately, however, it was another jump in rates behind the selling. In the summary section below I’ll show you when and where stocks started ignoring what had been a very strong inverse correlation with yields this summer, and when and where they reconnected with that very strong inverse correlation – going back to at least 2021 as I showed in last night’s Daily Wrap.
The 10-year Treasury yield gained five basis points today to 4.31%, not just making a new cycle high, but settling at its highest level since November 2007.
Averages
Although not by a huge margin because pretty much everything was sold in orderly deleveraging (typical of CTAs selling), once again it was NASDAQ-100 and Small Cap Russell 2000 that were the weakest performers. Dow Transports were down -1.05%. The afternoon selling was steady, but orderly, and broad-based, which also smells like CTAs in action.
S&P-500 ⇩ -0.77 %
NASDAQ ⇩ -1.08 %
DOW JONES ⇩ -0.84 %
RUSSELL 2000 ⇩ -1.15 %
Once again the major averages closed at or just barely above their session lows, which again, is never a good sign for the next morning’s outlook. Last night I mentioned to pay attention to the S&P’s $4400 level early on as it is important from a psychological perspective…
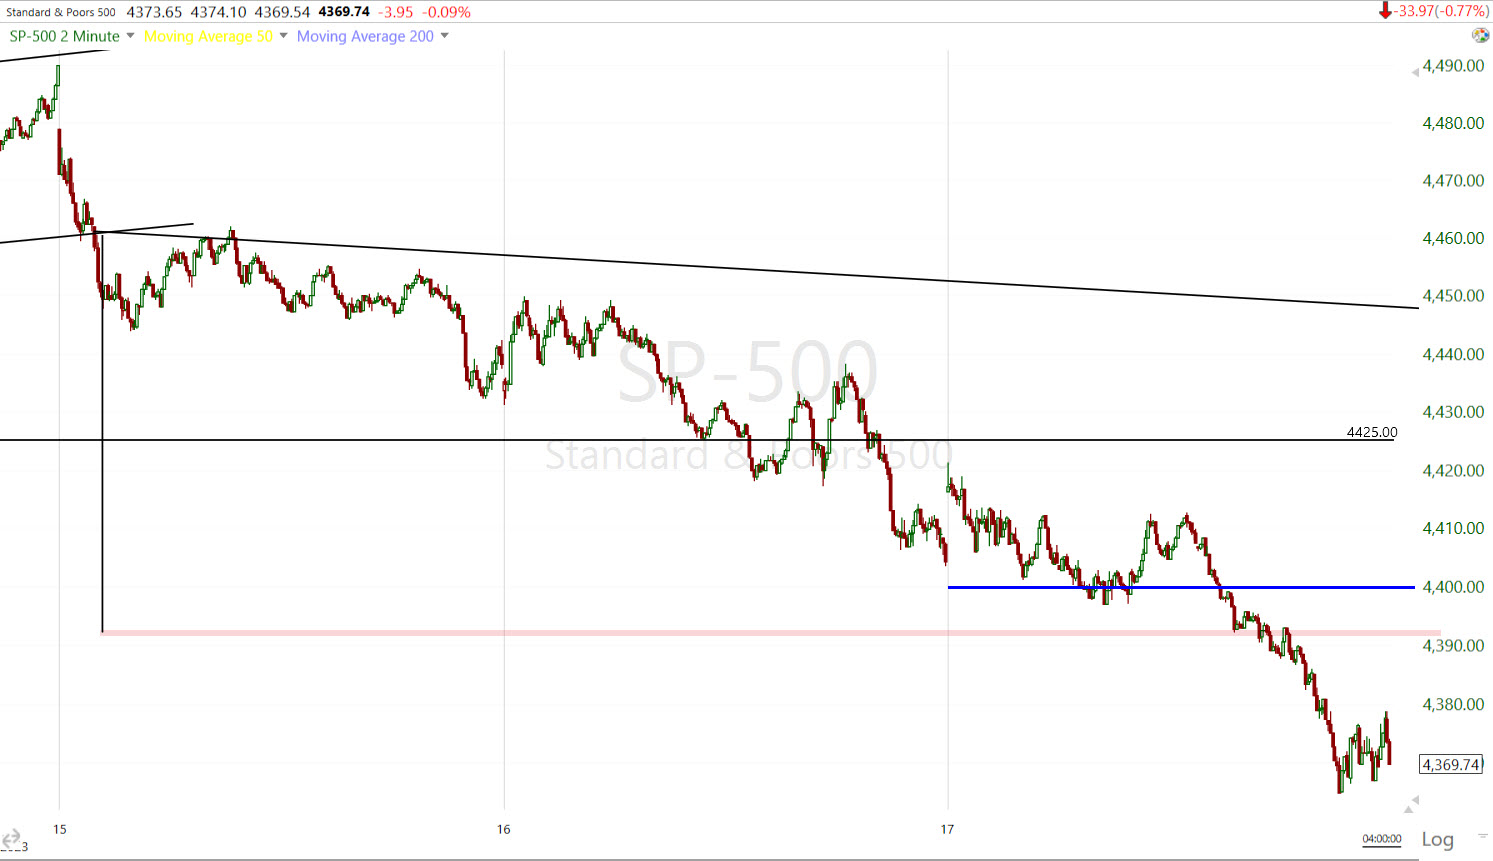 SP-500 (2m) tested $4400 (blue trend line) in the first half of the day and managed to hold the level, but then sliced below it in the afternoon and easily hit the updated downside measured moves posted in last night’s Daily Wrap, which was $4380-$4390 for the S&P (red shaded area). Also note that the last 45 minutes of trade before the close, S&P’s price action is bearish, like a very small bear flag, ending below $4400 (blue) and the measured move (red).
This afternoon the NASDAQ-100 tagged its updated measured move from last night’s Daily Wrap, and pretty much right on the nose…
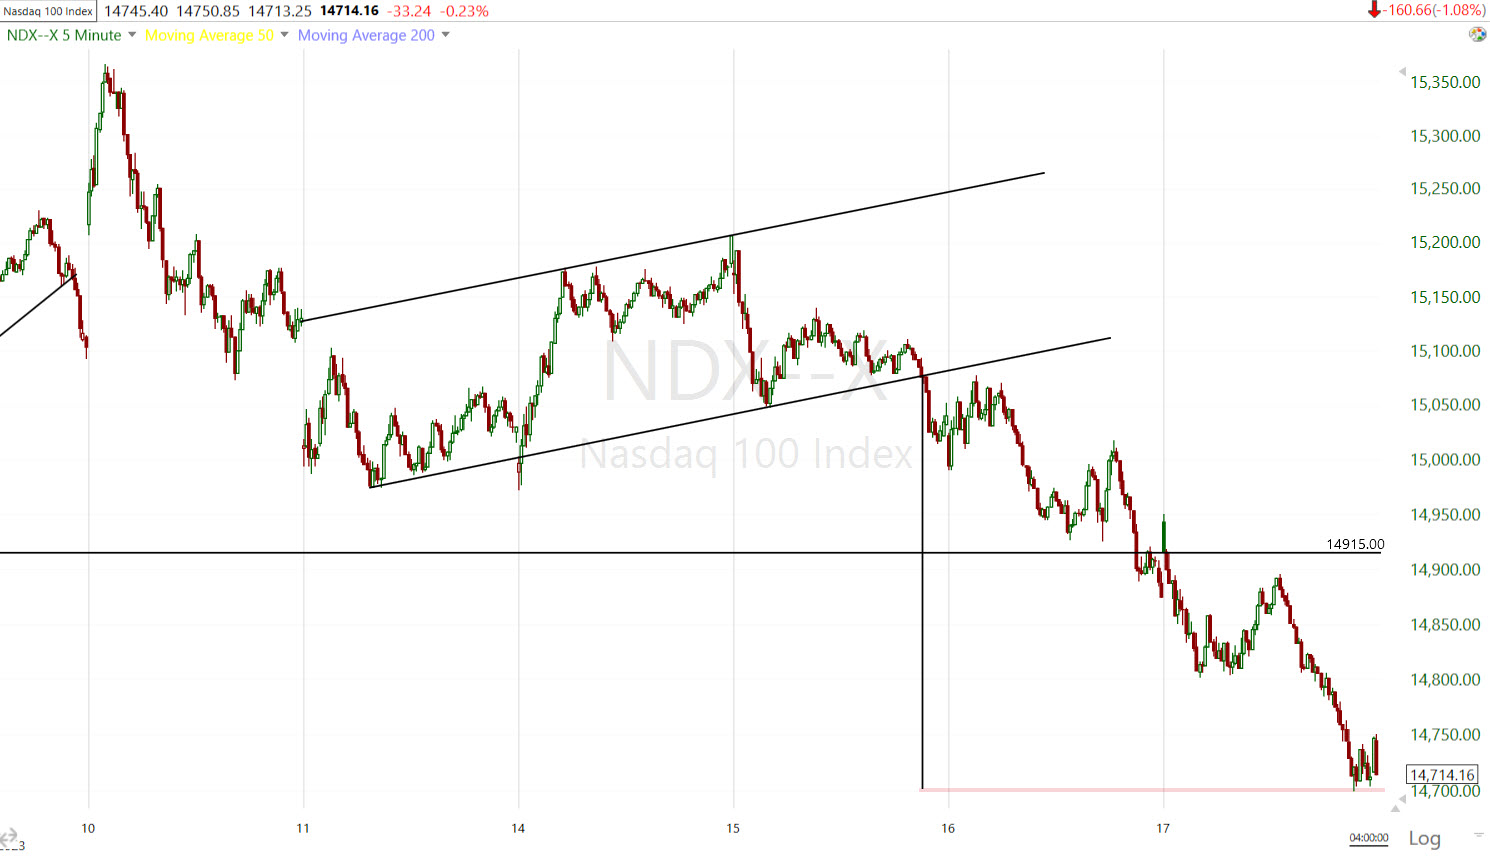 NASDAQ-100 (5m) the measured move (highlighted red) was called out last night as being $14,700. The session low for the NDX was $14,698.29 – exactly $1.71 below the target level which is less than two-tenths of a percent!
Today the Dow joined the S&P, NASDAQ-100 and Small Caps in closing below its 50-day sma.
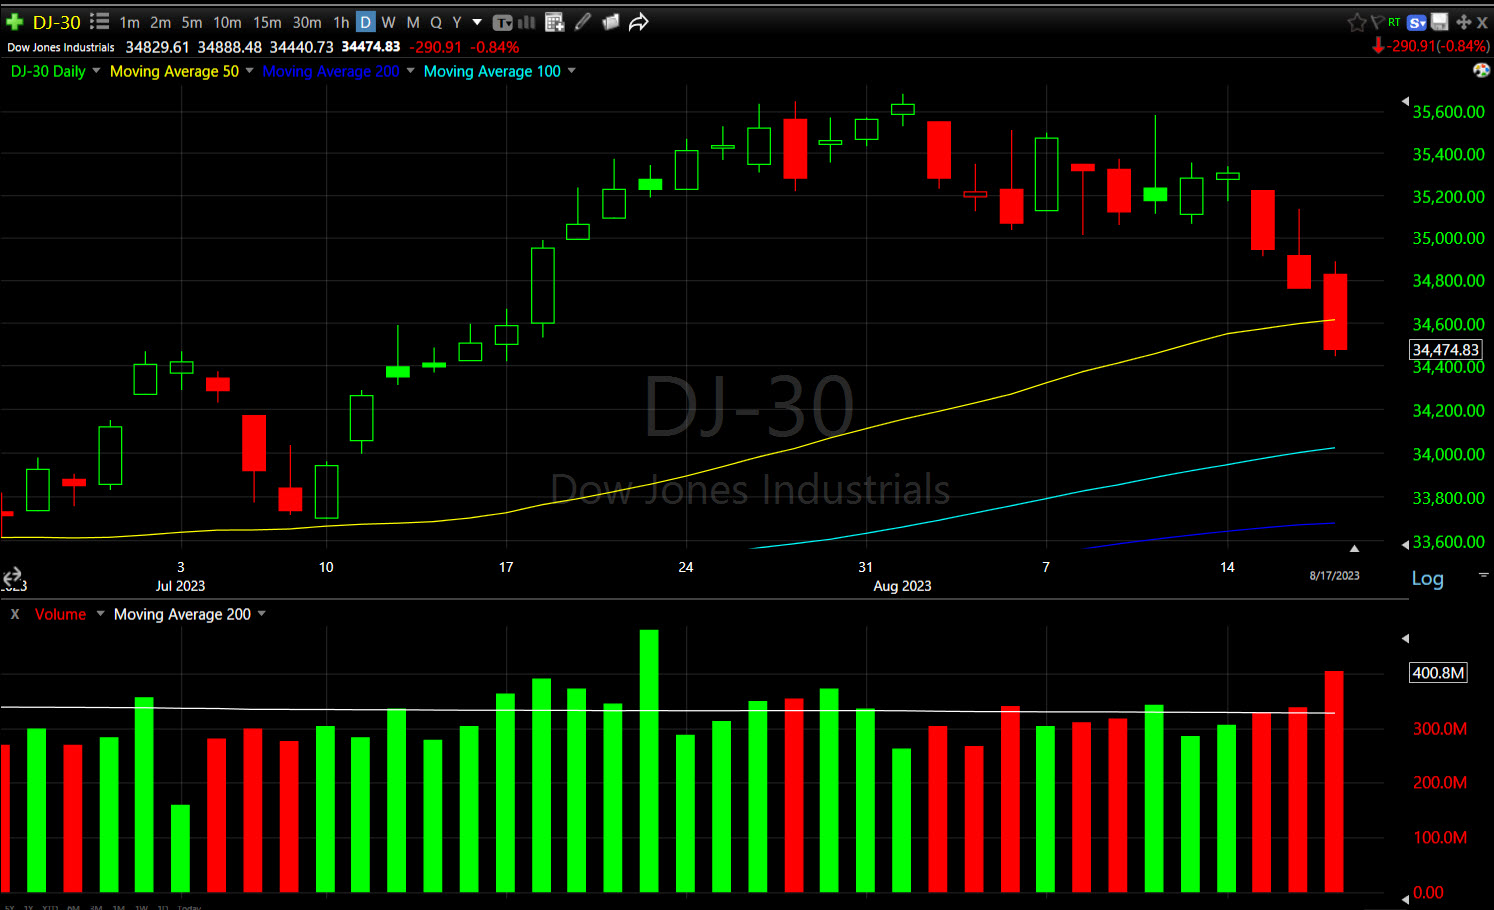 Dow (daily) and it did so on heavier volume, which is not a good sign when breaking a technical level like the 50-day. Technical traders who placed stops there are selling.
As suggested last night in theorizing where the Dow and Small Caps may end up since they didn’t have bear flag’s to calculate measured moves, I wrote this about Small Caps potential downside target…
“Considering the measured moves for S&P and NDX, I do think it’s interesting that both the 100-day (light blue) and 200-day (darker blue) moving averages are between -1.65% and -1.75% lower from today’s close. That seems like a reasonable target level.
The Dow also does not have any notable bear flags to come up with measured moves, but its 50-day sma is about a half percent lower at $34, 595.”
IWM closed about a half percent above the moving averages, and in fact as you can see, I called out the Dow’s 50-day.
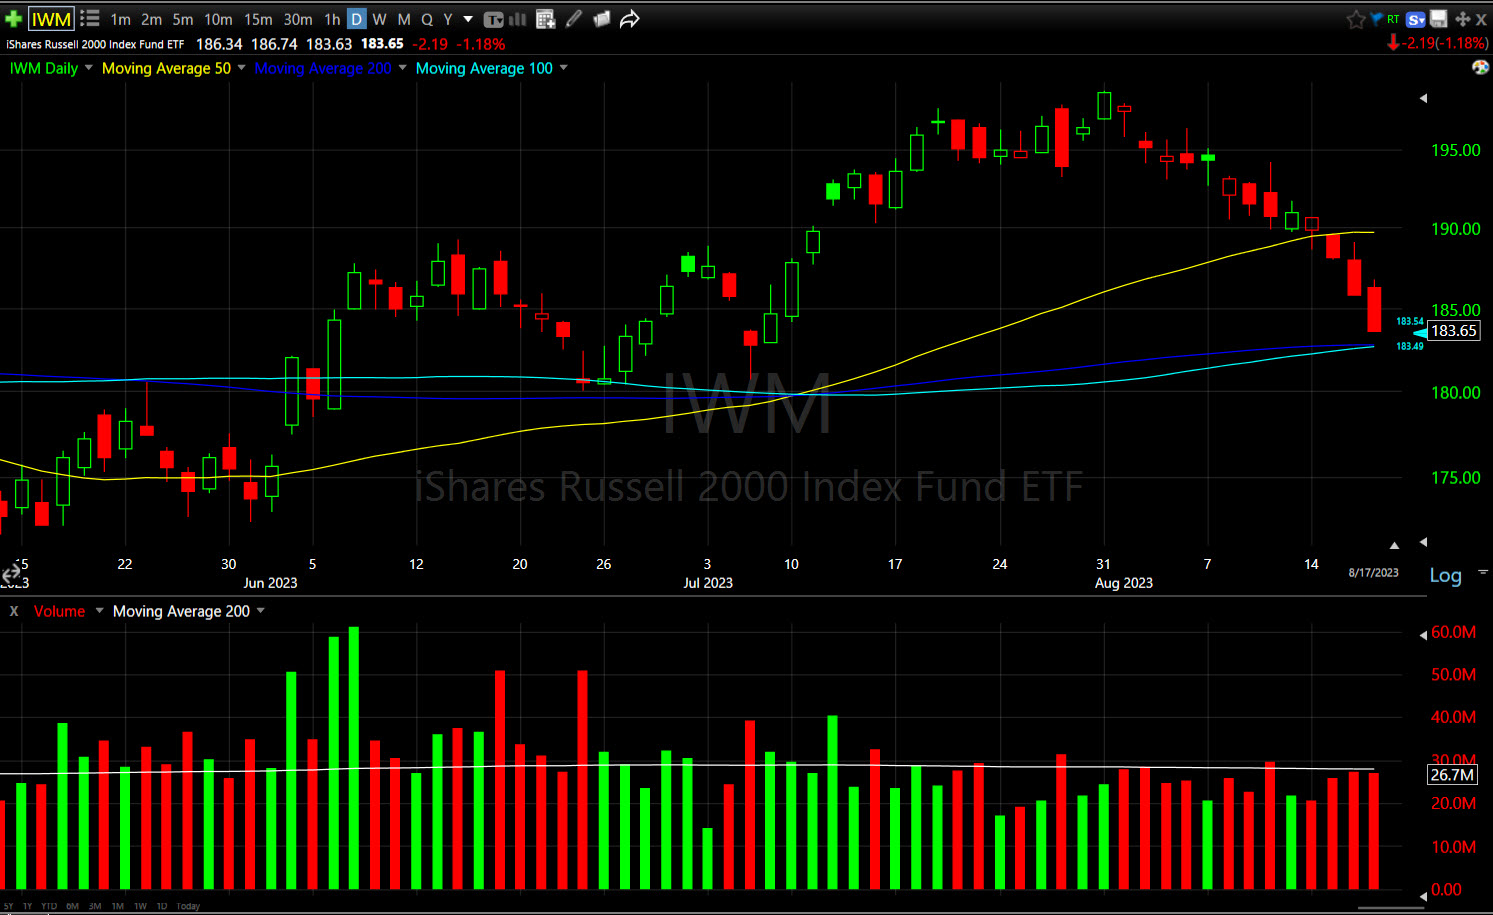 Small Cap IWM (daily) with the 100-day (light blue) and 200-day (darker blue) SMAs just below.
My Most Shorted Index is leading below the S&P and is nearing late June lows.
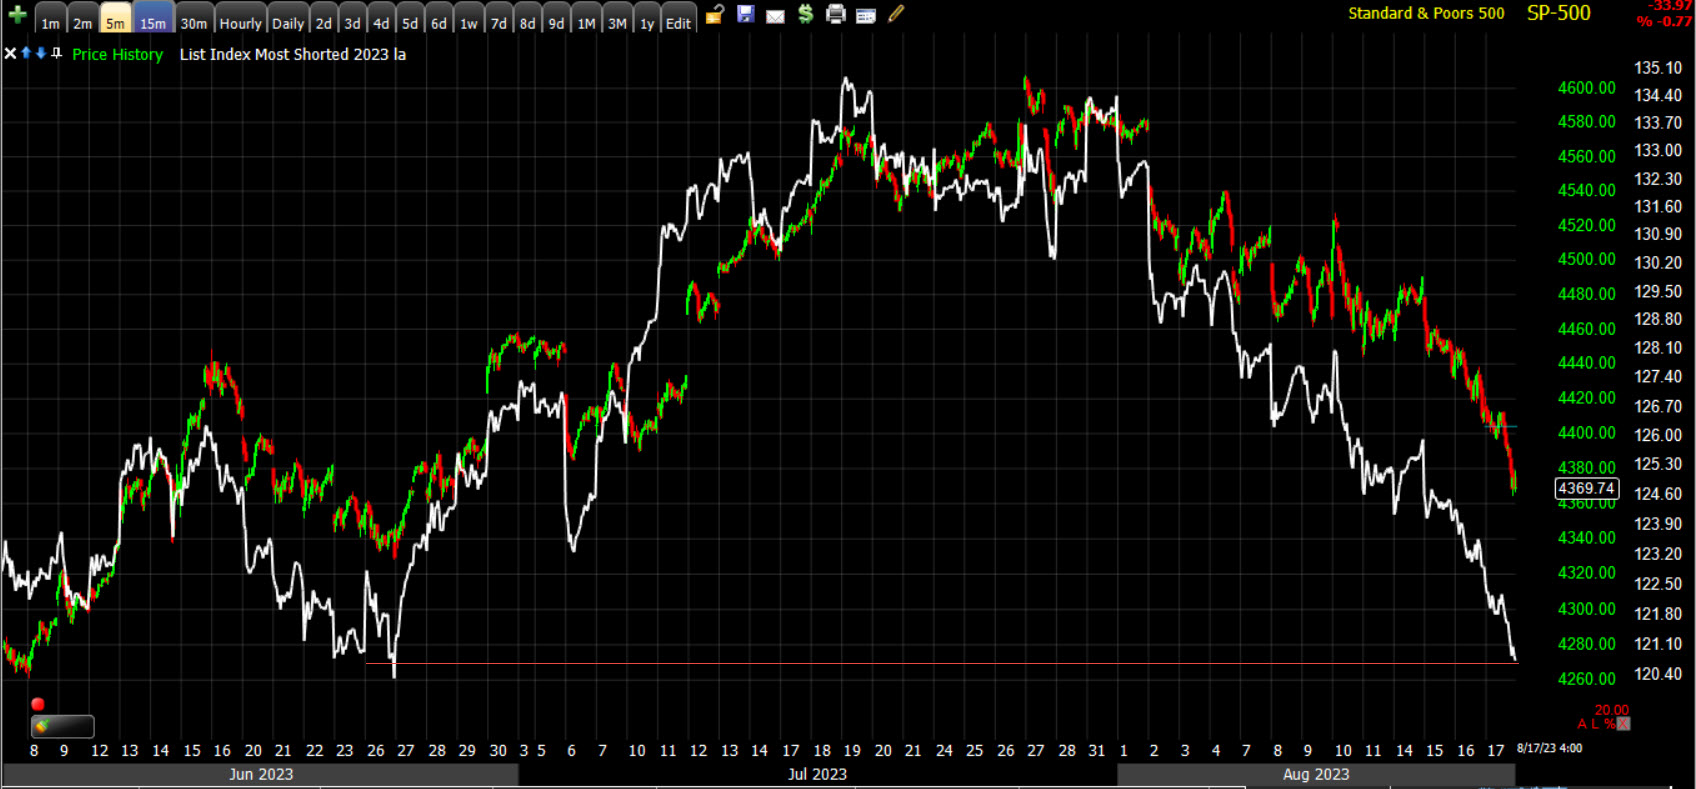 SP-500 (5m) and my MSI. I honestly don’t think this is a good price level forecasting indicator, but just for context, where it is now is around where the S&P was about 1% lower from here, and that’s an interesting percentage to note once you see the Summary section below.
VIX (+6.6%) pretty much closed the relative weakness gap that was formed as the S&P came down toward its 50-day last week – now that price has blown right through the 50-day for all 4 major averages.
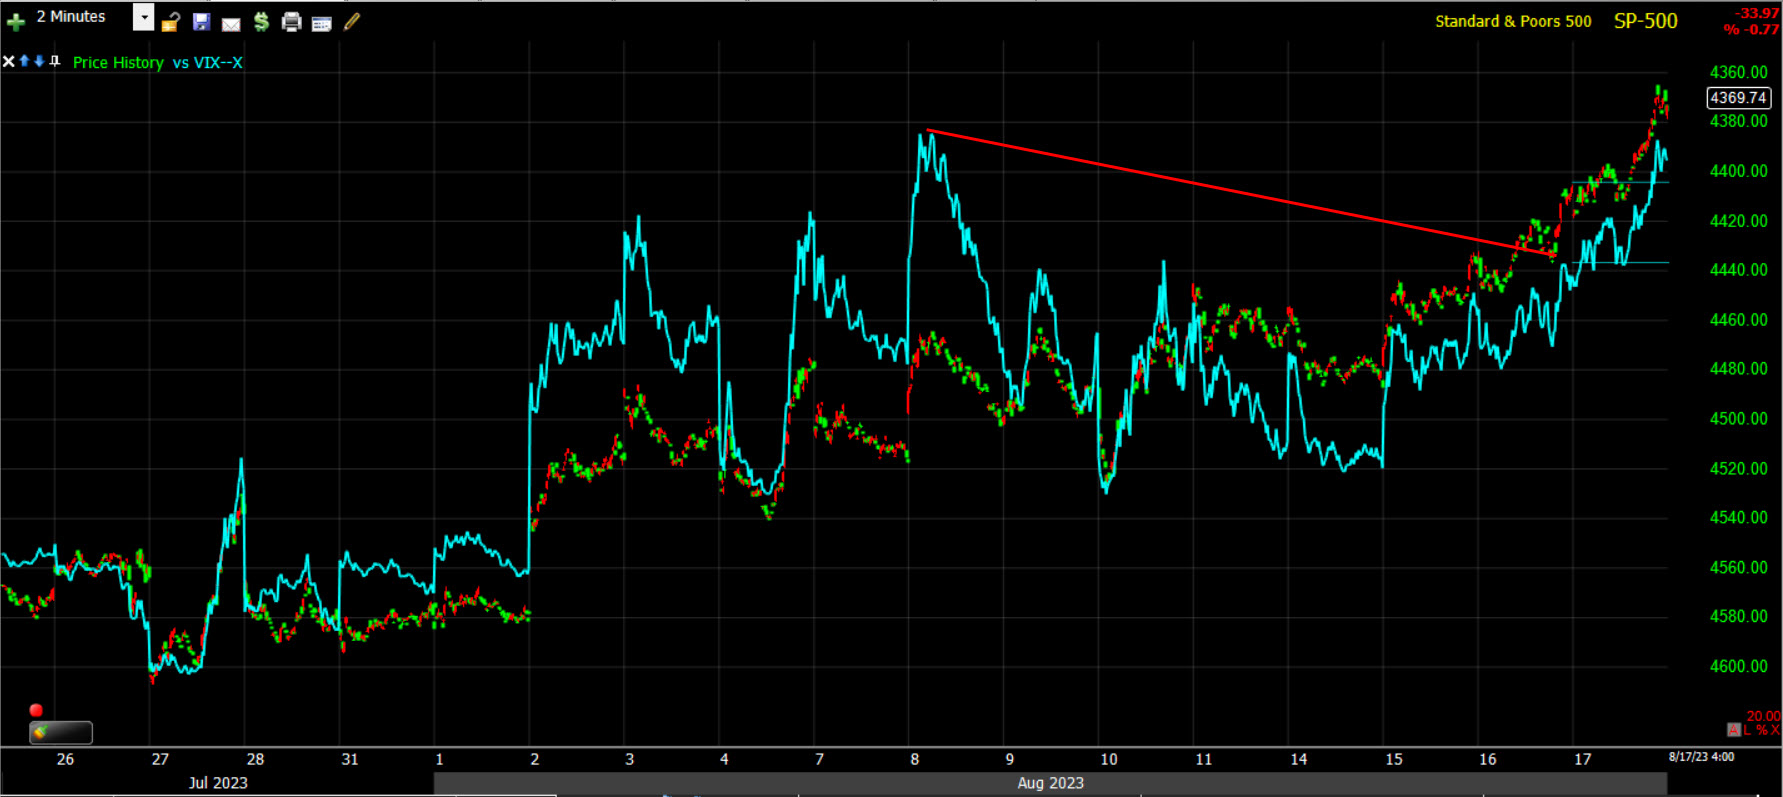 SP-500 (2m) with price inverted for context, and VIX (blue). There was still a trend of relative weakness as of yesterday’s close (red), although much less than a week ago. Today VIX pretty much closed that gap.
VVIX (+2.1%) gained less.
The Absolute Breadth Index jumped all the way up to 32 today.
S&P sectors
Ten of 11 S&P sectors finished the day lower in broad-based selling. Only the lightly weighted Energy sector finished the day higher with a bounce in Crude Oil prices. Among the more notable underperformers most of the day were the 3 mega-cap heavy sectors (Tech, Discretionary and Communications) pressured by the jump in rates, but many stocks came along for the downside move, which is typical of the broad-based deleveraging of CTAs.
The mega-cap index (MGK -1.1%) underperformed the S&P Equal Weight Index (-0.8%) by 30 basis points, which isn’t a huge margin. In 2022 the mega-caps were some of the worst performing stocks as yields rose in response to out of control inflation and the start of the Fed rate hike cycle. That meant that their very forward looking, and very high valuations had to be discounted. We routinely saw mega-caps underperform the equal weight S&P by 100 to 150 basis points on days they were down, so 30 basis points isn’t huge, but they are such heavily weighted stocks they really pressure the modified cap-weighted NASDAQ-100 and cap weighted S&P-500 to a lesser degree.
While there are mega-caps in the Dow, the Dow is a price weighted index. To give you context, that means the largest market cap company in the world, Apple, has the most influence of any stock in the two cap-weighted based indices (NASDAQ-100 and S&P-500), but in the price-weighted Dow, Apple is the 13th most influential stock out of 30, or right in the middle. United Health Care (UNH) has the highest price and therefore is the most influential stock in the Dow.
The other laggard was the counter-cyclical, defensive, but bond proxy sector, Consumer Staples. As a bond proxy sector, higher yields mean lower bond prices and that’s why it was an underperformer, and why Real Estate was yesterday.
Semiconductors (SOX Index -0.97%) performed in line with the broader Technology sector to which they belong, so while they did break below the measured move and the week’s low in the SOX $3500 area, they were not the relative underperformer today that they have been recently.
Interestingly, the KBW Bank Index and Regional Banks were both unchanged today, acting better than the broader Financial sector to which they belong.
Materials ⇩ -0.20 %
Energy ⇧ 1.20 %
Financials ⇩ -0.50 %
Industrial ⇩ -0.84 %
Technology ⇩ -0.95 %
Consumer Staples ⇩ -0.97 %
Utilities ⇩ -0.22 %
Health Care ⇩ -0.80 %
Consumer Discretionary ⇩ -1.69 %
Real Estate ⇩ -0.74 %
Communications ⇩ -1.15 %
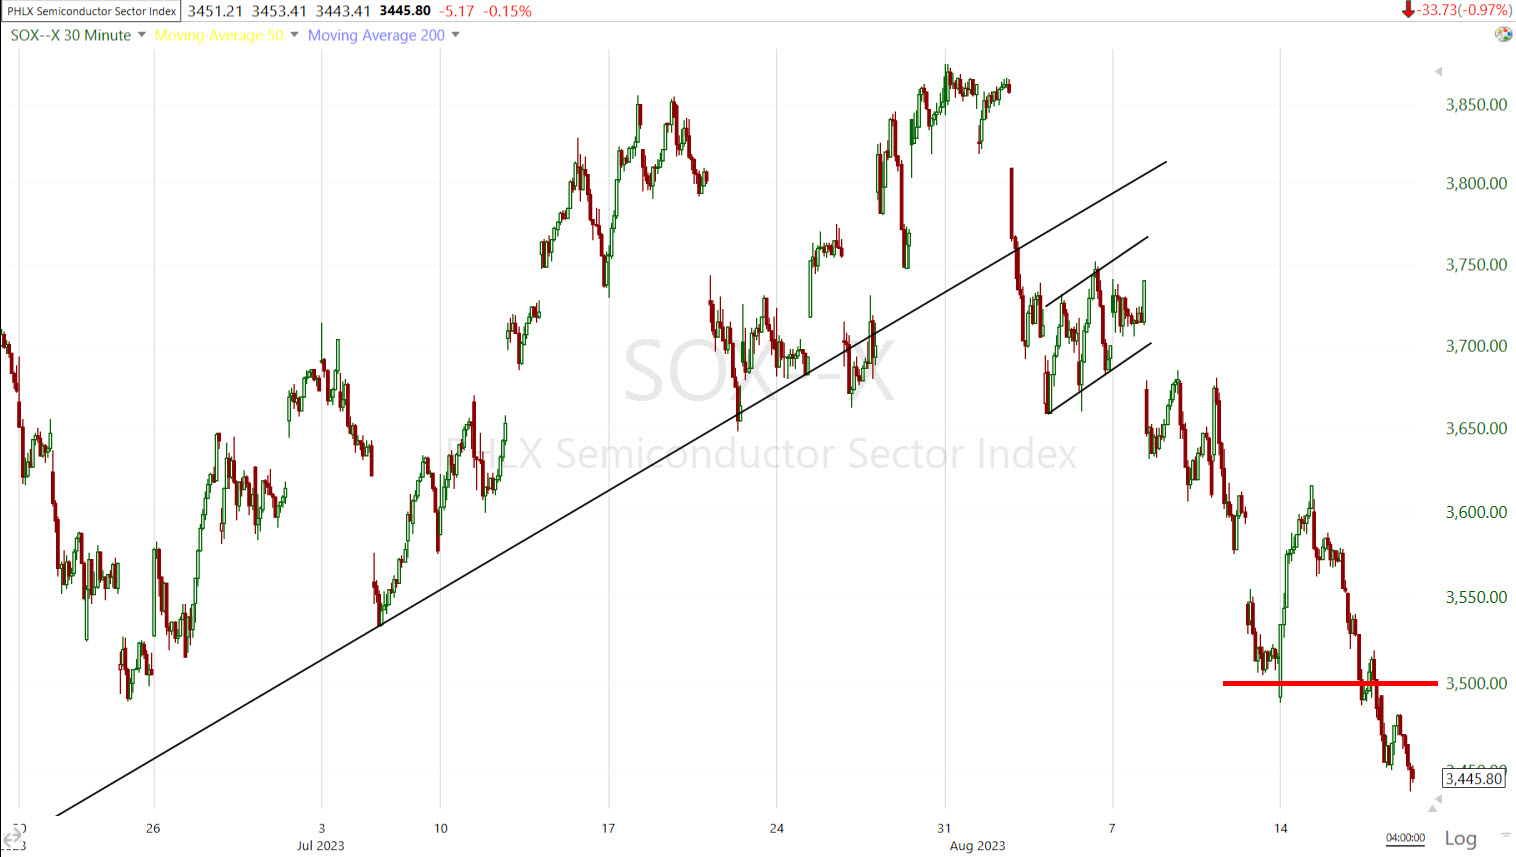 SOX (30m) other than hitting its downside measured move at $3500 (red), I can’t say there’s anything constructive about the near term price action. The strong rebound Monday made it unlikely we’d get another price consolidation and we did not, so there’s no additional measured move with which to work with. I will point out, however, there is a technical level coming up…
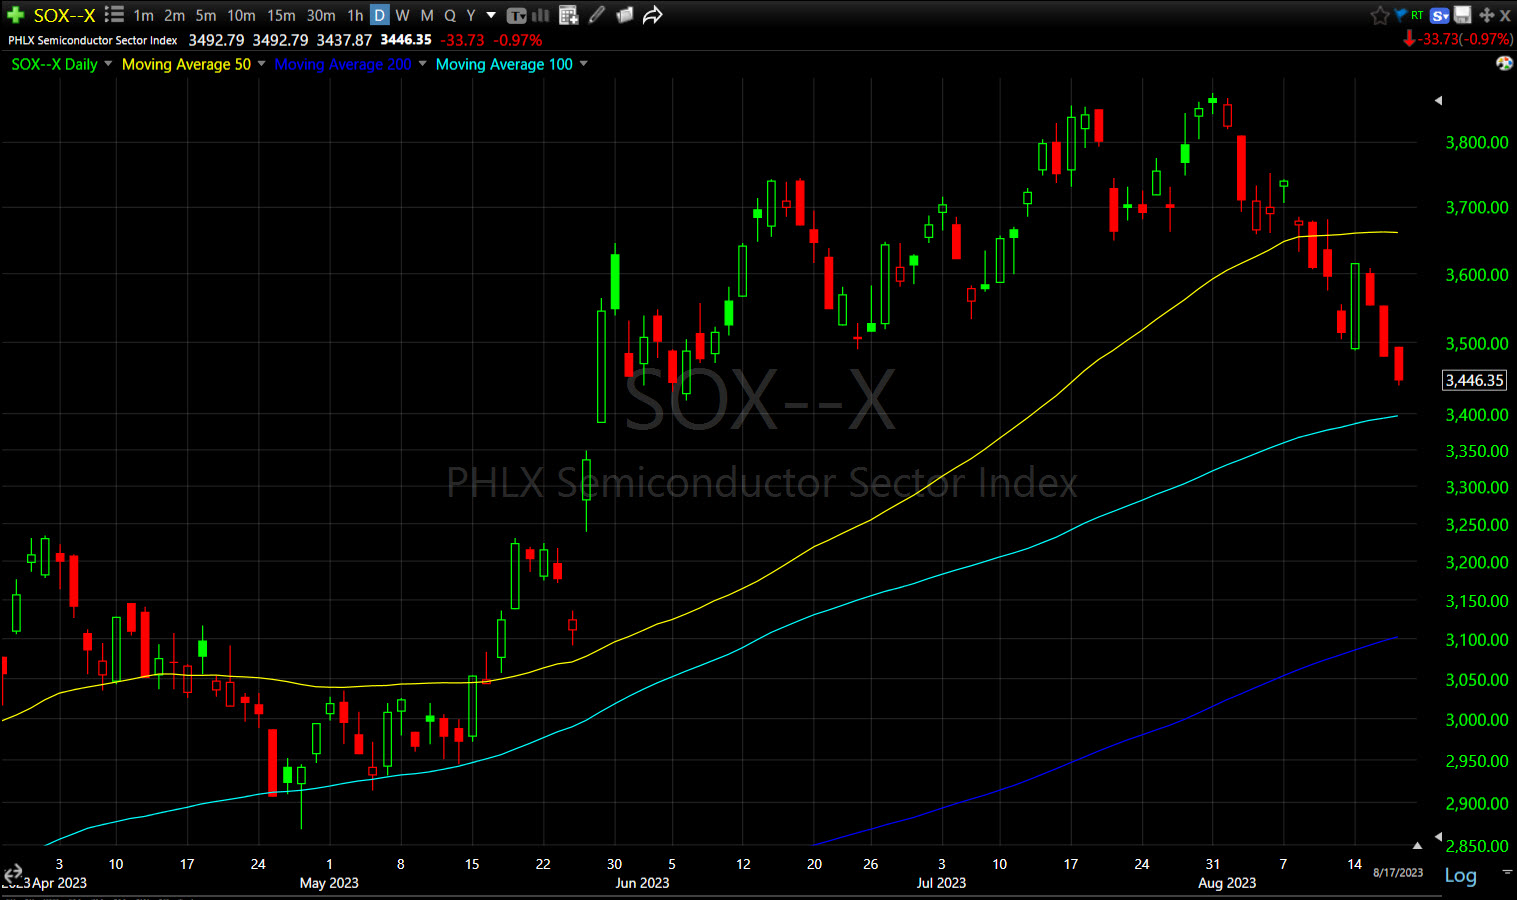 SOX (daily) is about -1.5% from the light blue 100-day sma. Notice how much support, and how consistent that support was when SOX pulled back to the 100-day in late April through mid-May. However, if it is CTA’s driving the bulk of selling, they do not respect technical levels or have discretionary decision making as part of their process. They just breach a price level and have a predetermined amount or percentage of their portfolio to sell. If price hits the next level down, they have another larger percentage of their stock to sell. This is where 3C comes in handy as we can see either the let-up of selling pressure, or the start of buying.
As for Regional Banks flat close today, there’s one thing to point out on the price chart…
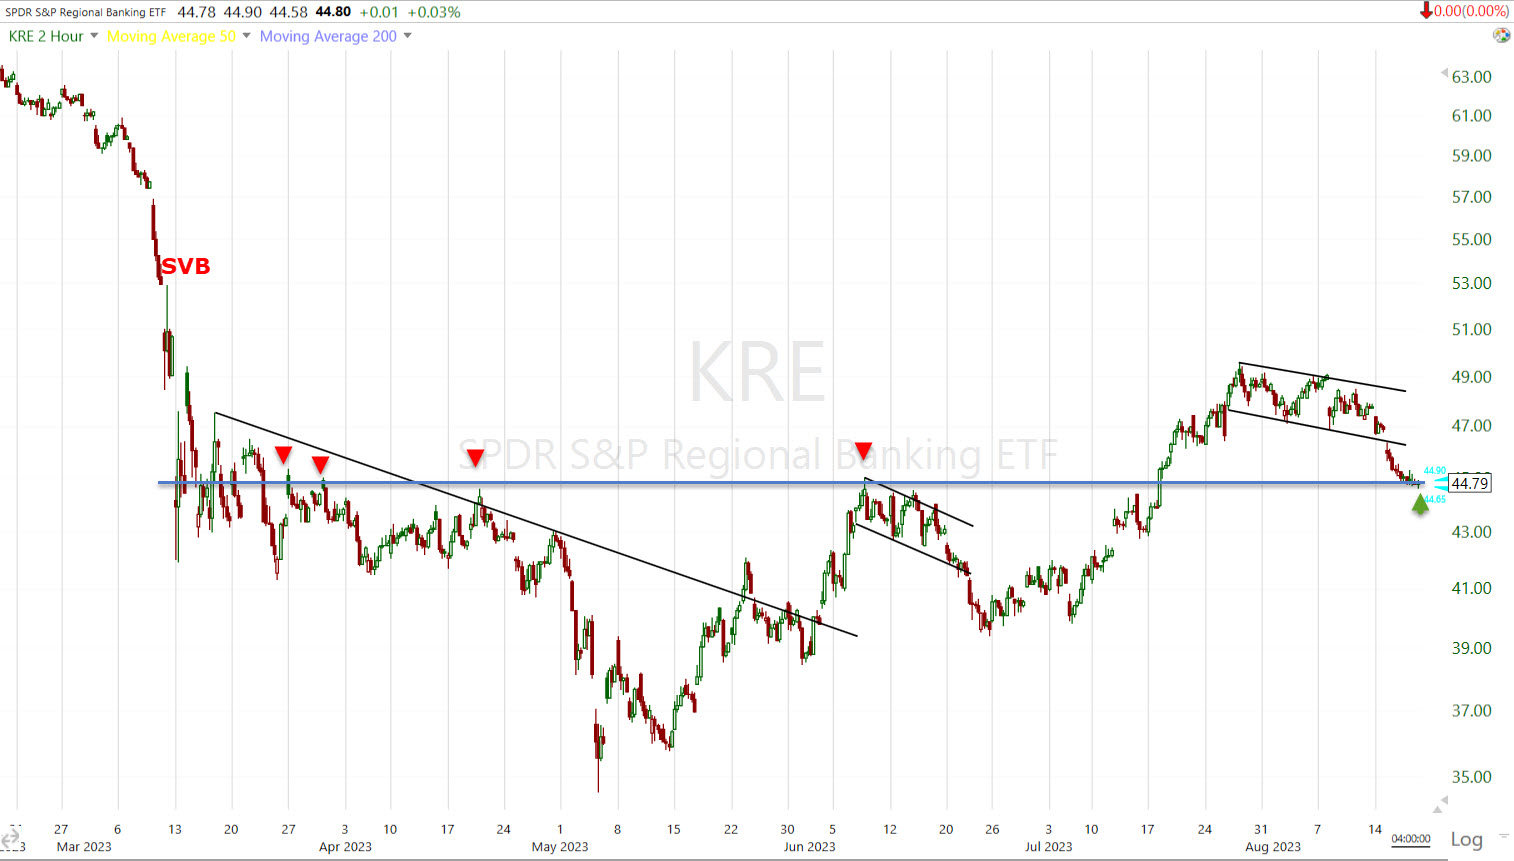 KRE (2H) this level (blue) is basically the end of the SVB disaster and a level of resistance that had been in play and tested numerous times until the mid-July breakout. Just as I demonstrated above, as to why the S&P’s $4500 and $4600 levels were important to me weeks ago, the more times a level is tested and acts as resistance, when price breaks out above it, the higher the probability that the former resistance level acts as support (and vice verse).
Dow component Cisco (CSCO +3.3%) was a winning standout after its earnings report while fellow Dow component Walmart (WMT -2.2%) logged a decline after its earnings report.
Internals
NYSE Decliners (2019) outpaced Advancers (833) by a better than a 2-to-1 ratio (oversold condition) on heavier Volume of 866 mln. shares (but still low due to the seasonal dynamics).
We finally got a solid Dominant price/volume relationship across all of the major averages coming in at Close Down/Volume up. Taken with a vast majority of S&P sectors closing lower and NYSE Decliners at least 2-to-1 over advancers, that gives us a 1-day oversold signal from internals.
Treasuries
It wasn’t so much how much yields were up today because we’ve seen the market ignore 10-basis point gains in yields this summer. It was the new cycle highs in the 10-year yield. The 10-yr yield rose five basis points today to 4.31% to the highest level since November 2007; and now up 35 basis points for the month of August.
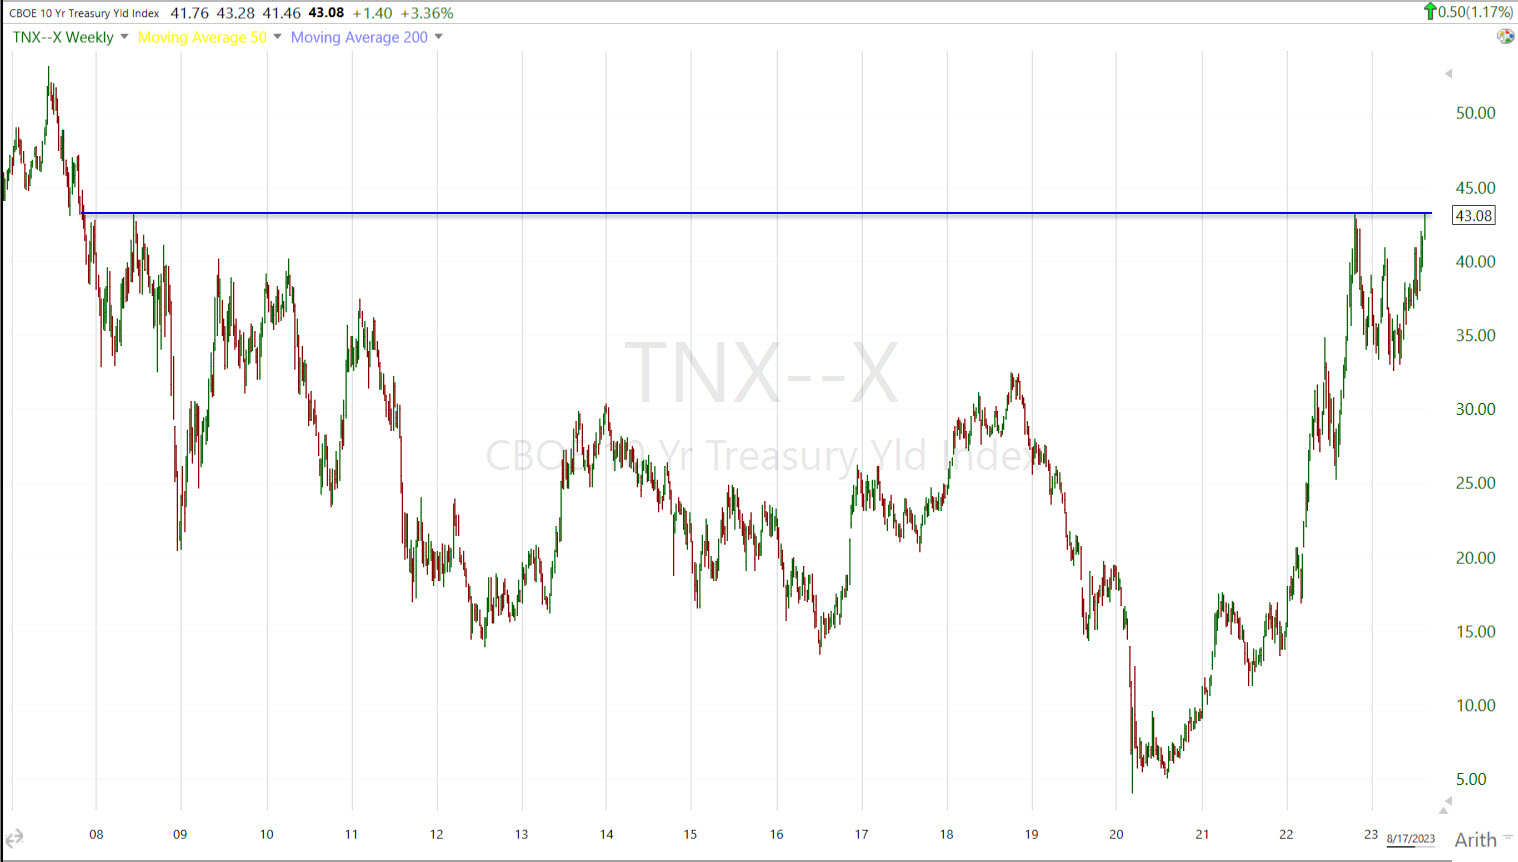 10-year yield (weekly) highest close since 2007.
There are some people making noise that the sharp rise in yields (to new cycle highs and highest since 2007 for the 10-year) may be due in part to China selling US Treasuries to fund the PBoC’s yuan intervention. I have no idea if that’s the case or not, but there’s talk.
High yield Credit (HYG -0.4%) has lost much of the short term positive divergence.
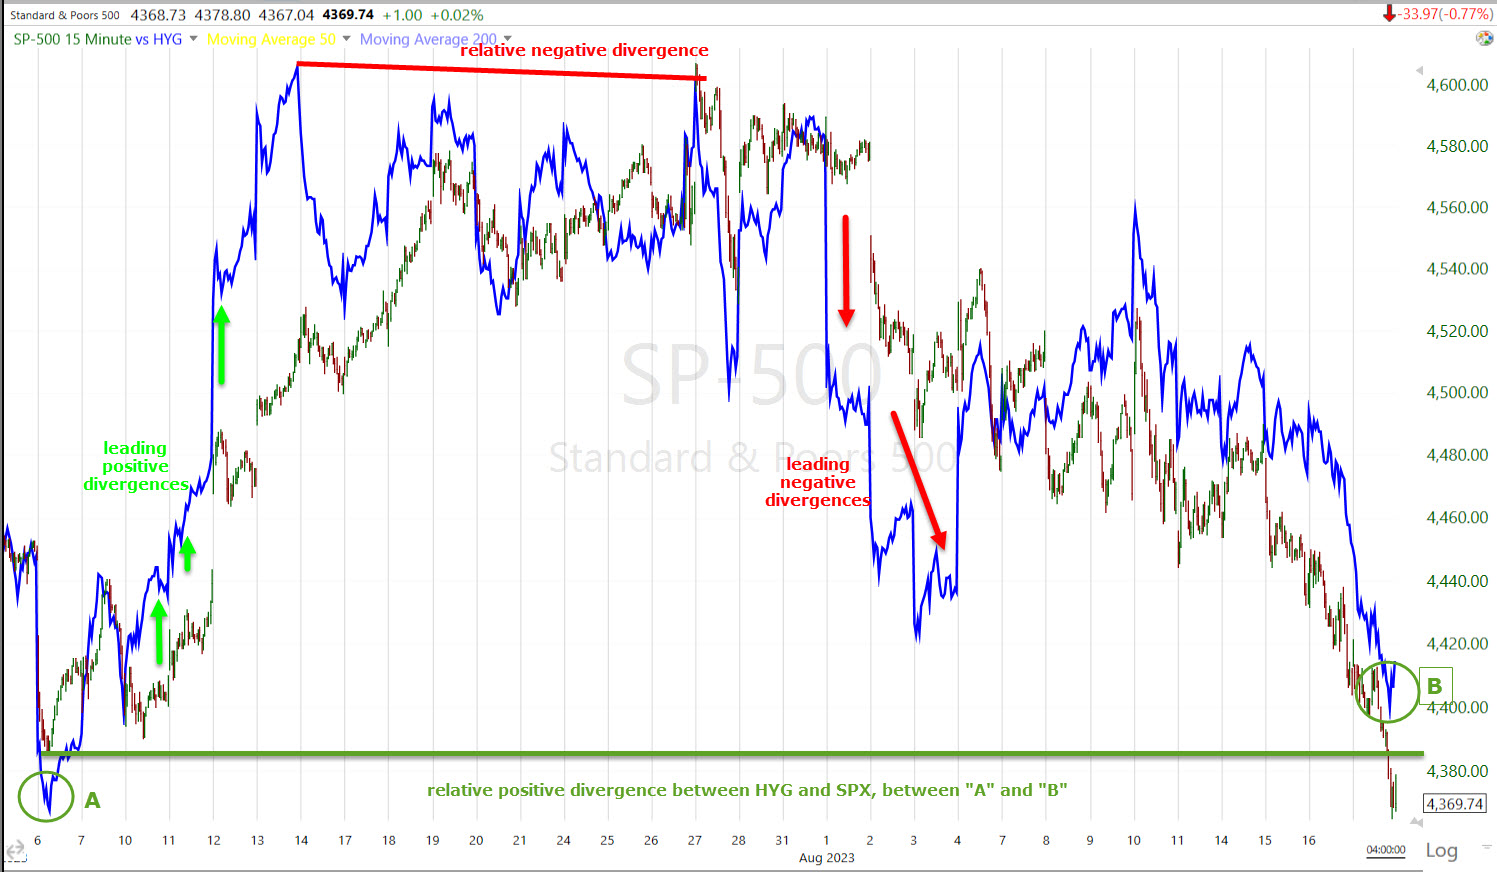
SPX (15m) and HYG. The chart above is notated with relative positive and negative HYG divergences, as well as leading positive divergences. As I said, much of the positive short term divergence is wiped out, but there’s still a small relative positive divergence at the green trend line toward the bottom of the chart. Both risk off sentiment and higher yields have weighed on Credit, but similar to volatility’s change in relative performance, I think another aspect is the divergence formed when the averages were holding their 50-day smas.
And from a longer term perspective we have the opposite…
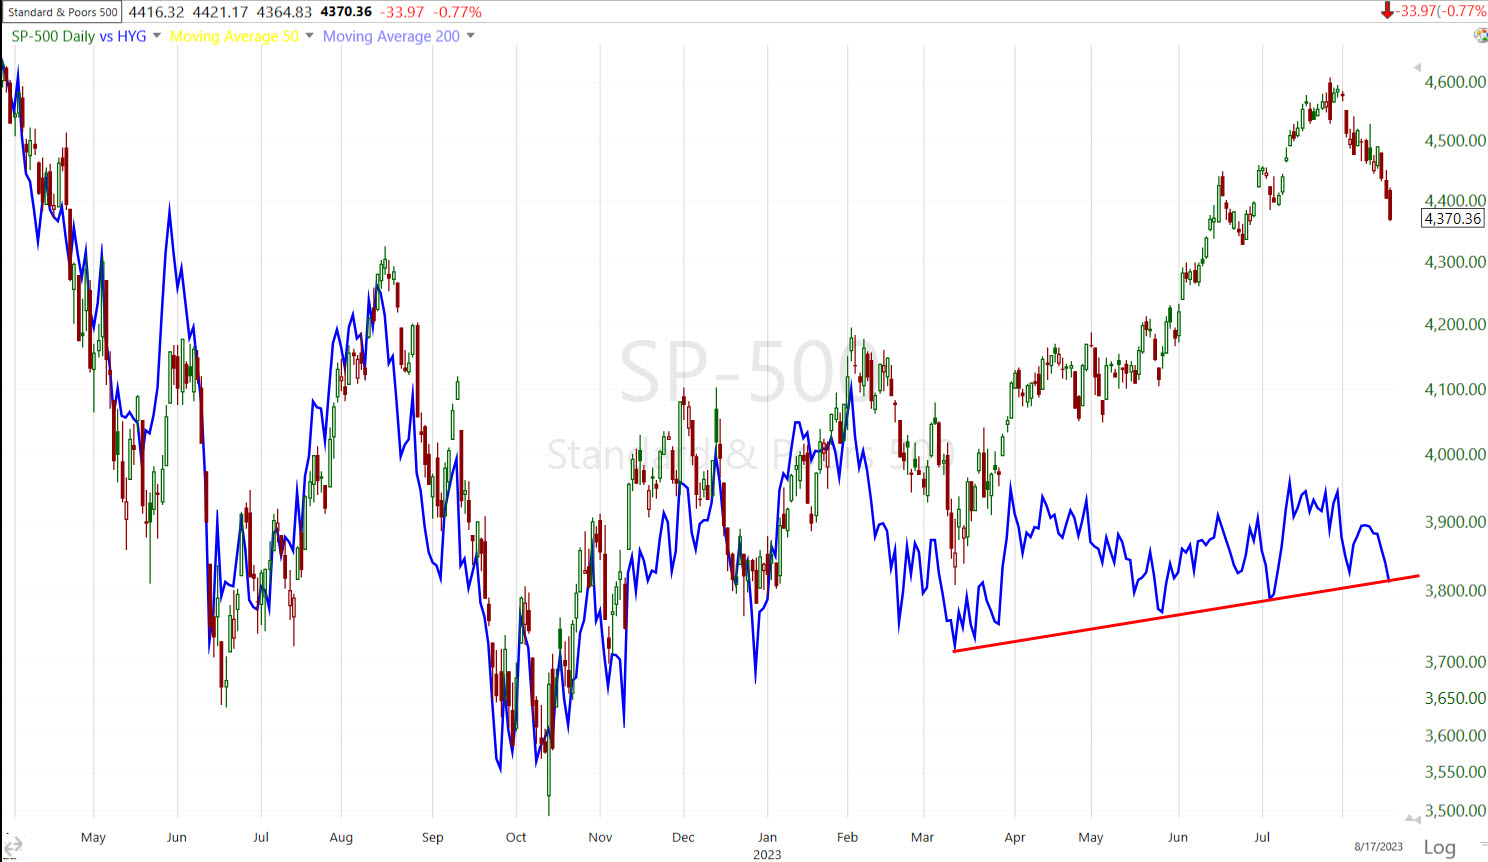 SPX (daily) and HYG – a massive negative divergence between Credit and the SPX. Ultimately looking at the big picture, I believe stocks will catch down to credit. Should HYG break the red trend line, then it will be an even uglier bearish market signal.
Currencies and Commodities
The U.S. Dollar Index ended the day flat.
WTI crude oil futures gained +1.1% to $80.31/bbl.
Gold futures settled today’s session down -0.69% at $1,915.30/oz.
Gold has been under selling pressure about the same time as stocks and for the same reason – the inverse correlation to yields, or to be more accurate, the inverse correlation to real yields (nominal yield less inflation), but since inflation numbers don’t change that often (not every day like yields), you can use yields.
Bitcoin’s break of $29,000 has had serious consequences.
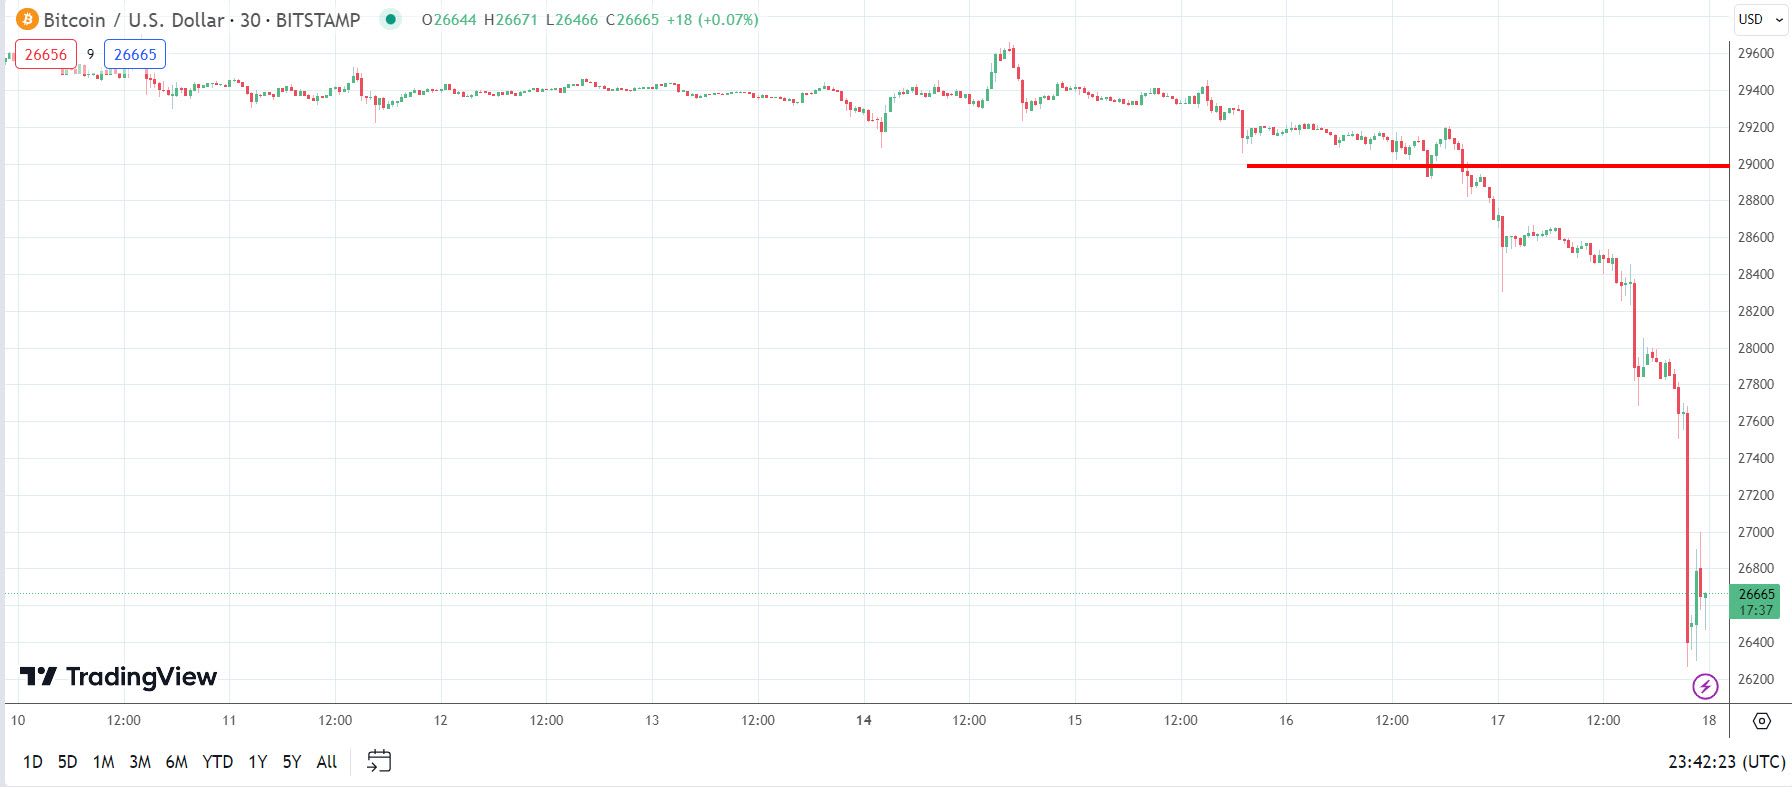 BTC/USD (30m) – price nearly tagged $26k today. This $2,000 plunge is also being attributed to this headline circulating,

Summary
Again, it’s worth noting what’s driving the market. Stocks and Treasury yields have had a very tight inverse/negative correlation for a long time – I showed a chart last night going back to at least 2021. However, this summer stocks ignored that correlation and traded higher despite rising yields.
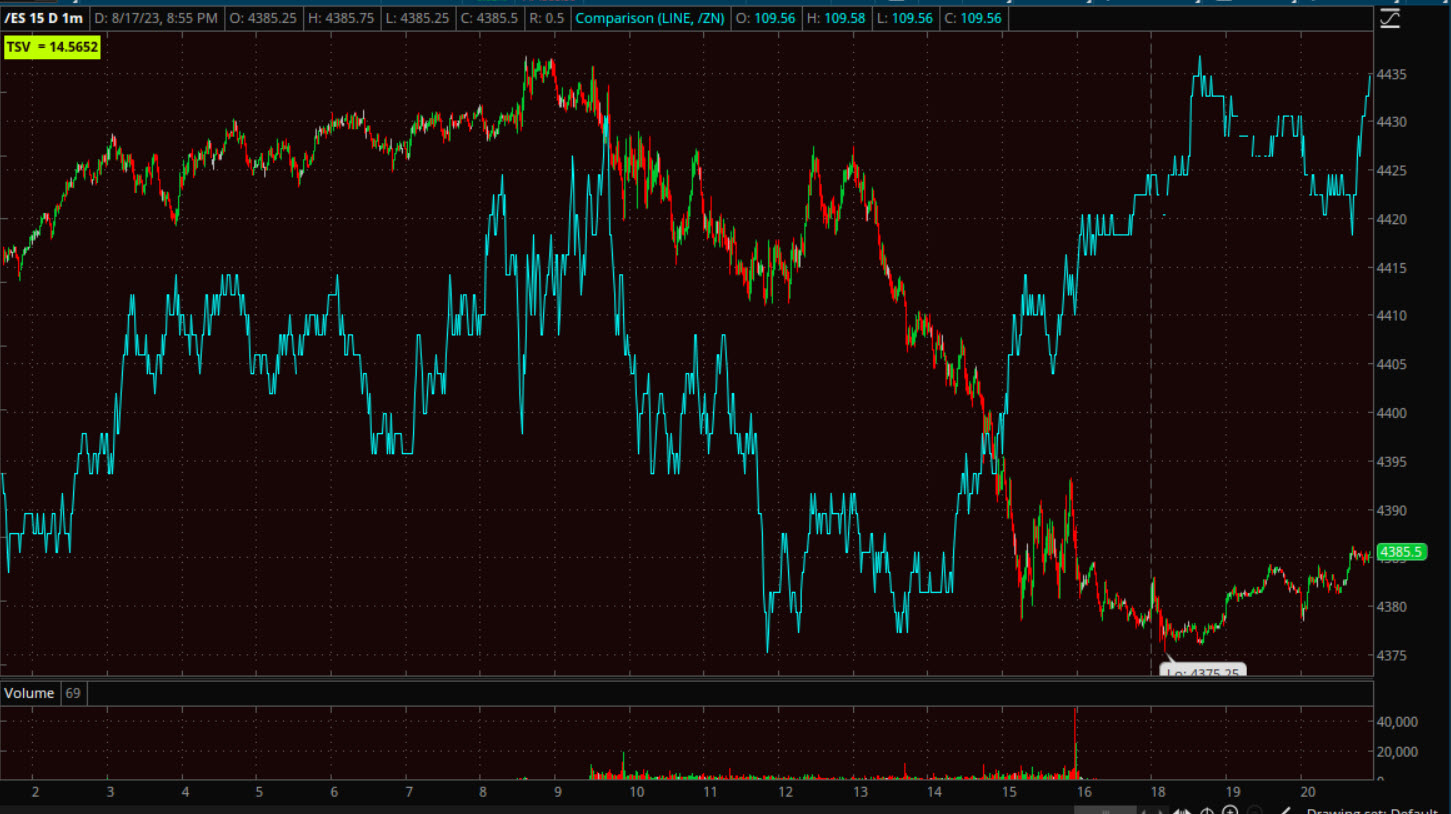
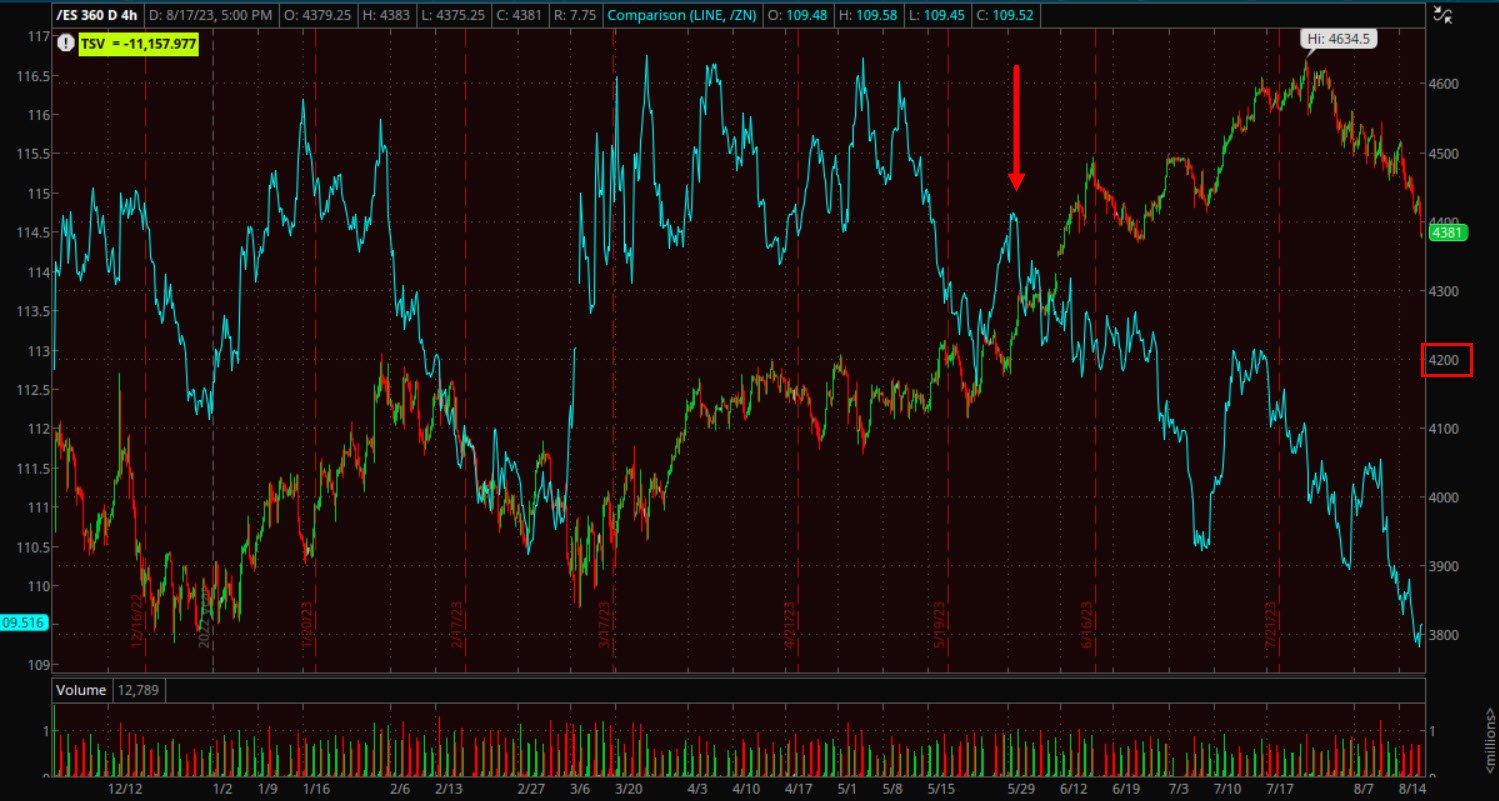 This isn’t the best scaled chart due to history constraints, but its S&P futures in the candlesticks and the 10-year UST futures in blue (4H). The inverse correlation with yields held strongly until the red arrow, which is exactly when the S&P closed above $4200, just as we expected- it stated a massive wave of short covering, which led to all kinds of other buying.
Fairly recently though, the correlation reasserted itself…
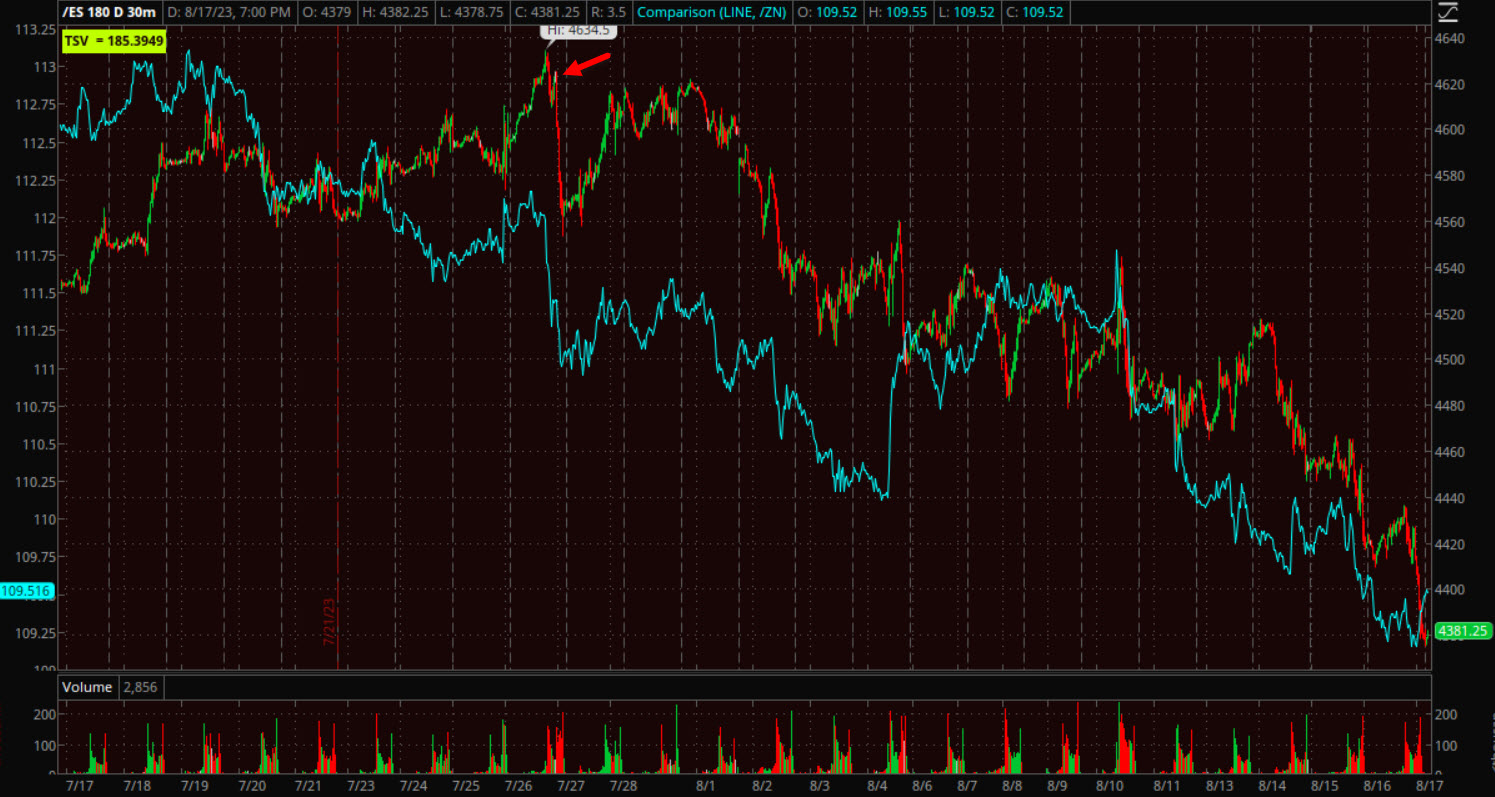 Here’s a 30 min chart of the exact same tow assets, the correlation picked back up at the red arrow. That happens to be the exact day the S&P put in a Key Reversal Day (you can even see it in the wide range of price /red bars), and that happened to be the exact day the 10-year yield closed above the important 4.00% psychological level. Since then, stocks have tracked very closely to treasuries, or inversely to rising yields.
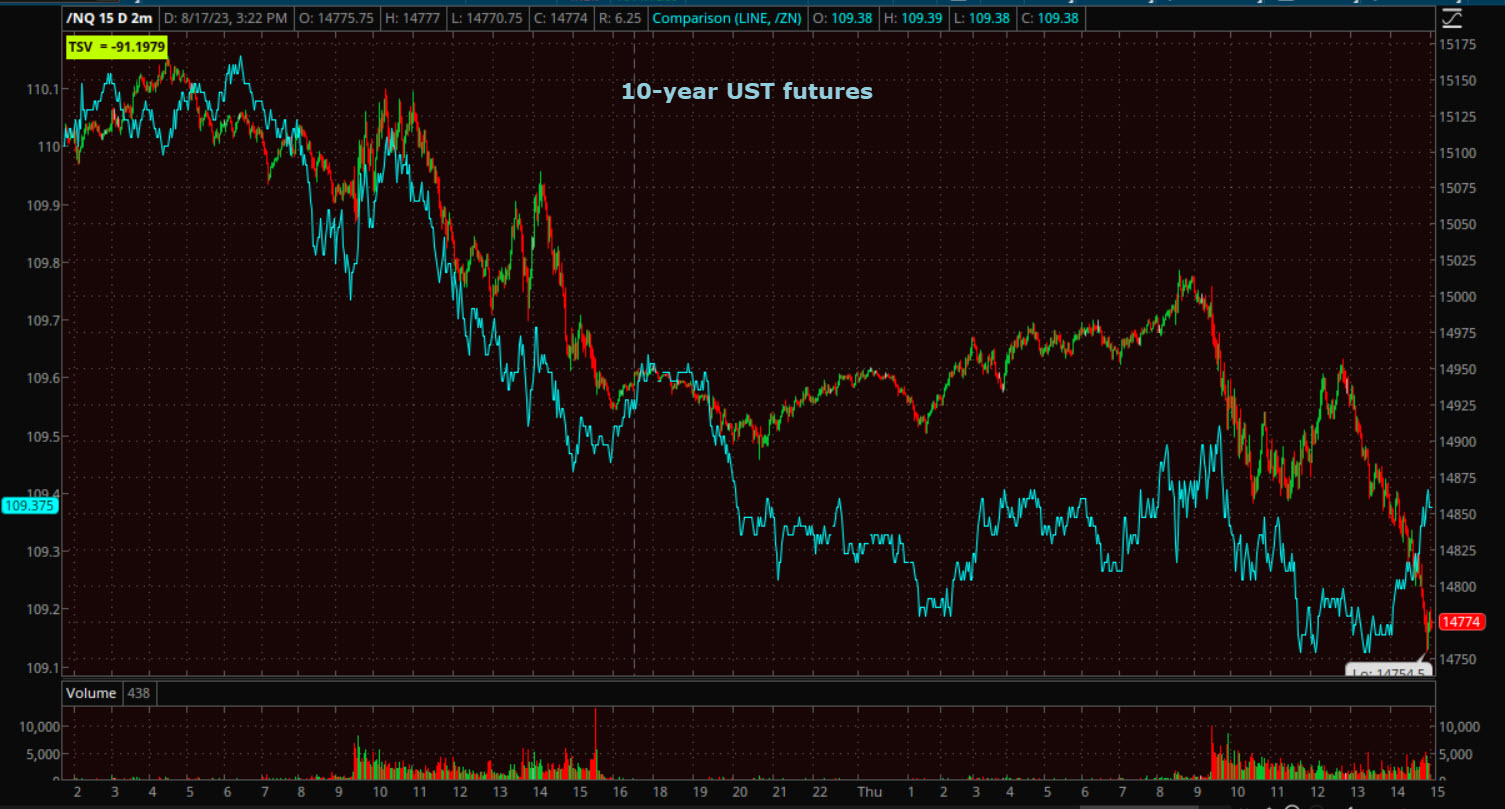
This is why this afternoon I mentioned that there’s a small divergence starting between Treasuries and Stocks in this post and with this chart. However, I also did note,
“The one thing that “may” be changing is yields – they are off session highs, but still have hit new cycle highs….
if you look to the far right, Treasury futures are rising a bit, meaning yields are coming off their highs. I’m not sure that this little bit is enough, but it’s something to watch.”
And followed up in the Afternoon Update with this,
“In the last post I mentioned that yields are coming off their highs (Treasuries off their lows) so that may help the market in terms of this big spike in yields potentially ending. It’s not enough of a move to call it a trend change yet, but it’s worth knowing about and keeping an eye on.
In one of my video updates 2 or 3 weeks ago, I showed why the local area of S&P $4500 and $4600 were so important in my view. You have to look back to the 2021 all time highs and a top formation and what happened shortly after in 2022.”
In other words, for the market to bounce/rally from here we need a few things. We need to see evidence that the price trend that has been solidly down for 3 weeks in the S&P, and 5 weeks in the NASDAQ-100, is showing signs of changing. I need to see improvement in 3C charts, but I think what we really need is for Treasury yields to come down, and a decent leg down, not just a day or two.
Price action remains bearish as you can see on the intraday charts of the averages above, and 3C charts remain bearish since the small positive divergences from technical traders buying at the SPX’s 50-day have been easily overwhelmed by sellers.
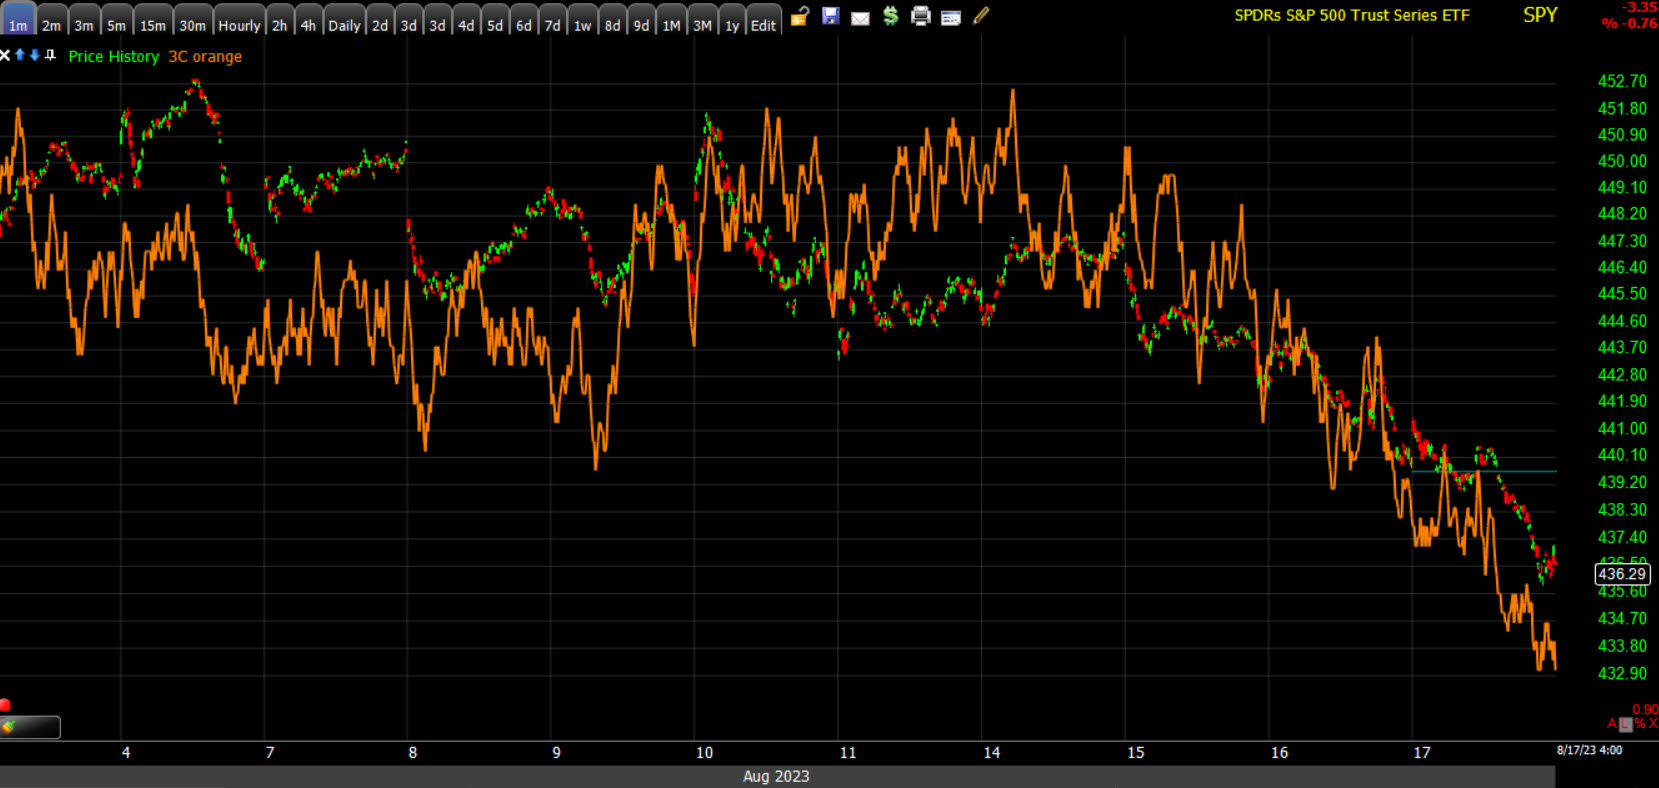 SPY (1m) and 3C
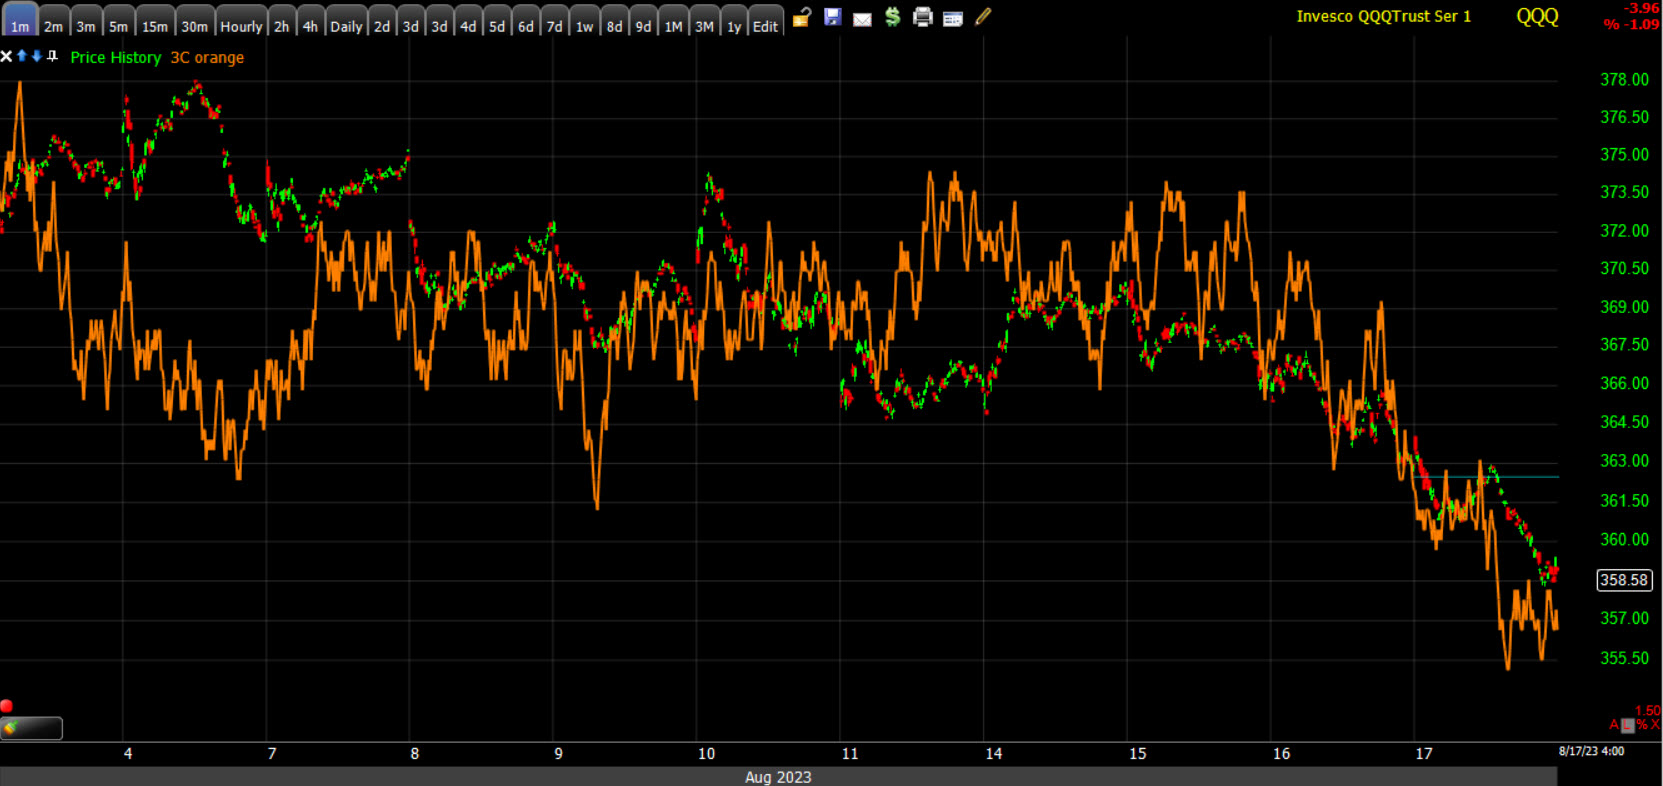 QQQ (1m) and 3C
In both cases, 3C is confirming to the downside and even still leading price to the downside.
Onto the bigger picture…
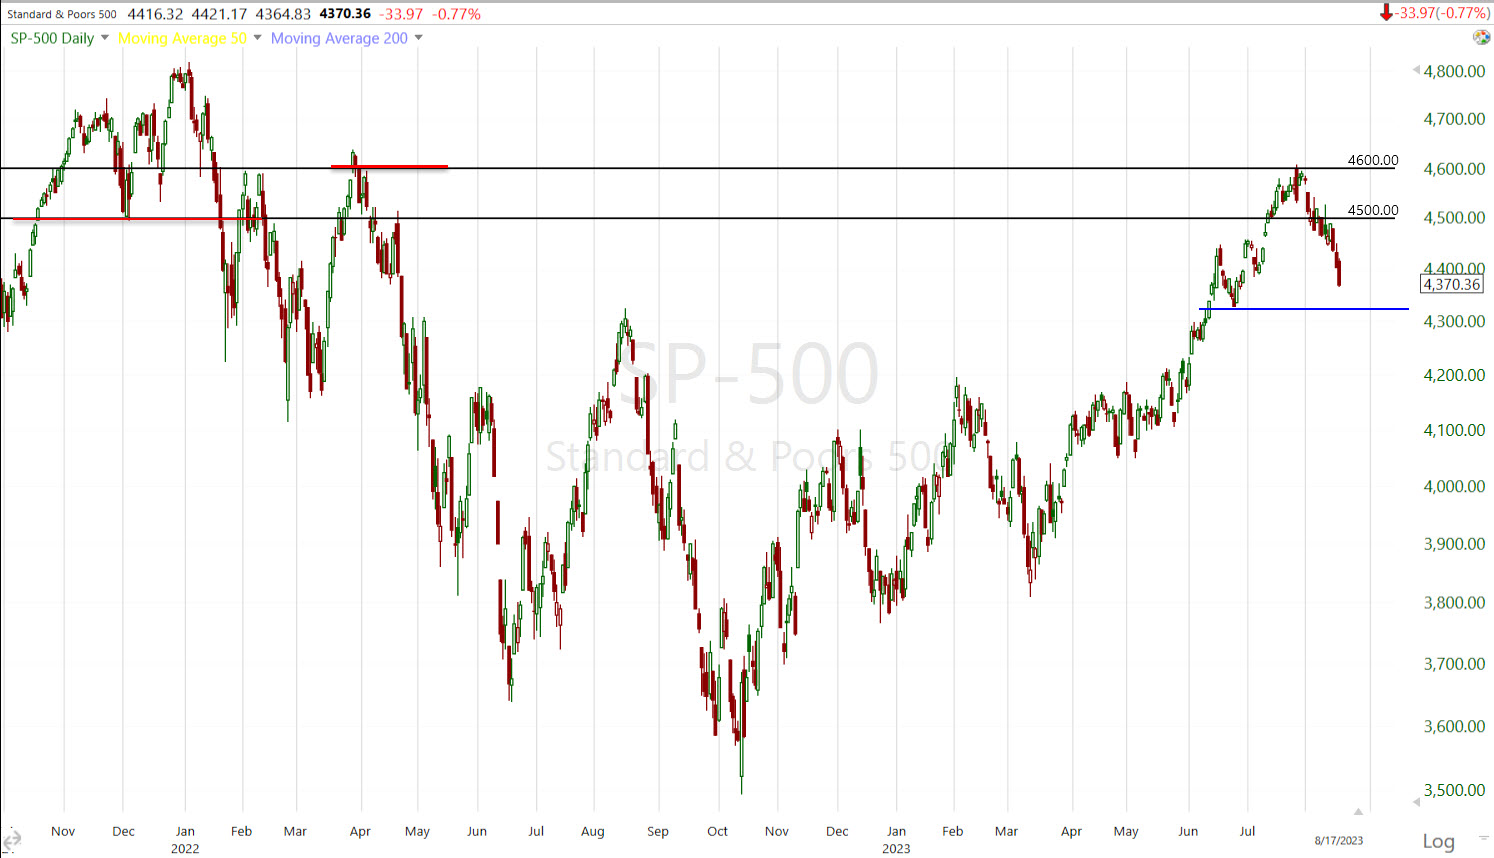 SP-500 (daily) – the case I was making in the video was that $4600 could very well be a failure for price in this rally from October 2022. The reason why is the resistance from the rally’s top in March of 2022 (same month Fed began rate hikes). And $4500 was important because it was the neckline of the topping formation at all time record highs in late 2021. These levels are important from a technical perspective, but more importantly, they’re important because nothing makes traders and investors more bullish than rising prices and new highs, they buy them and a decent chunk of them that bought near record highs, and then saw prices fall into a bear market, tell themselves, “If price will just get back clos to the area where I bought, I’ll sell at breakeven or for a smaller loss. You have to remember, at the time they bought, the financial media were plugging the new record highs every day. Then they saw their position at a loss shortly after. They prayed that it was “just a correction” and price would rebound, so they held, price moved lower and at that point they couldn’t take the loss. Traders/investors will do more to avoid a loss than to take a gain. They then went through a “bear market”, not having any idea if price would ever recover. That’s psychologically damaging. This is why those levels are so important. There are a lot of investors that have been waiting for a year and a half just to get the chance to exit at breakeven or a smaller loss. This is what creates overhead supply or resistance and why these levels were so important in my view.
Remember that the S&P’s Key Reversal Day, that has seen nothing but the market trend lower since, was right there at $4600 with price trading briefly above it in the morning, and then closing below it the same day.
The broader point though, rather than se the Tech sector, we can use S&P as an example of what could end up being a large toppy H&S price pattern. If price continues to decline toward the blue trend line, and it doesn’t have to do it in one continuous decline, there could be small corrections between, we’d likely have an established neckline of a larger H&S top just needing a rally to a lower high to form the right shoulder. I’ve already checked the volume pattern, which is imperative in confirming a H&S top from just a random price pattern and it is correct. The size of that hypothetical H&S would be very appropriate for the length and extent of the rally off October lows. And that’s only 1% lower for the S&P.
Going back to the Tech sector I have been using as an example of a hypothetical top (of which more than half is already on the chart),
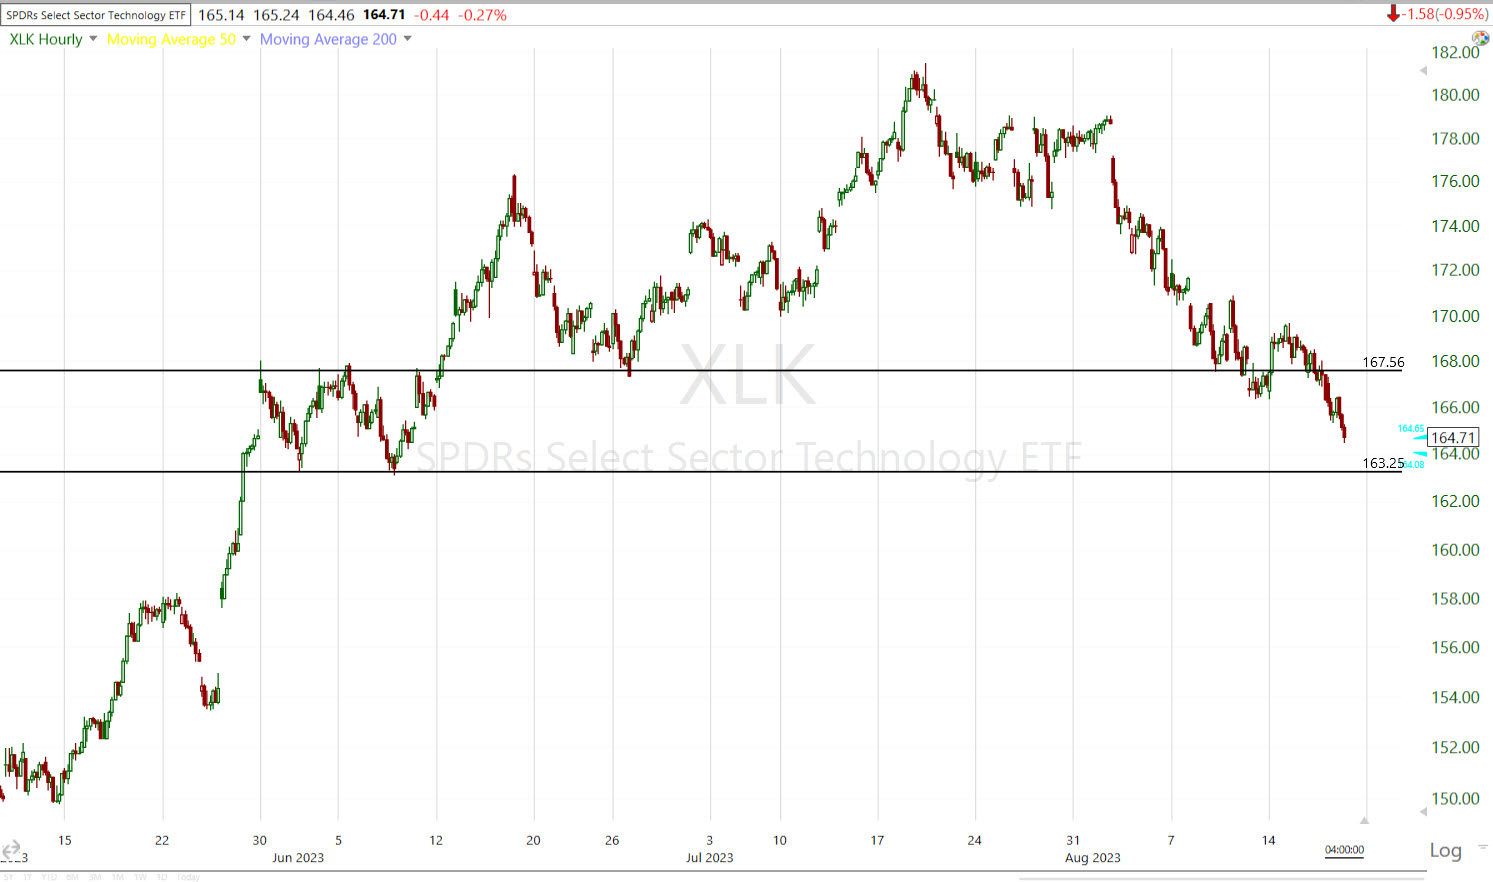 The sector closed below the shallower potential top and is heading to the deeper potential top. I did move the trend line down from $164 to the more appropriate $163.25 area based on where price has the most contact points for a valid trend line that is the neckline of the top. And, the sector has less than -1% to go to reach that level! Interesting, since I’ve favored the lower trend line in the Tech sector examples as it means a larger top, more appropriate for the size of the preceding rally.
Tomorrow we have options expiration and then next week we hear from Jay Powell at the Jackson Hole Symposium.
Overnight
S&P futures are unchanged tonight, but we have two different and contrasting charts of interest. First, the same as the cash session, 3C is in line to the downside and even leading slightly lower.
 S&P futures (1m) and 3C.
However, as I noted this afternoon in this post, Treasuries were starting to positively diverge (yields lower) from stocks and that’s continued since the cash close. Remember the reason why stocks have been selling off – higher yields.
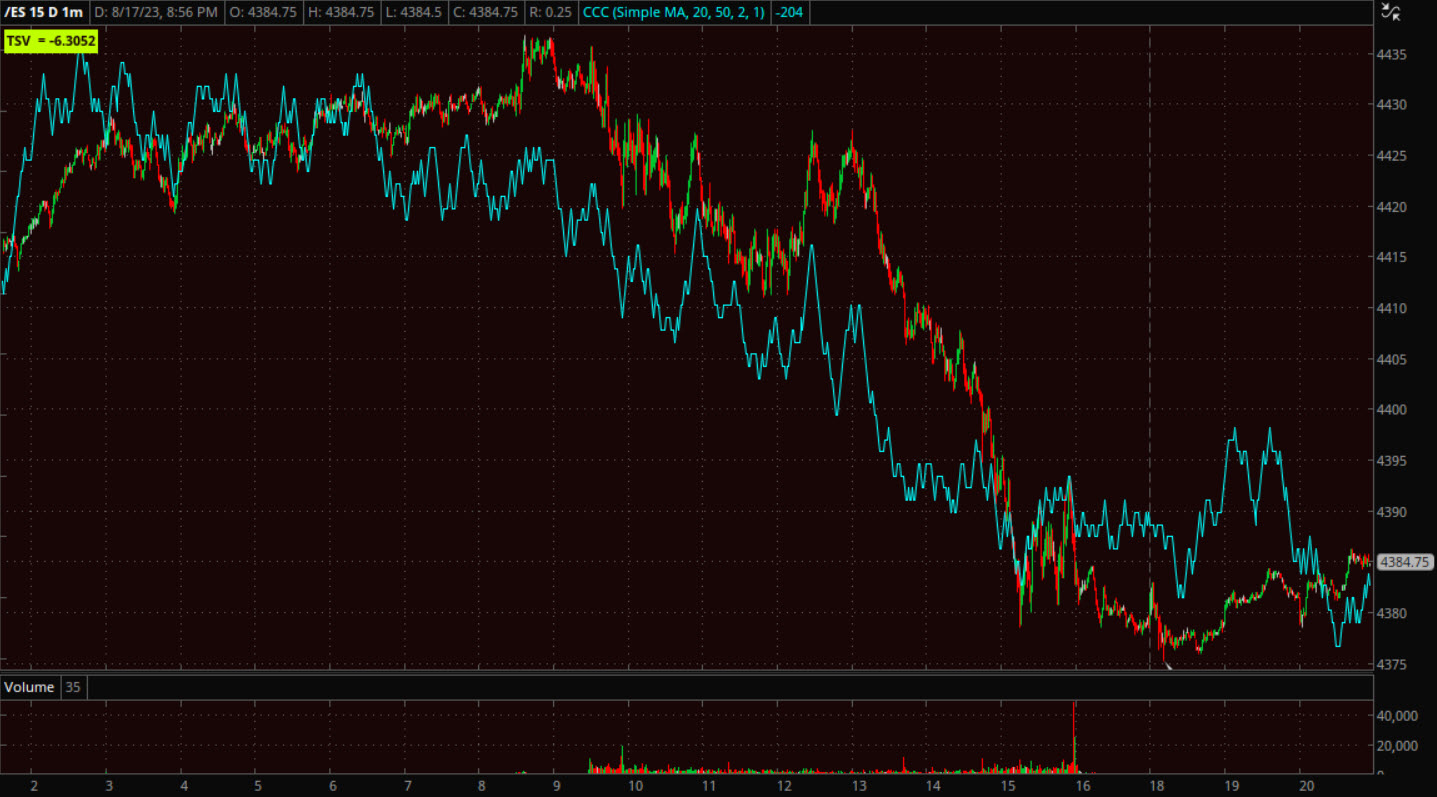
 Here’s S&P futures (1m) and 10-year Treasury futures in blue. That’s interesting. It’s still not a trend change, but it’s a notable divergence on any intraday chart.
VIX futures are under some pressure on 3C charts so that tends to fit with the rates divergence above.
The U.S. Dollar Index is down -0.27% and that’s typically a tailwind for stocks.
WTI Crude futures are down -0.1%.
Gold futures are already reacting to the lower dollar and lower yields and are up+0.4% tonight. Remember that Gold and stocks have had nearly the identical same negative correlation to the Dollar and yields since March 2022 when the Fed started hiking rates, so gold is acting favorably already.
Bitcoin futures are down -4% to $26,720.
The 2 and 10-year yields are both down around -4 basis points each.
There is no U.S. economic data of note on Friday.