Sunday Brief
I hope everyone had a great and safe Memorial Day weekend. There wasn’t really much to add this weekend. The S&P ended the week almost exactly where it was last Monday morning at the EU close.
Local beaches were opened for Memorial Day in my part of the country so I went to the beach to go for a walk and get some sun. There were rules posted, the gist was you could walk the beach, jog or swim, but not put down towels and sunbath. No one followed any of the rules, it looked like a cross between a normal busy summer day and Memorial Day weekend. The restaurants and bars open on the avenue looked to be at about 75% capacity, but outside there were lines of people standing shoulder to shoulder for 100 yards. In other words, no social distancing and I’d say maybe 5% of people wore face coverings. You’ve probably seen similar scenes from around the country this weekend. I suspect that we’re about to find out just how effective lock-downs and social distancing are r were over the next few weeks.
Futures are open in thin trade with both the U.S. and the U.K. closed today. With S&P futures up 36 handles as of this moment, the following stats illustrate the cash session snooze over the last week-
ES Regular Session -18.75
ES Overnight Session +149.5
Or visualized another way…
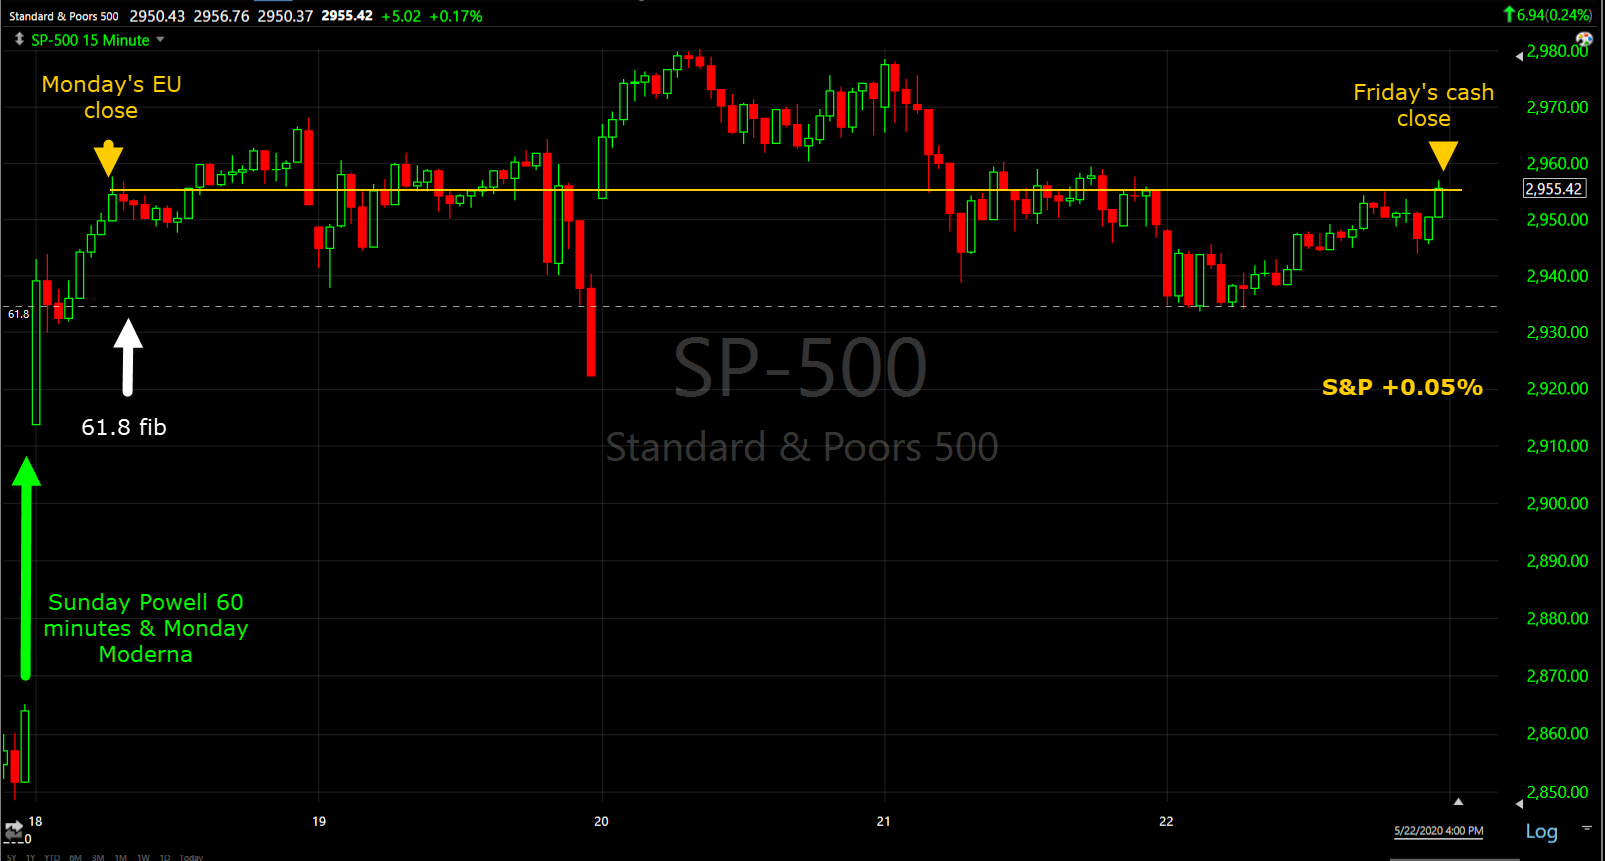 SP-500 (15m last week) all of the week’s gains came from the time the market opened Sunday night (up about 1% after Powell’s CBS 60 Minutes interview) to the first 2 hours of the cash session after gaining another 2.5% in pre-market following news about Moderna’s vaccine trial.
From the European close on Monday to the close on Friday the S&P is almost unchanged (+0.05%). The week was Deja-vu because the last time the S&P was in the area (61.8 fib retracement area) price was driven by another vaccine headline, Gilead’s Remdesivir…
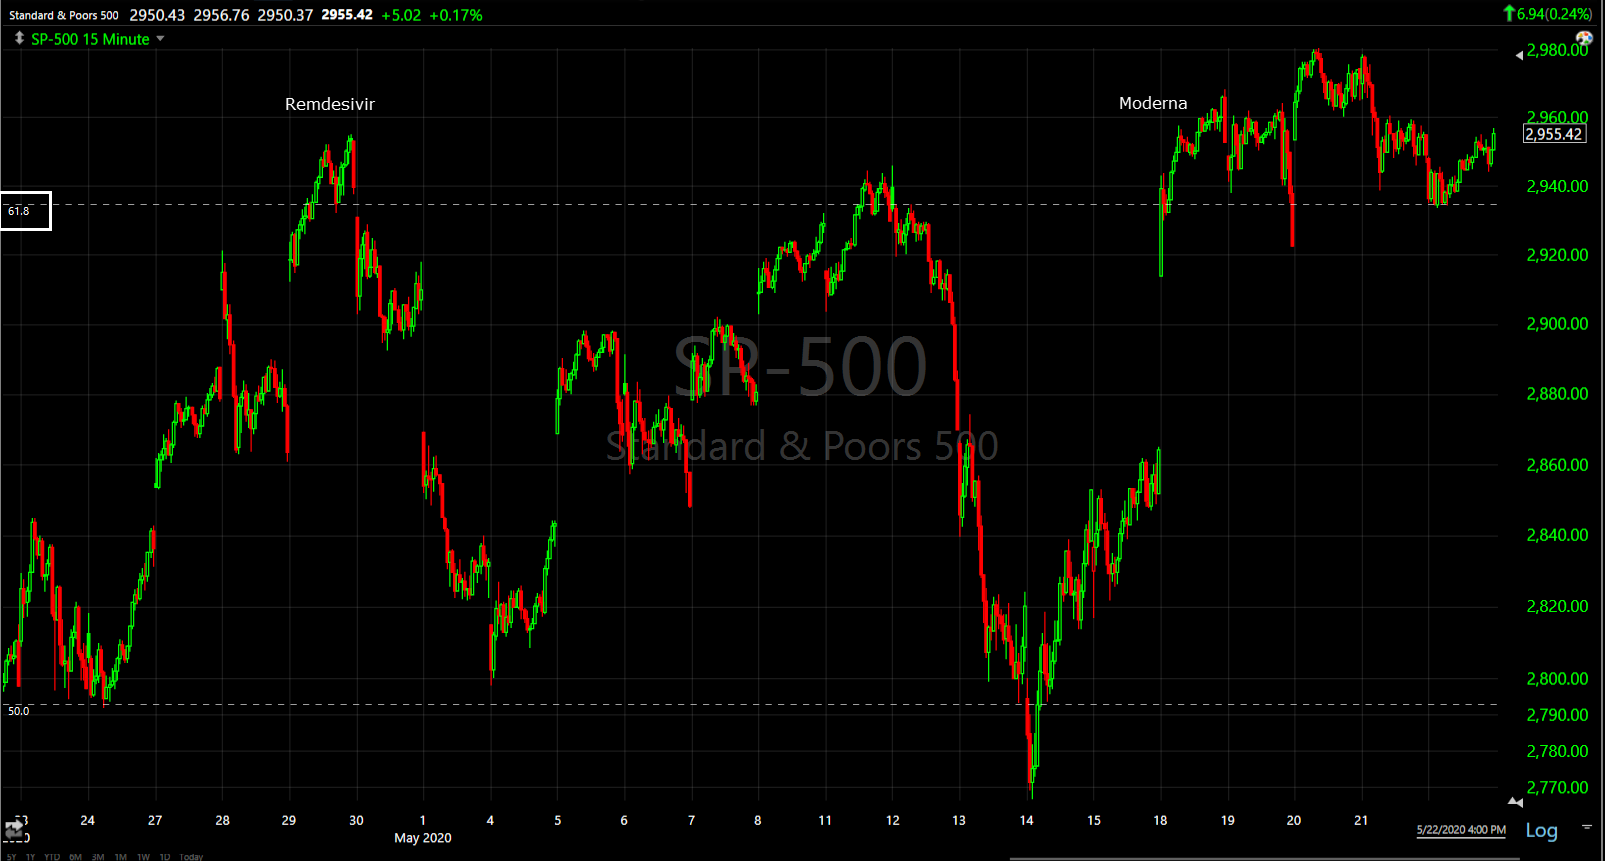
SP-500 (15m) 61.8 retacement of the 2020 crash (white). You might notice increasingly large swings with a broadening shape, more on that below.
As an aside, here’s the equal weighted S&P-500 Index that strips out the weighting of the mega-caps.
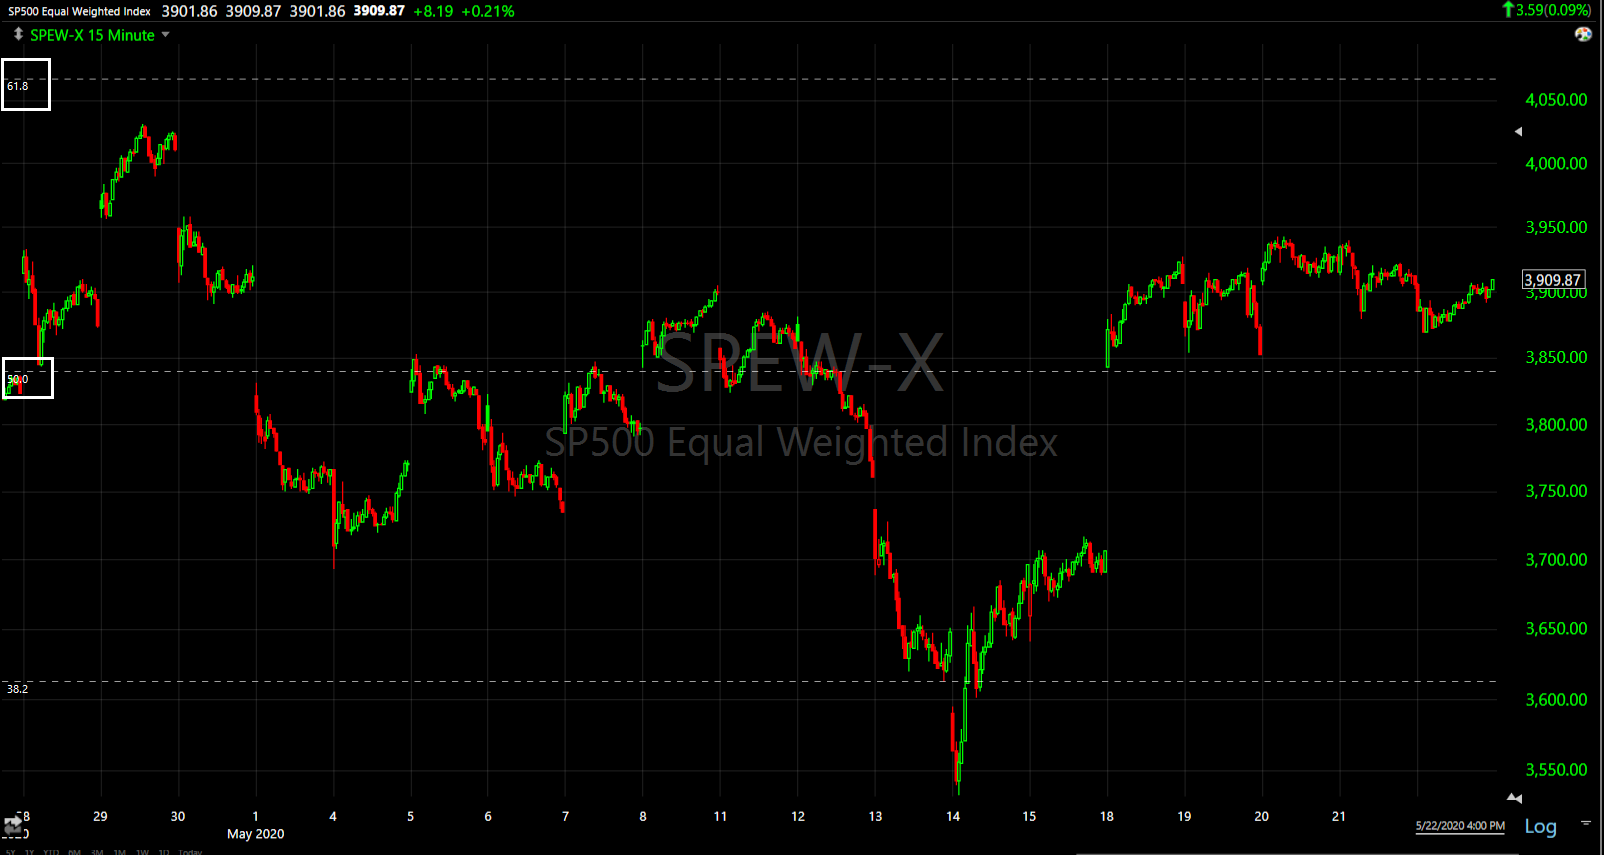
S&P Equal Weight (15m) notice its trading below both the April high and the 61.8 fib retracement, which mirrors the generally deteriorating market breadth.
Since the news driven market gains, both Gilead and Moderna gave back their headline gains…
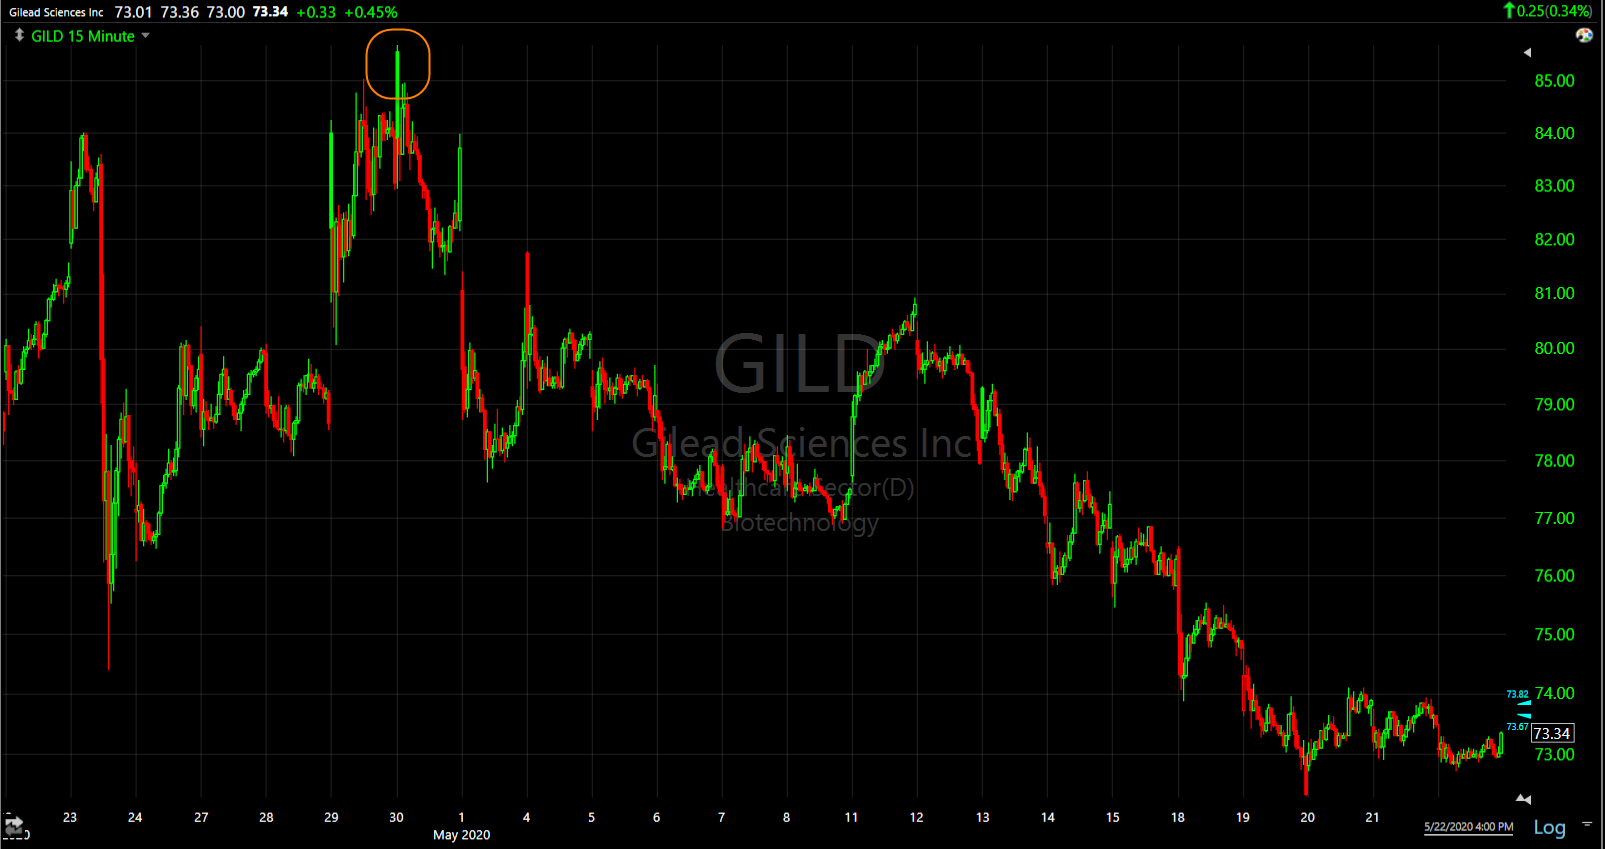 GILD (15m) -12.5% retracing all gains form the news and then some
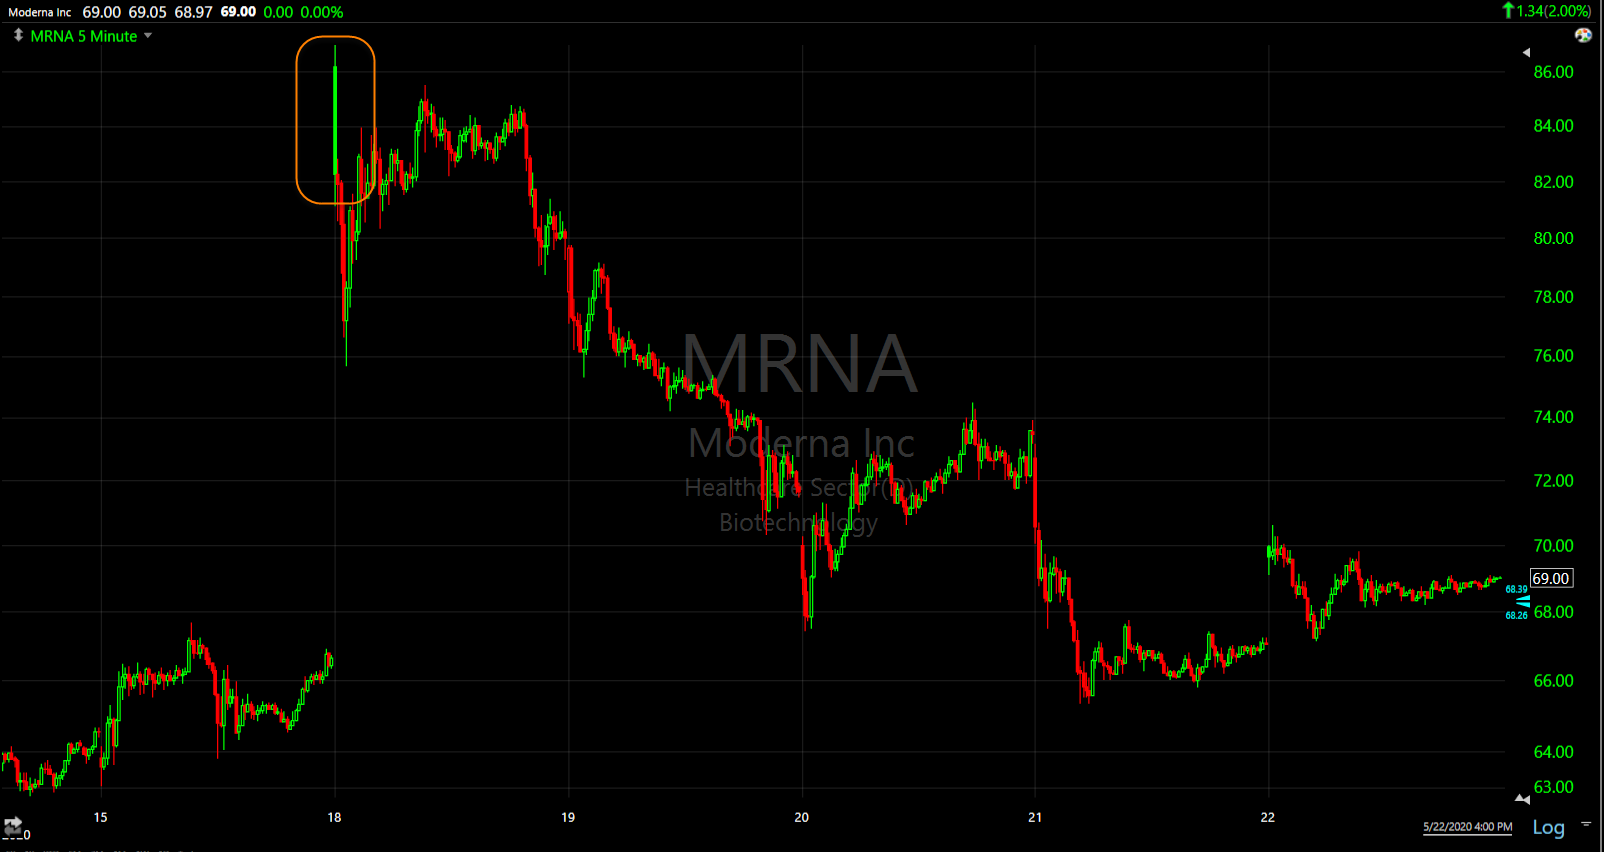
MRNA (5m) -13.75% from Monday’s close, retracing gains.
As we know a handful of mega-cap stocks have driven the broader market, especially the last month. Five heavily weighted mega-cap stocks (Facebook, Amazon, Apple, Alphabet and Microsoft) account for 20% of the S&P-500.
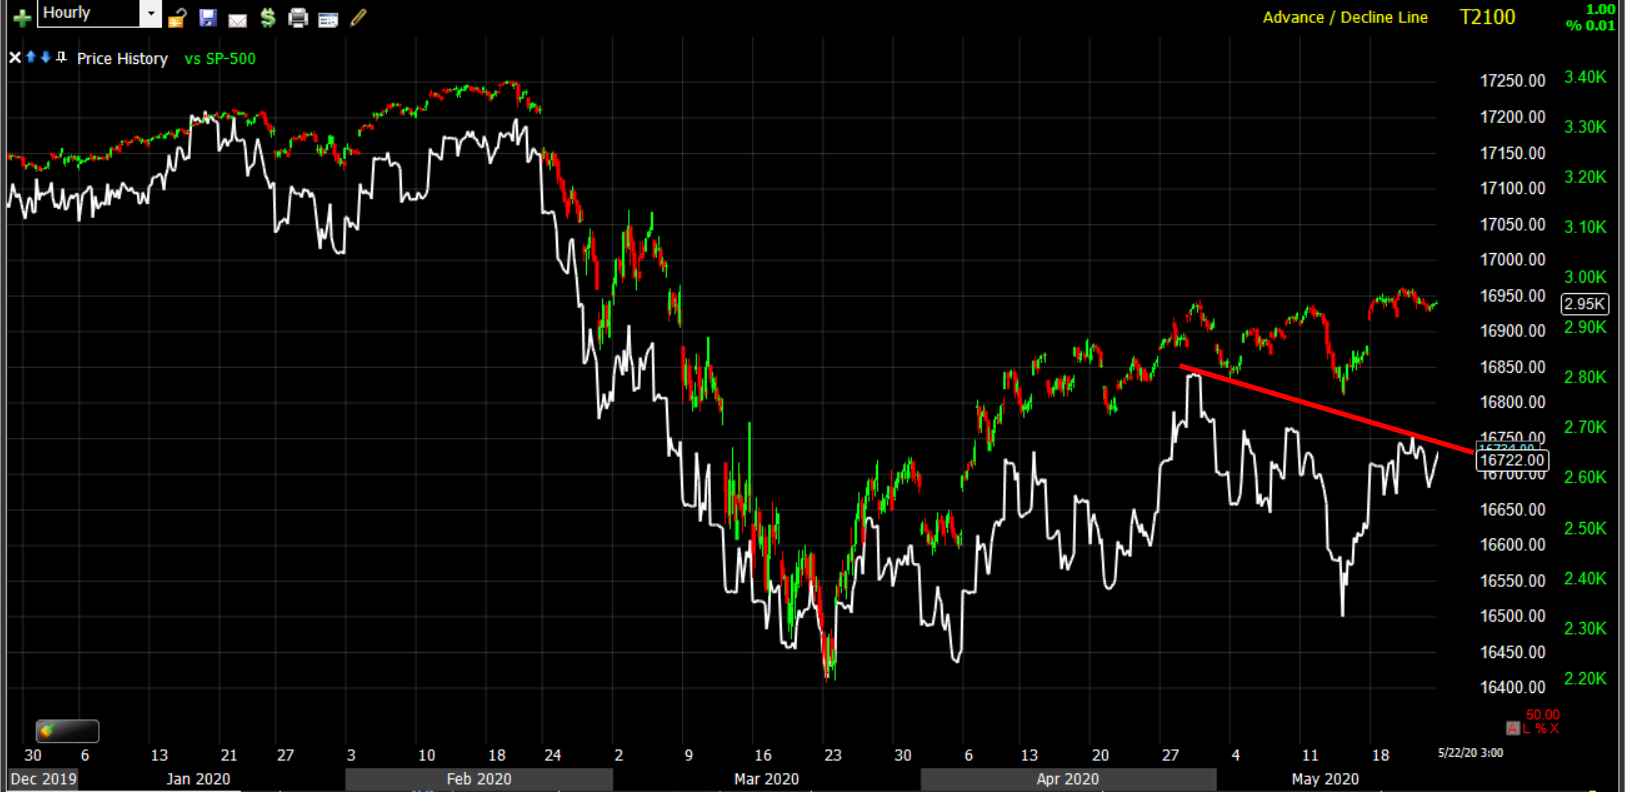 SP-500 (60m) and NYSE Advance-Decline line displays a divergence or deteriorating breadth/participation.
The concentration in a handful of stocks now exceeds that seen at the Dot.com bubble (20% vs. 18%). According to Goldman Sach’s Dave Kostin,
“For example, in addition to the Tech Bubble, breadth narrowed ahead of the recessions in 1990 and 2008 and the economic slowdowns of 2011 and 2016,” the team said. “Historically, sharply narrowing breadth has signaled below-average one month, 3 month, 6 month S&P 500 returns as well as larger than average prospective drawdowns.”
The breadth divergence is even more stark when compared to the NASDAQ 100.
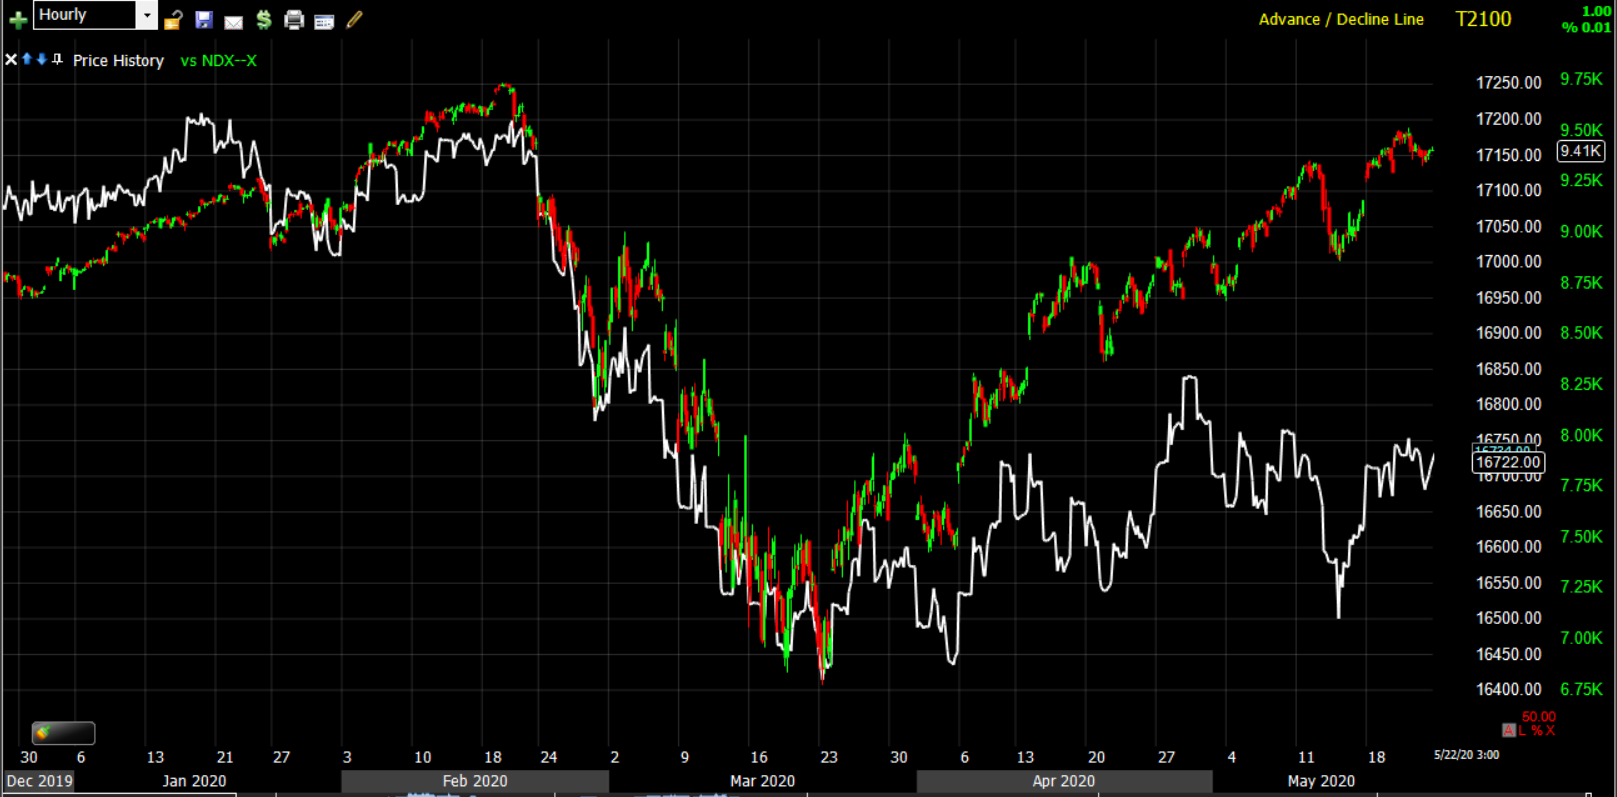 NASDAQ 100 (60m) and Advance-Decline
3C has its own divergence that mirrors that of deteriorating market breadth, as well as rallies above the S&P 2860 level.
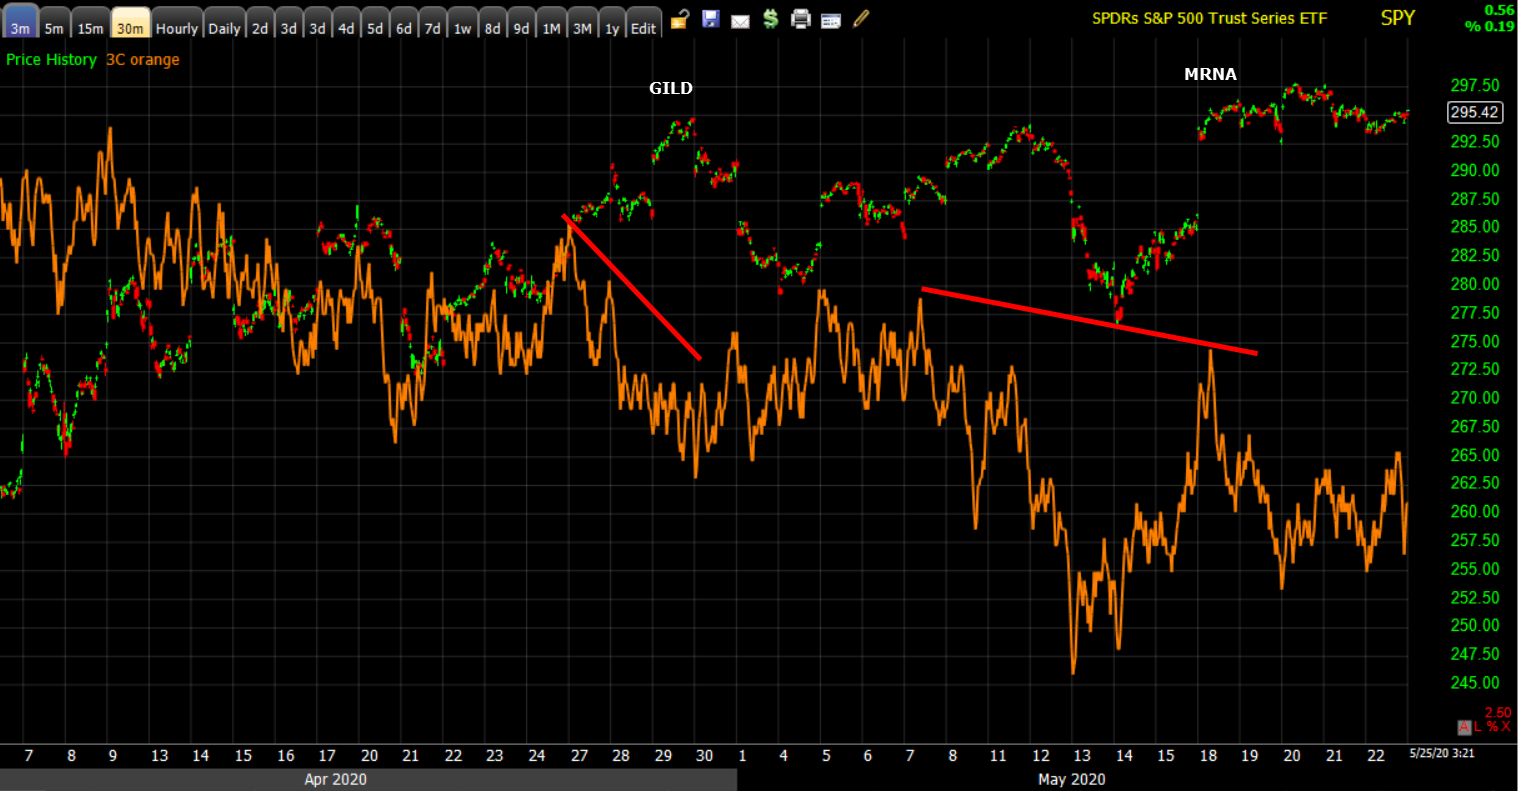
SP-500 (3m)
And recently even more notable since the NASDAQ 100 gained in a rising wedge 2 weeks ago.
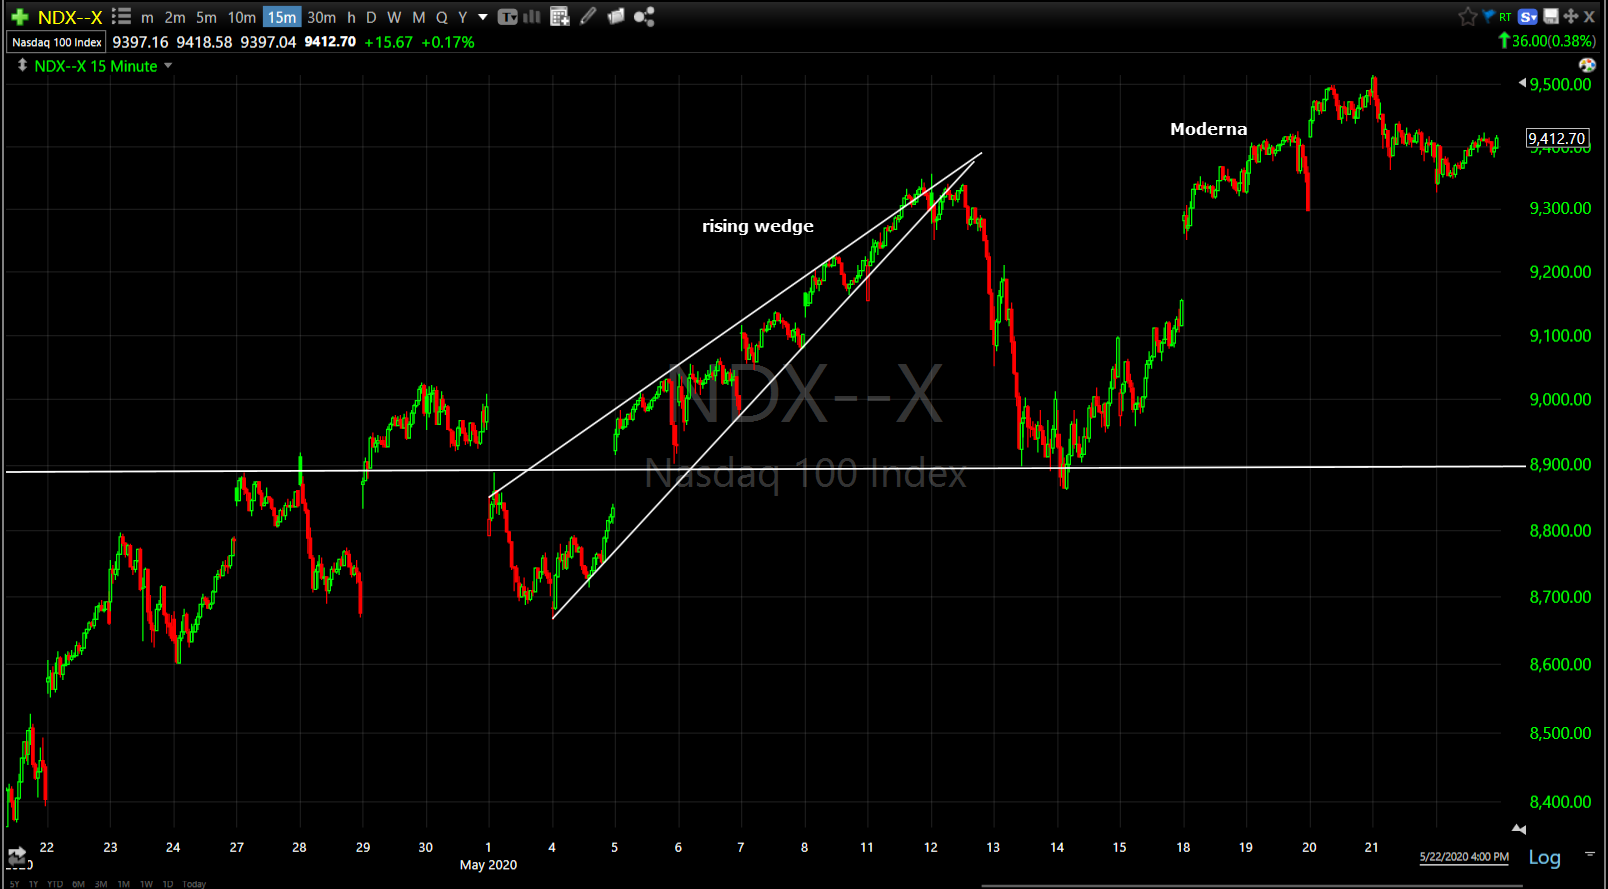 NASDAQ 100 (15m)
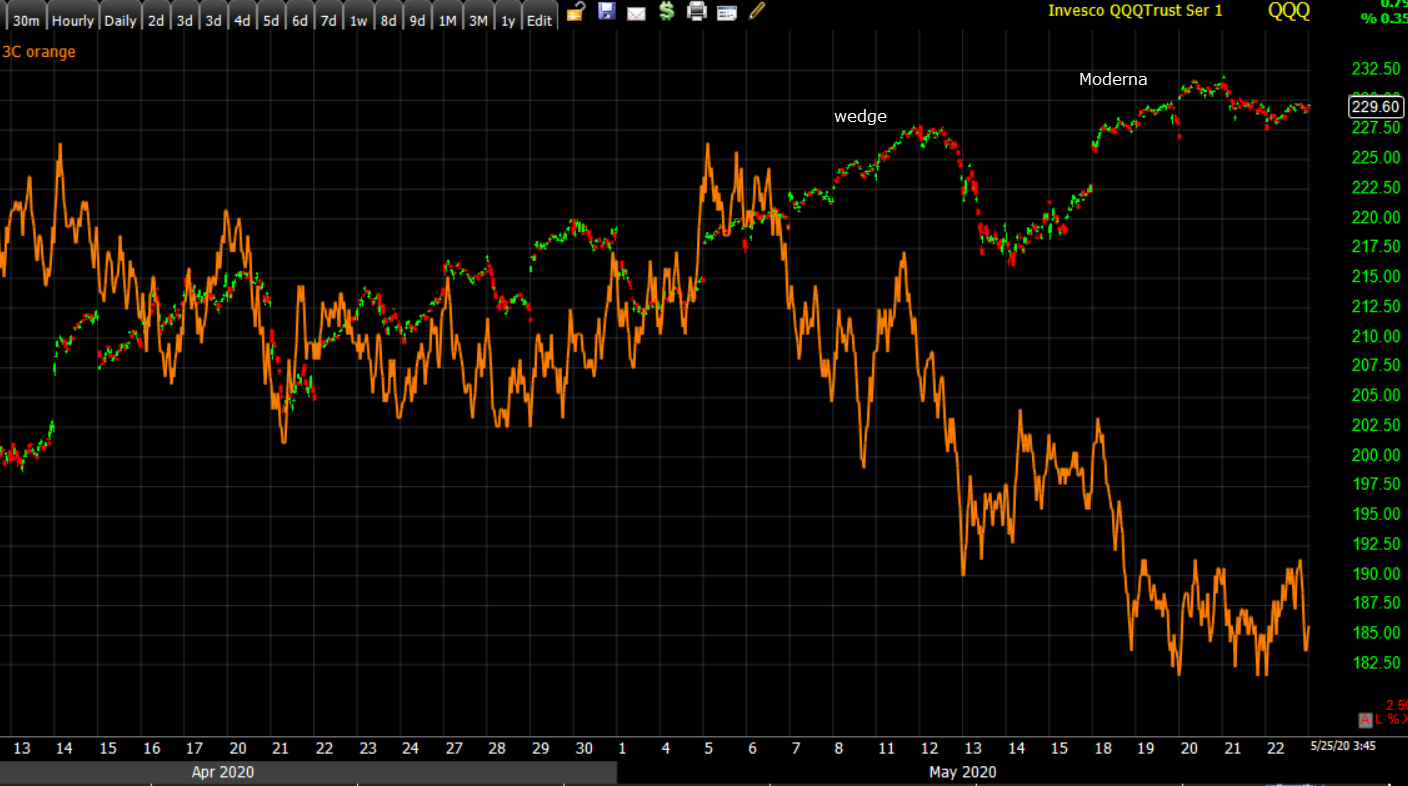
QQQ (3m)
Outside of the NASDAQ, the broader market has been trending in a more sideways range, now going on a 7th week.
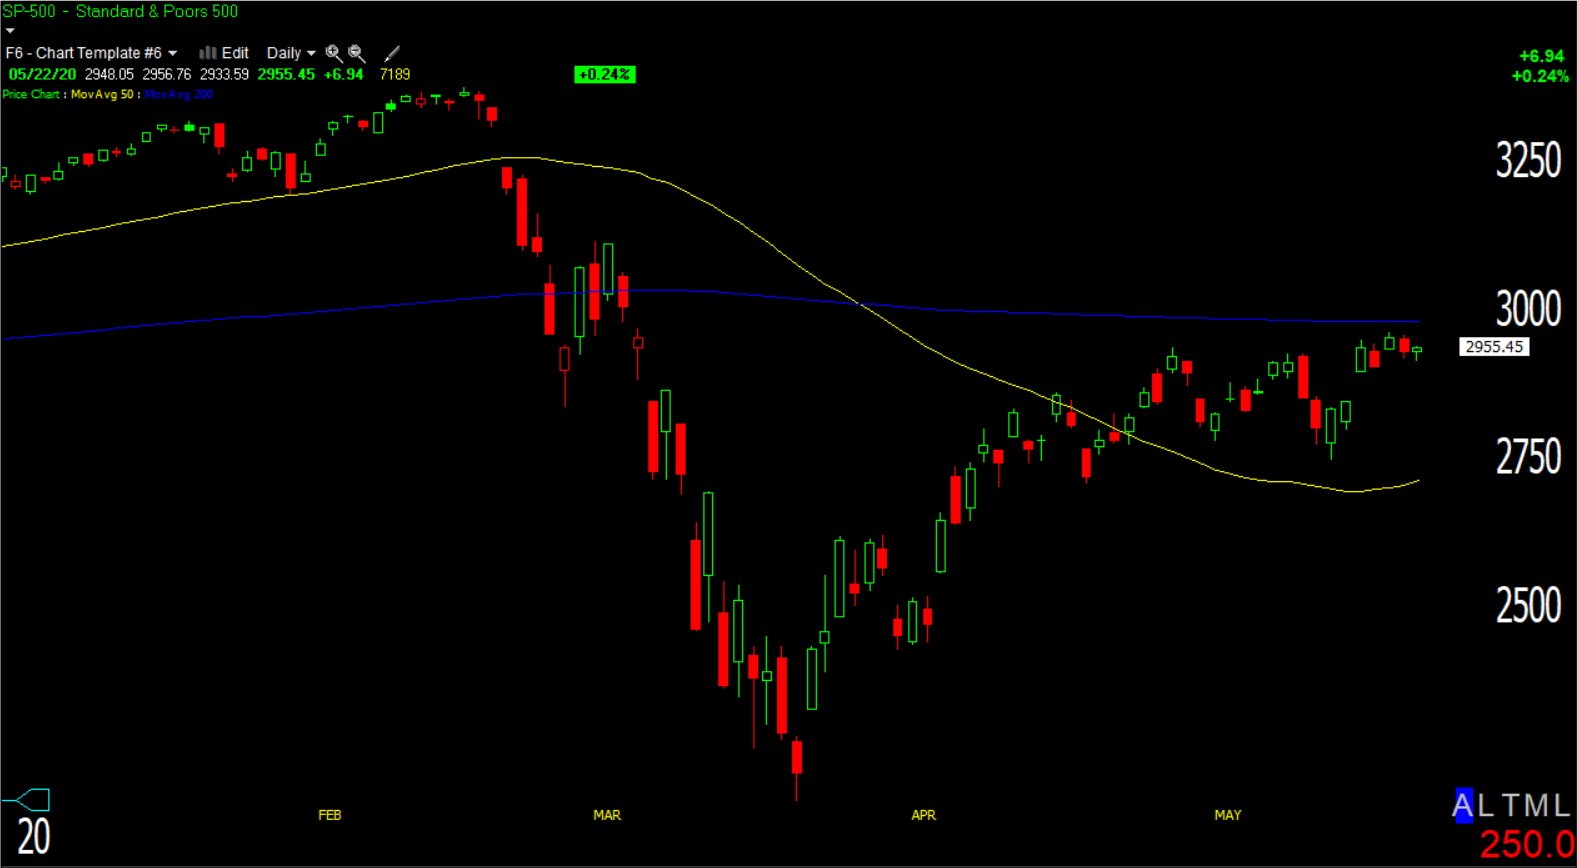
SP-500 (daily) the gappy lateral range is apparent on daily charts above the 50-day and below the 200-day. S&P is trading about 1.5% below its 200-day moving average. I thought this would have been tagged three weeks ago. From the looks of futures tonight, maybe we’ll see it happen early this week.
The Dow’s lateral range is displaying the hallmarks of an increasingly chaotic environment driven by less intelligent sponsorship and more by news or rumor (i.e.- Remdeisivir and Moderna).
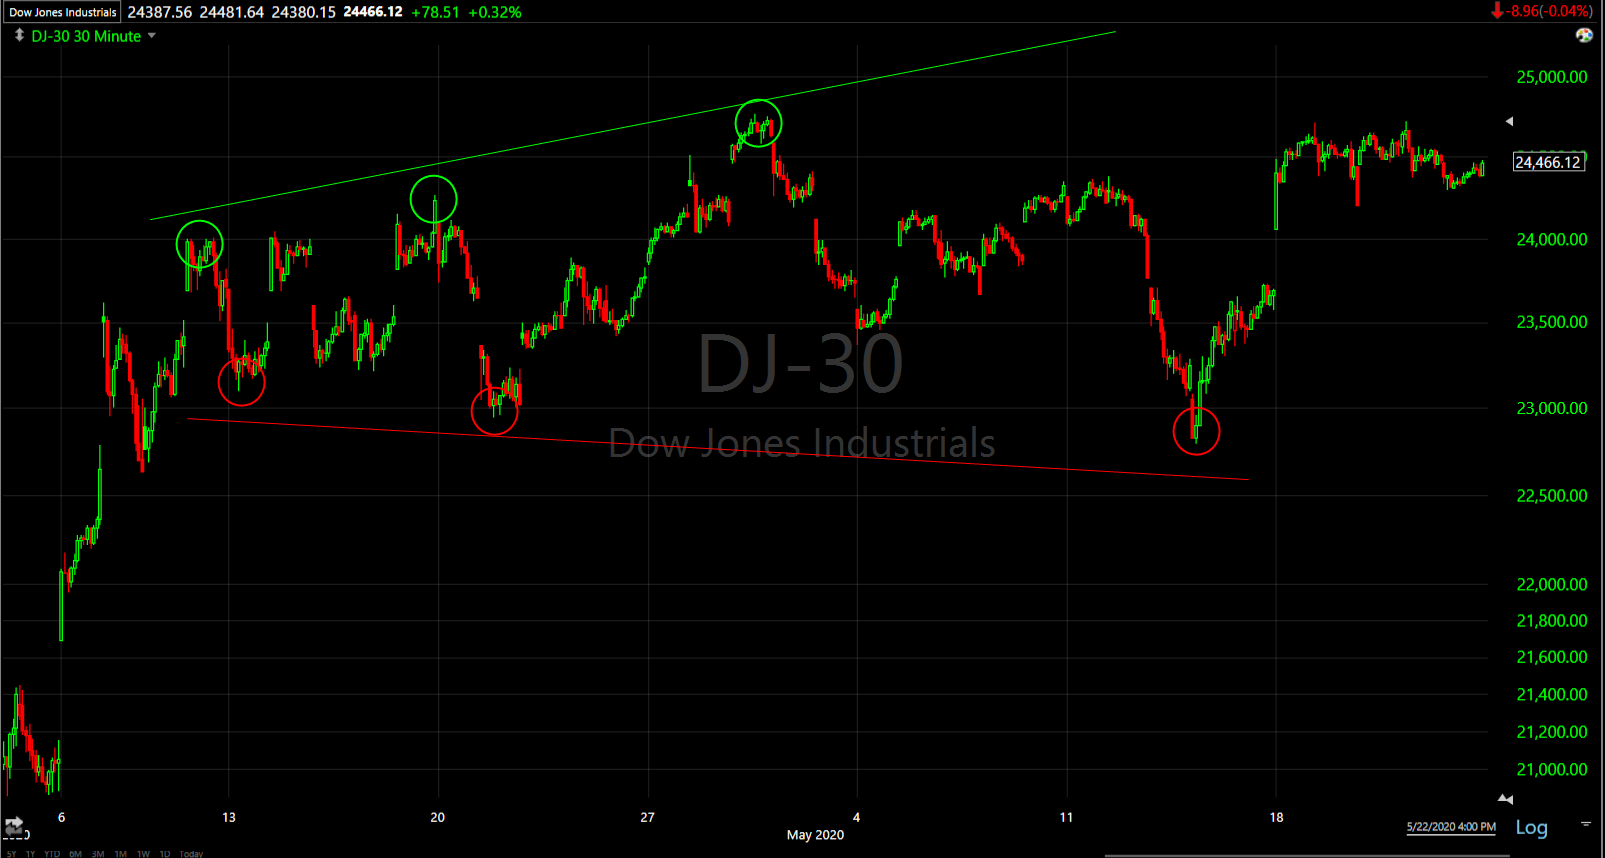 Dow Industrials (30m) trend of higher highs and lower lows or a Broadening formation, which isn’t surprising given the majority of price discovery to the upside in illiquid overnight hours, and very little in the cash market, and the deterioration in market breadth.
As for the rally itself, it is a head scratcher in many ways as unemployment explodes to the point that 28% of working Americans have filed for unemployment benefits. However, it’s not without precedent. A few weeks ago I showed prior bear market rallies that rallied to the 61.8 fib level, here’s another metric.
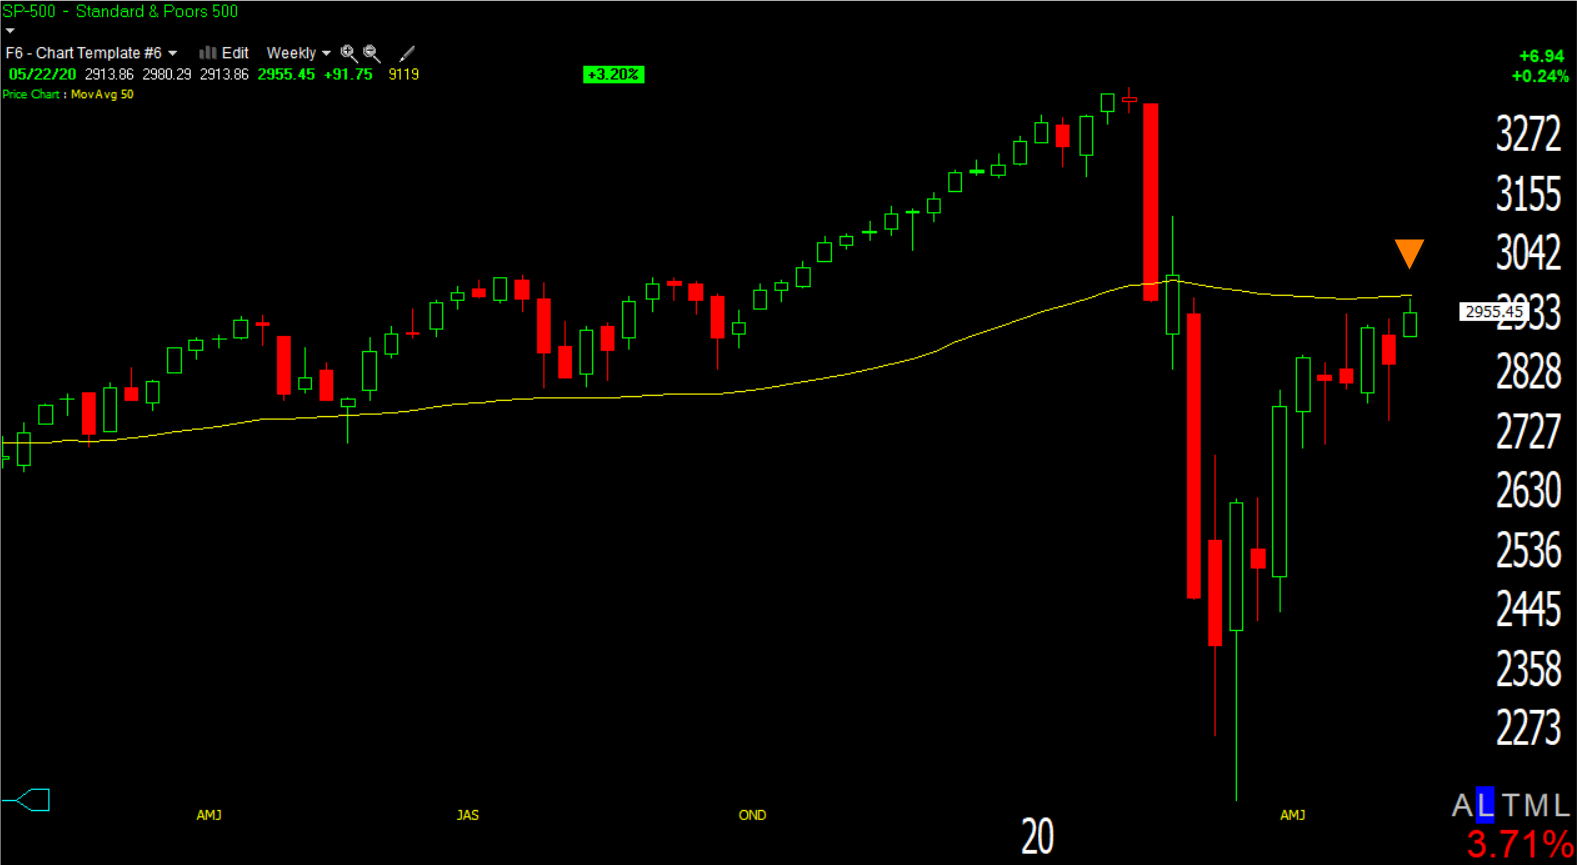 SP-500 (weekly) and its 50-week moving average
That’s the same place the S&P rallied to in its first counter-trend rally from the Financial Crisis.
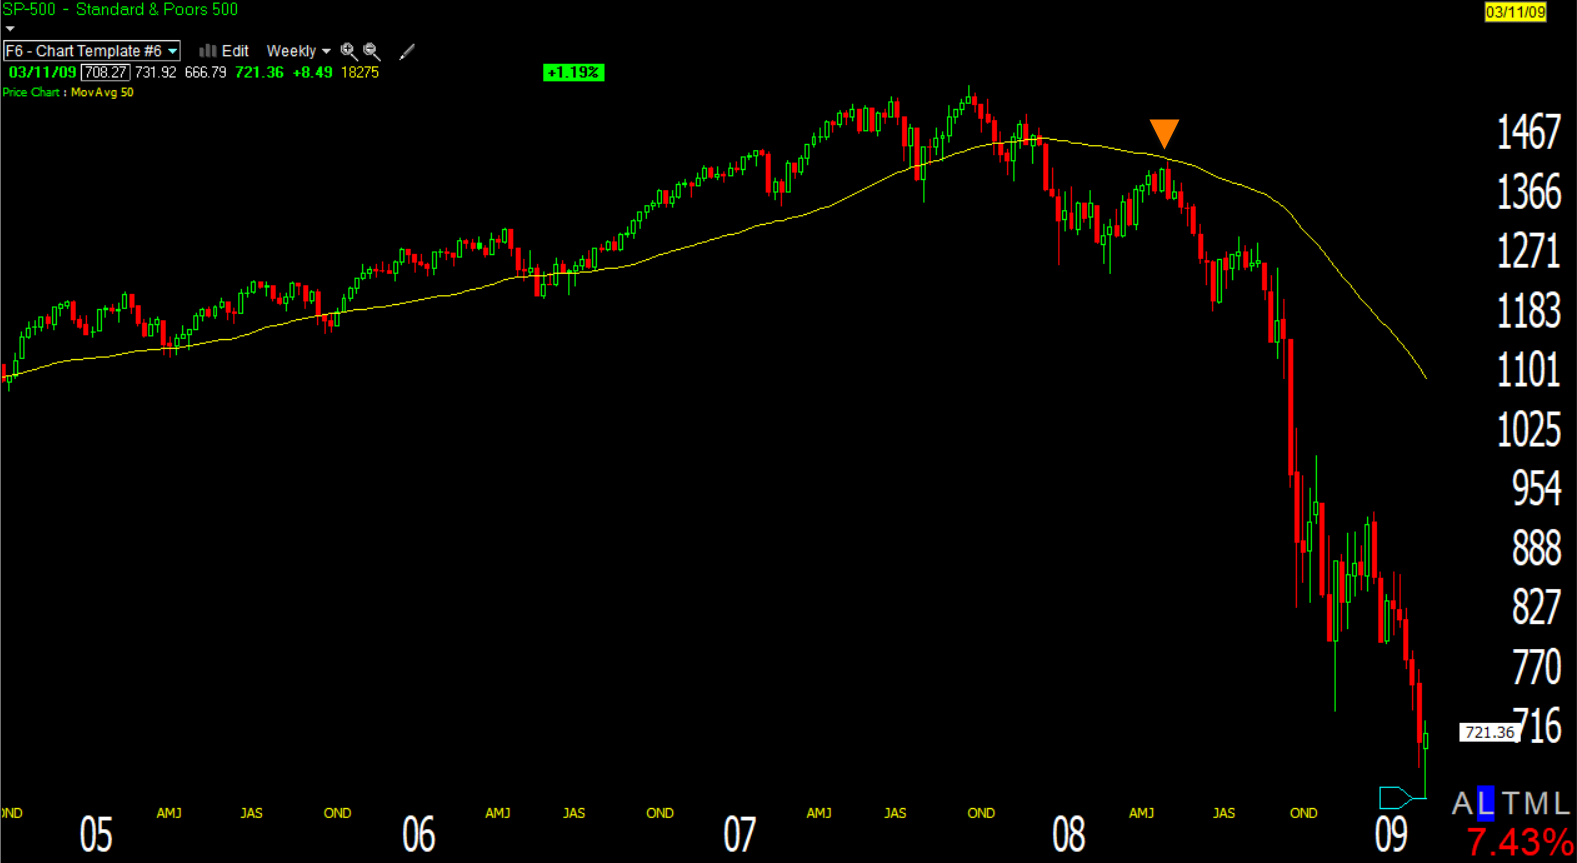 SP-500 (weekly from the Financial Crisis)
And the Dot-com bubble decline…
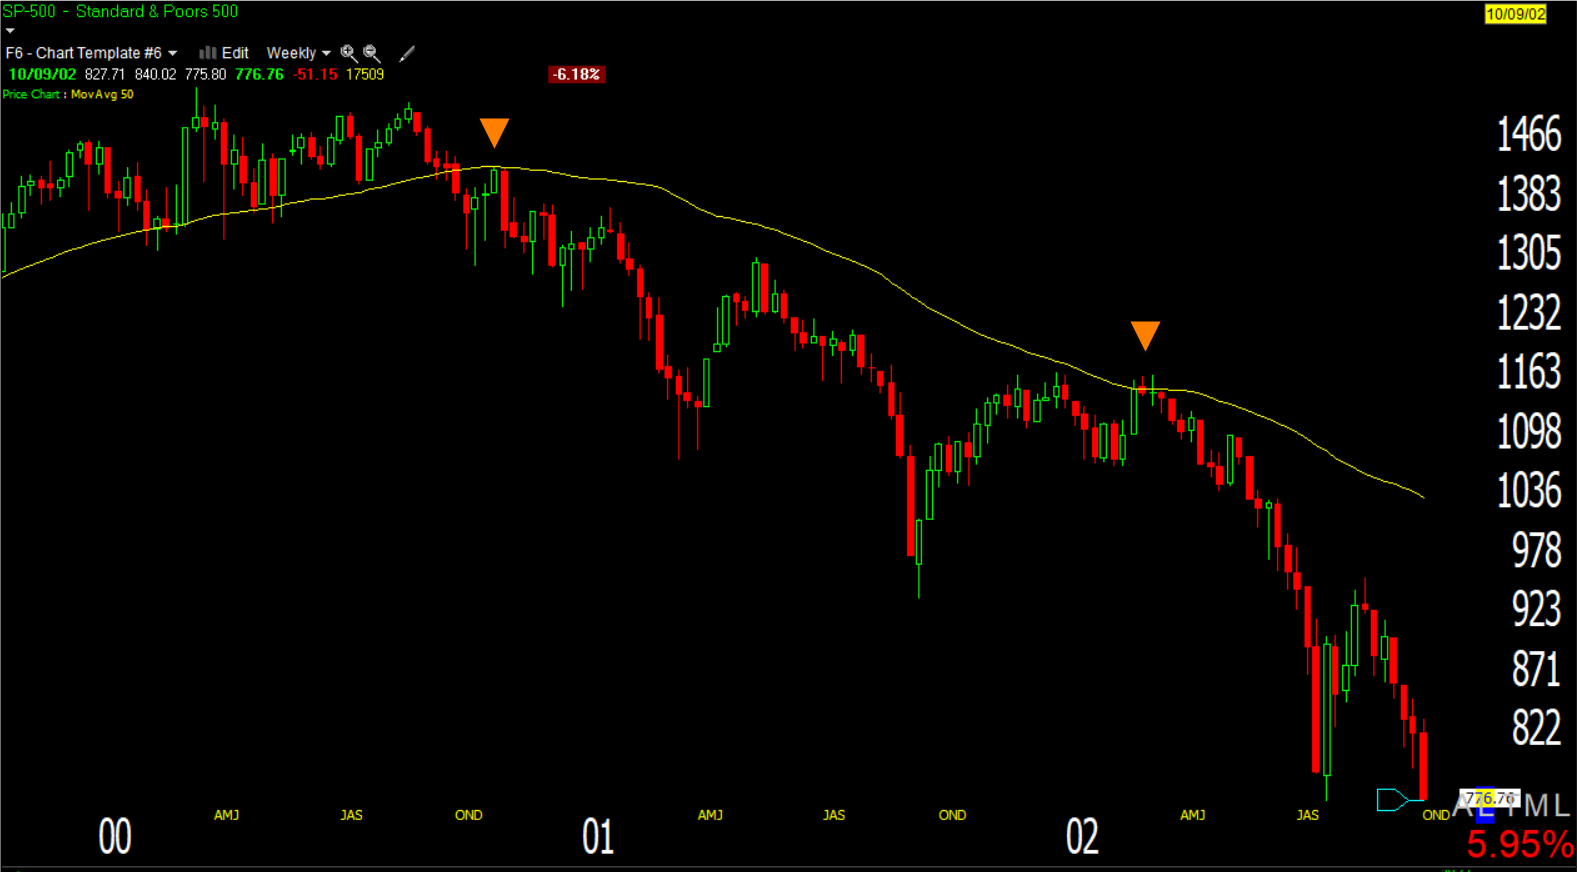 SP-500 (weekly Dot-com bubble) as it did in 2001
This next one may surprise you…
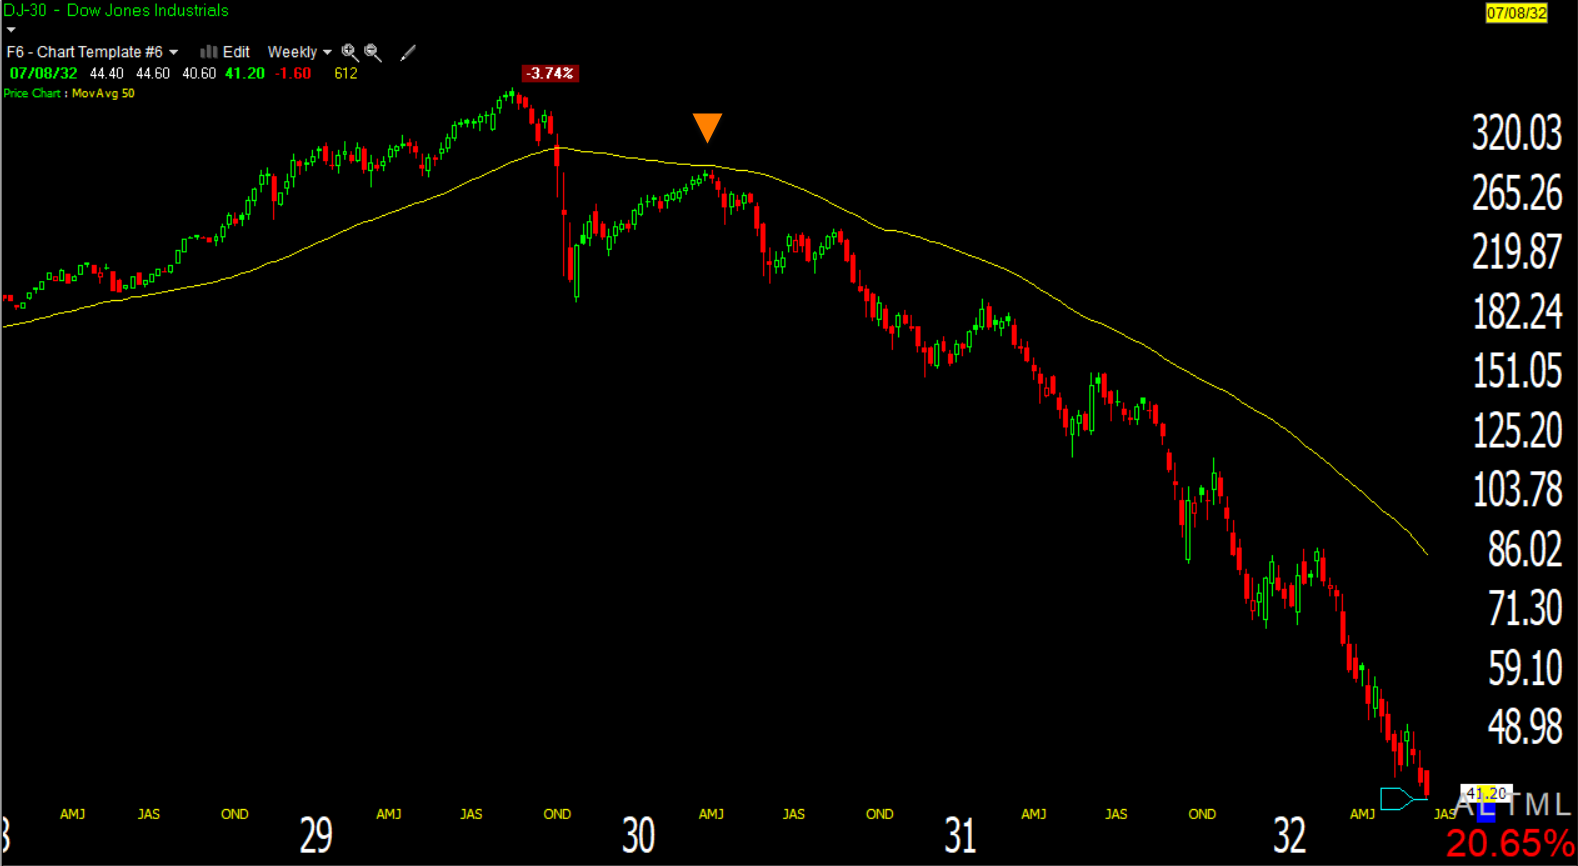 Dow (weekly 1929-1932) after the 1929 crash the first counter-trend rally lasted over 5 months and gained around 50%, right around its 50-week moving average.
This market is much different than 2008, 2000 and 1929, but it also shares surprising similarities. I can imagine people protesting, “But the Fed!”. While many things change, some not so much.
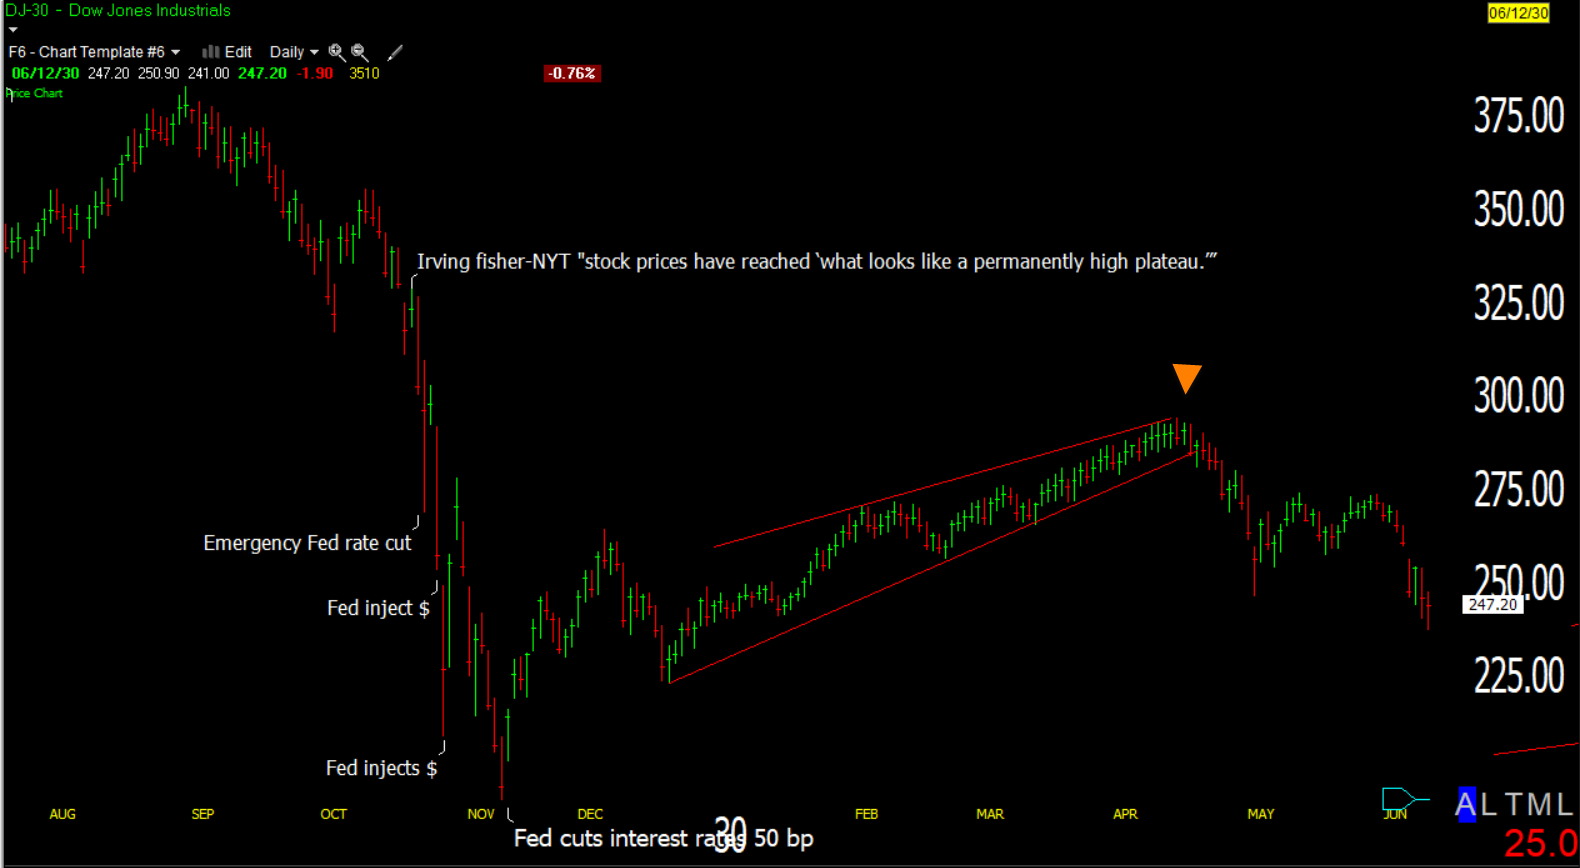
Dow 1929-1930 (daily) Not long after Irving Fisher proclaimed that stocks had reached a permanently high plateau (the new paradigm), the market crashed. The Fed reacted in much the same way, it slashed interest rates and pumped money into the financial system. In present day terms the two dates marked were around $1 trillion USD ($50 mln), and the next day another $1.3 trillion ($65 mln). The counter-trend rally finally kicked off after a 50-bp rate cut, and ended (orange arrow) near the 50-week moving average.
Again that’s not to say that this time is the same, it’s just to say that some things are not as different as some might imagine.
The most obvious risk being reflected by the currency markets, but not stocks, is the rising tensions between the U.S. and China, which will likely be center stage this week.
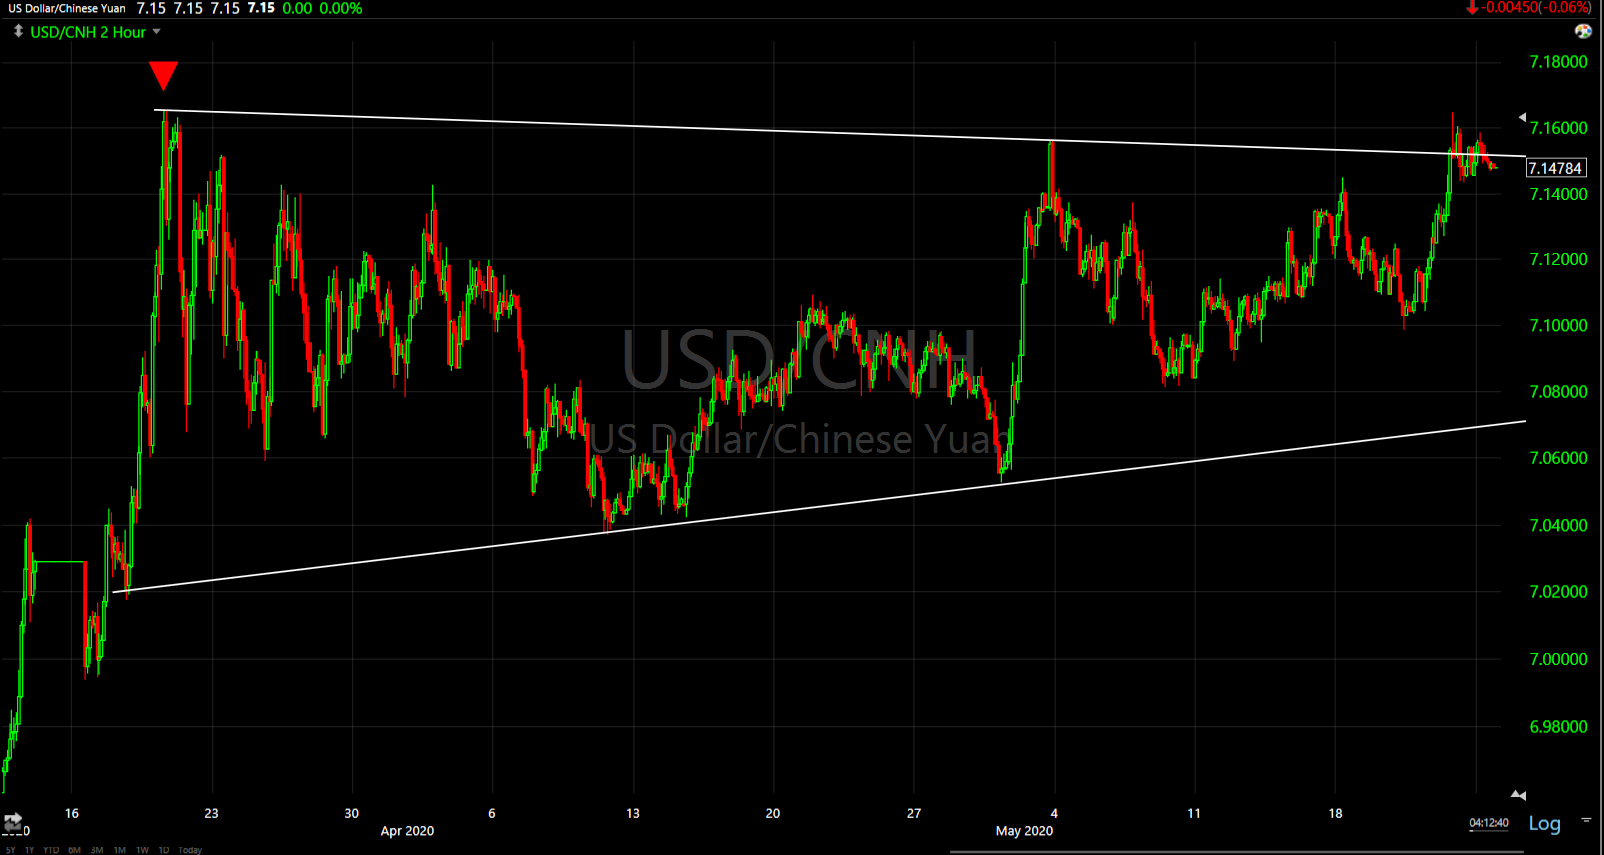
USD/CNH (2h) the red arrow is the Yuan’s March low that coincided with the Stock market’s March crash low. With the pair nearly breaking out, I’m “almost” surprised that stock investors are as complacent as they are… almost.
I’ll see you in the morning.