
The Dollar and Bitcoin Gain, While Stocks and Gold Consolidate
After 5 consecutive days of losses for the benchmark index, the S&P-500 posted a modest gain today to close just above its 200-day sma after having found price support yesterday at the $4200 area.
Helping the averages were a slate of mostly better-than-expected earnings results from blue chip companies: Verizon (VZ +9.3%), Coca-Cola (KO +2.9%), Dow (DOW +2.1%), RTX (RTX +7.2%), General Electric (GE +6.5%), and 3M (MMM +5.3%) were some of the standout earnings performers.
Today’s tier 1 economic data was limited to the preliminary October S&P Global US Services PMI, which came in better than expected, climbing to 50.9 from 50.1, and Manufacturing PMI, which rose to 50.0 from 49.8. While not garnering much attention, Regional Fed manufacturing surveys came in weaker than expected.
Averages
All the major averages closed with gains, albeit off their highs, with fairly broad based buying. Stocks hit an air pocket around 11:00 a.m. ET and pulled back to session lows. There was no specific catalyst to account for the mid-morning pullback, but it coincided with some mega caps dipping into negative territory. Mega-caps had looked better in pre-market, but when stronger than expected U.S. Services and Manufacturing PMI’s came out, yields rose and mega-caps dipped.
Overall the averages closed with similar gains which is typical of broad-based buying due to oversold conditions. The one average that didn’t keep pace was Dow Transports, which were near flat on the day (-0.01%).
S&P-500 ⇧ 0.73 %
NASDAQ ⇧ 0.97 %
DOW JONES ⇧ 0.62 %
RUSSELL 2000 ⇧ 0.82 %
As we know, the price trend for stocks has been the ugliest of the year since the top of the Heads in the Head and Shoulder patterns were formed, which in the S&P’s case, was topped with a rare, but meaningful Key Reversal Day.
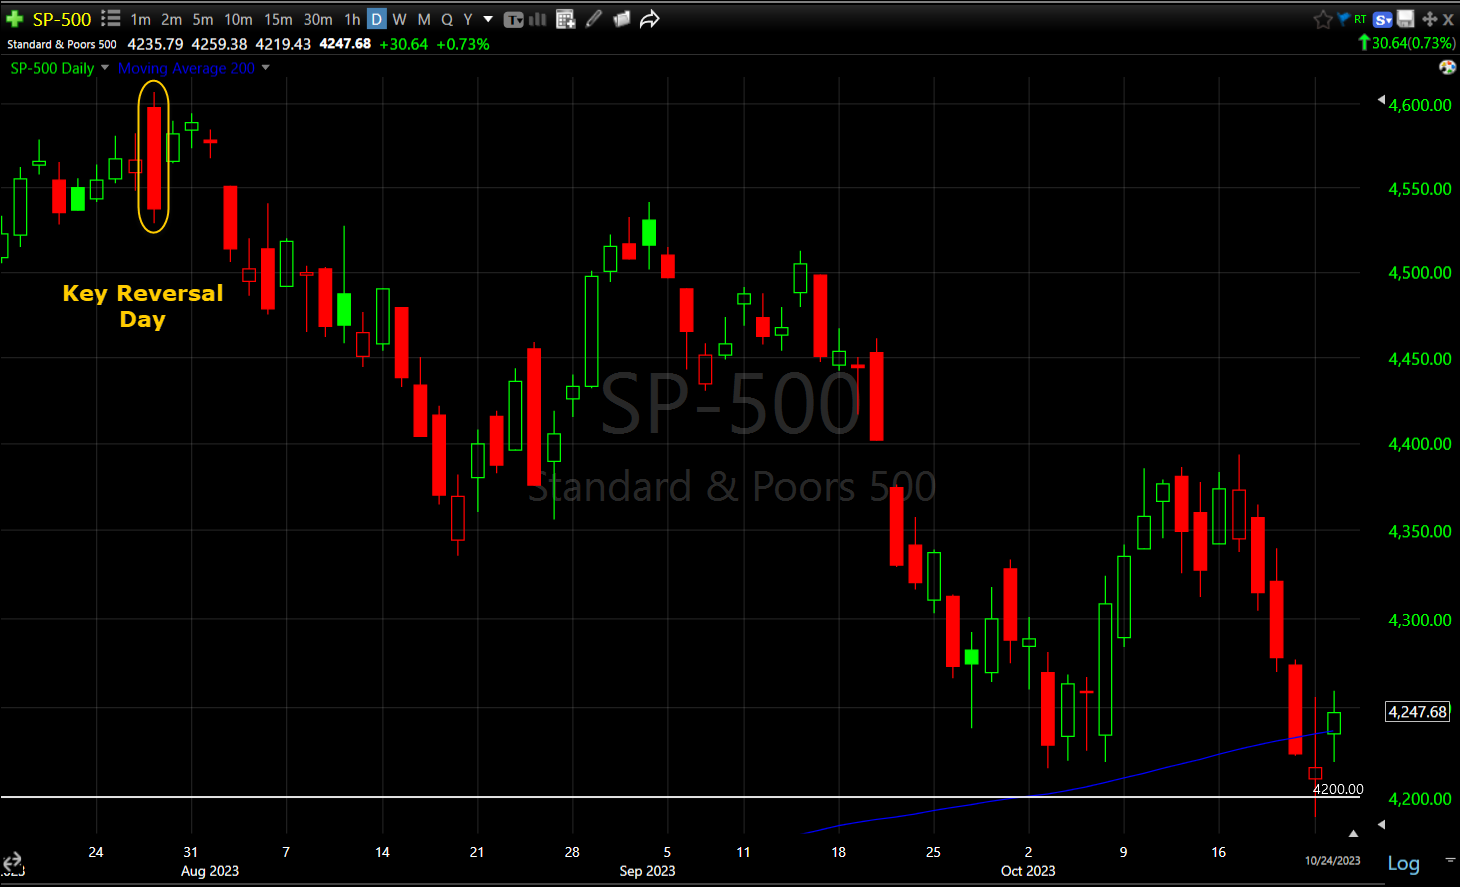 SP-500 (daily) – since then, the price trend for the S&P has been a sub-intermediate down trend, but it recently ran into $4200 and near its 200-day sma (blue). Price closed back above the 200-day today, despite a dip below on an intraday basis.
I won’t spend too much time on this because you already know what my expectations were heading in to the weekend, and that yesterday did nothing to change them, and today just added more credibility to my view that the market was set for a larger, broader consolidation (bearish bias), which earnings season only makes more likely.
With what we’ve seen the last 2 days, I think we’re right on track as each f the major averages consolidation is along the lines of a bear flag.
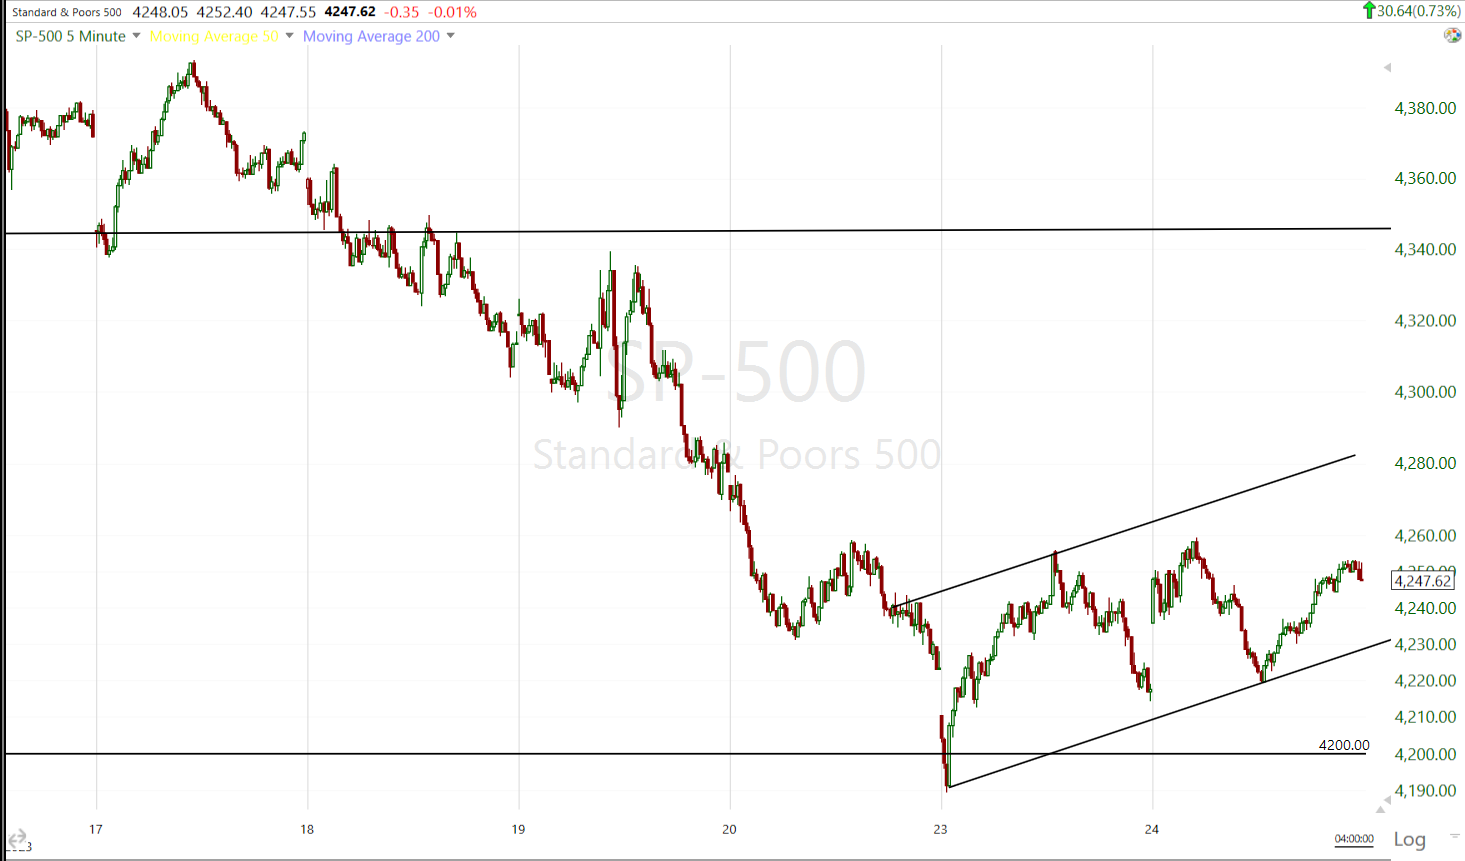 SP-500 (5m)
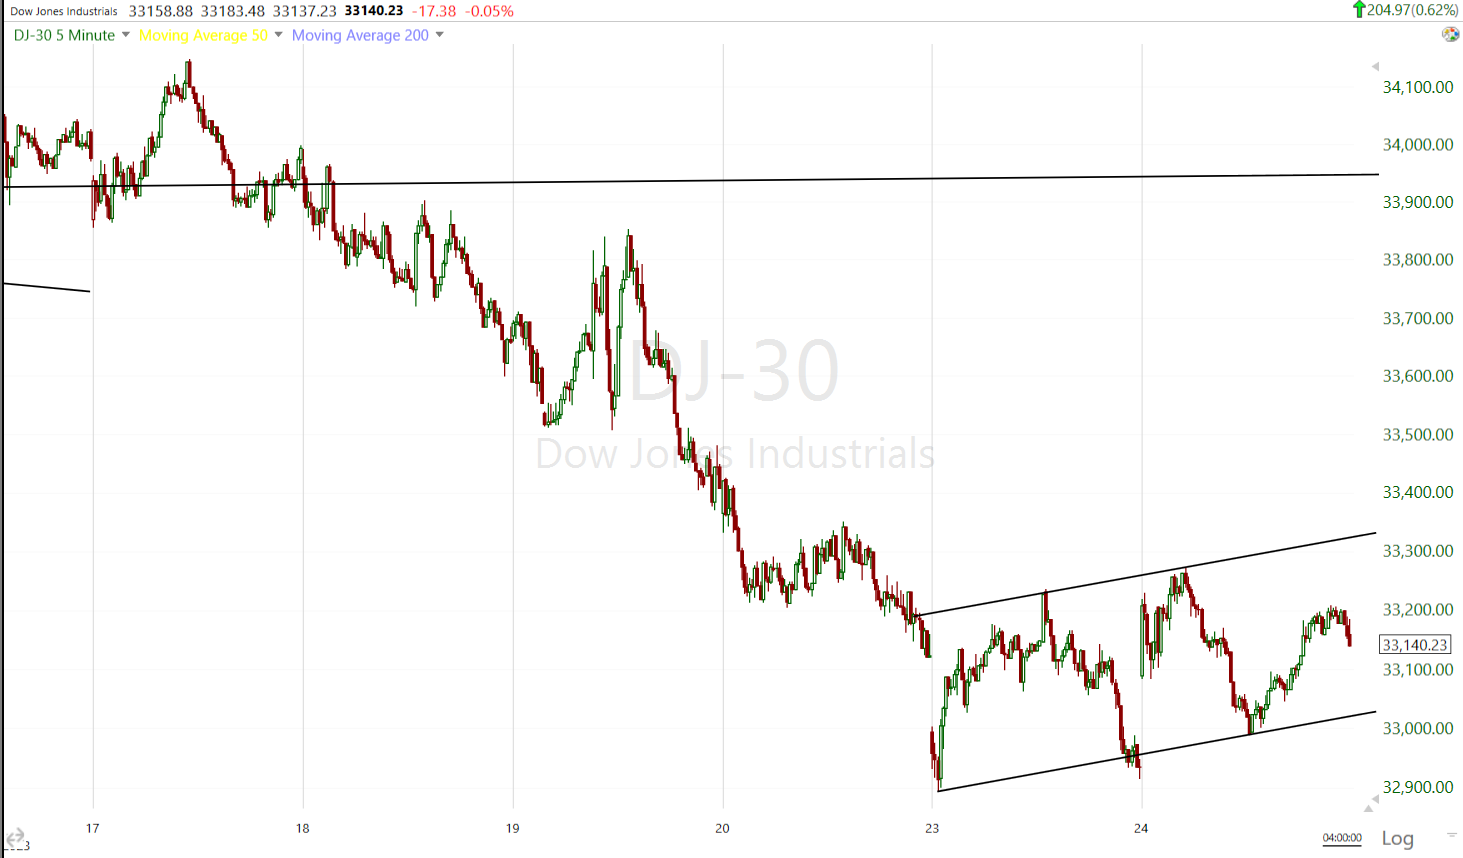 Dow (5m)
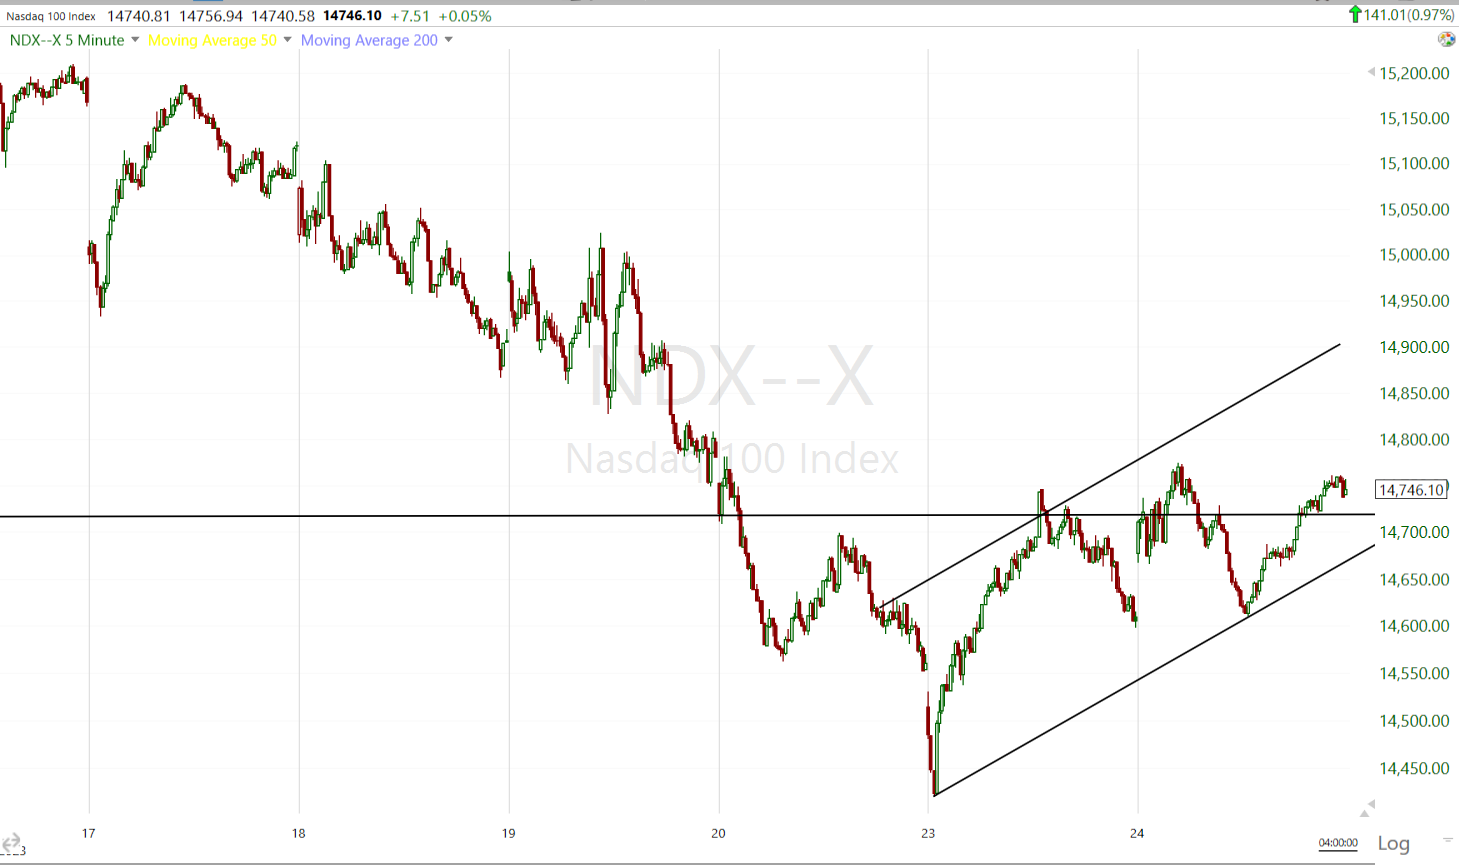 NASDAQ-100 (5m)
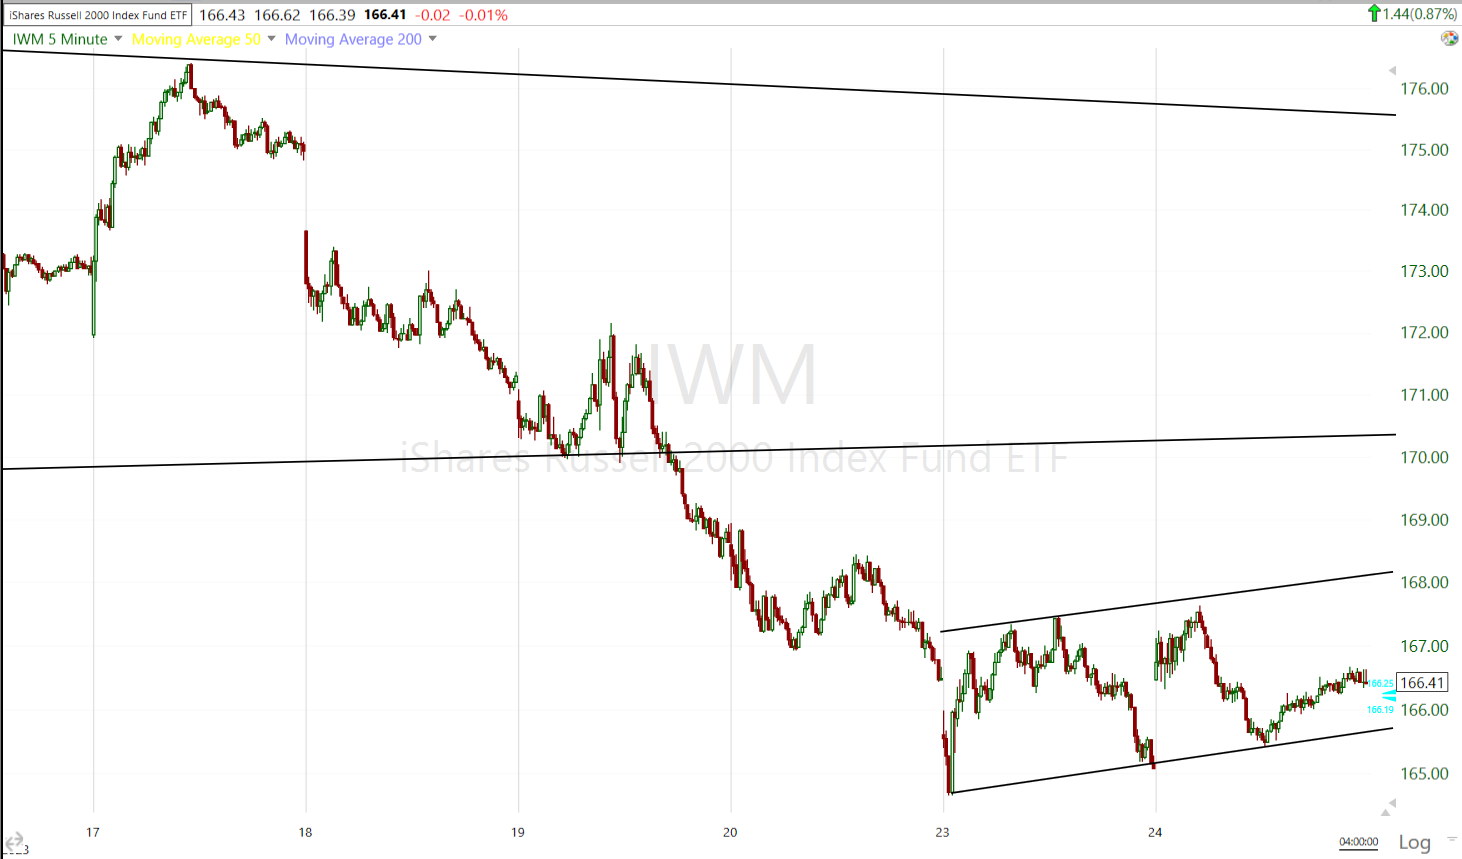 IWM (5m)
My Most shorted Index displayed some signs of short covering at the open, but as the day went on, that faded.
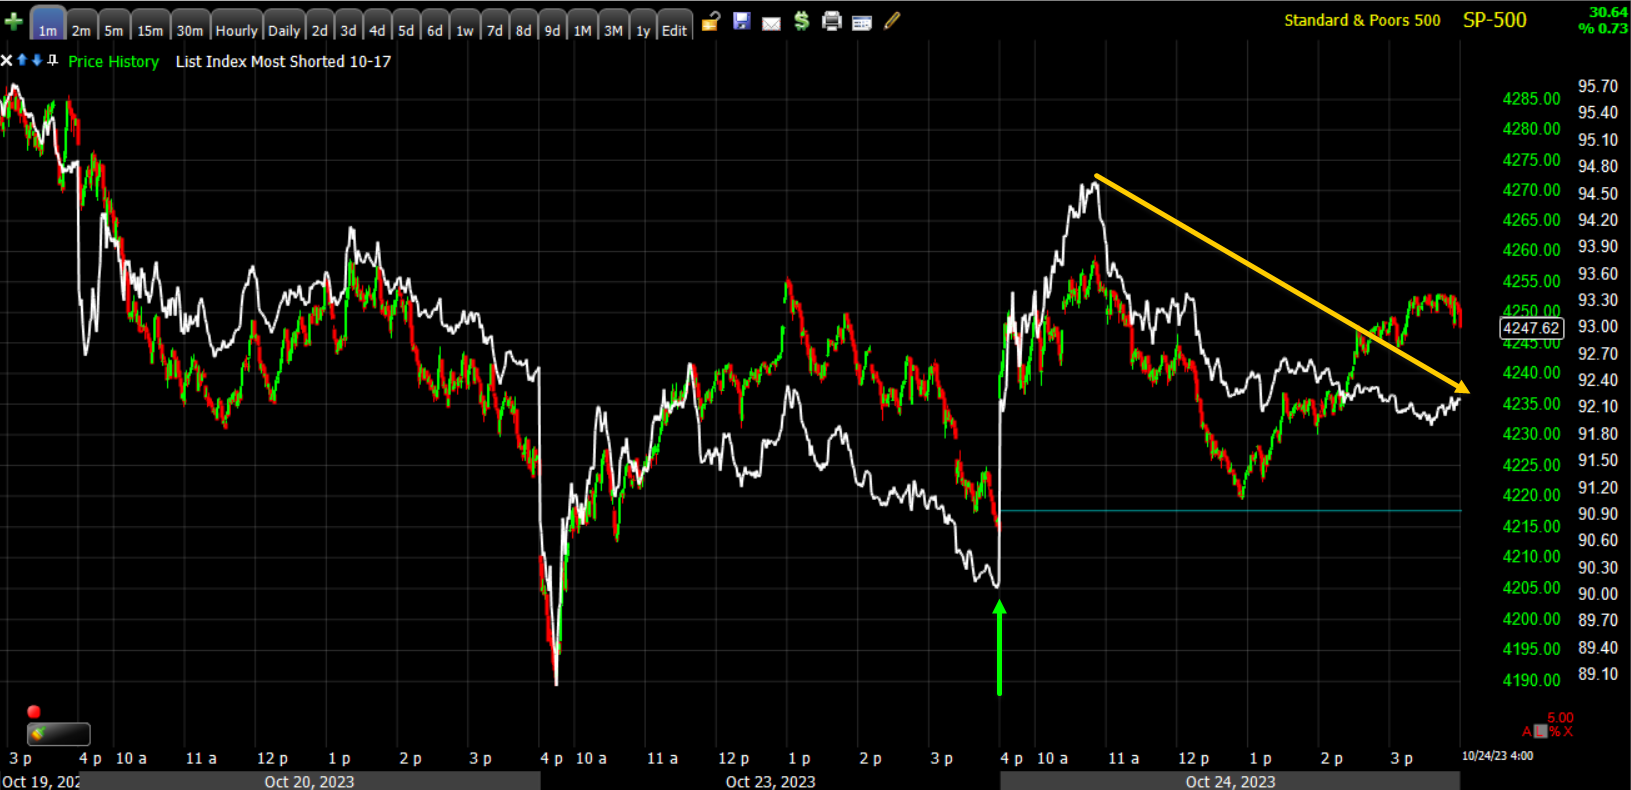 SP-500 (1m) and MSI
As mentioned above, Dow Transports are not keeping pace and as you may know, Transports “Should” confirm Dow Industrials and when they don’t, Transports are usually the leading signal for Industrials. On a short term basis that gives the 2-day bear flags an even more bearish bias…
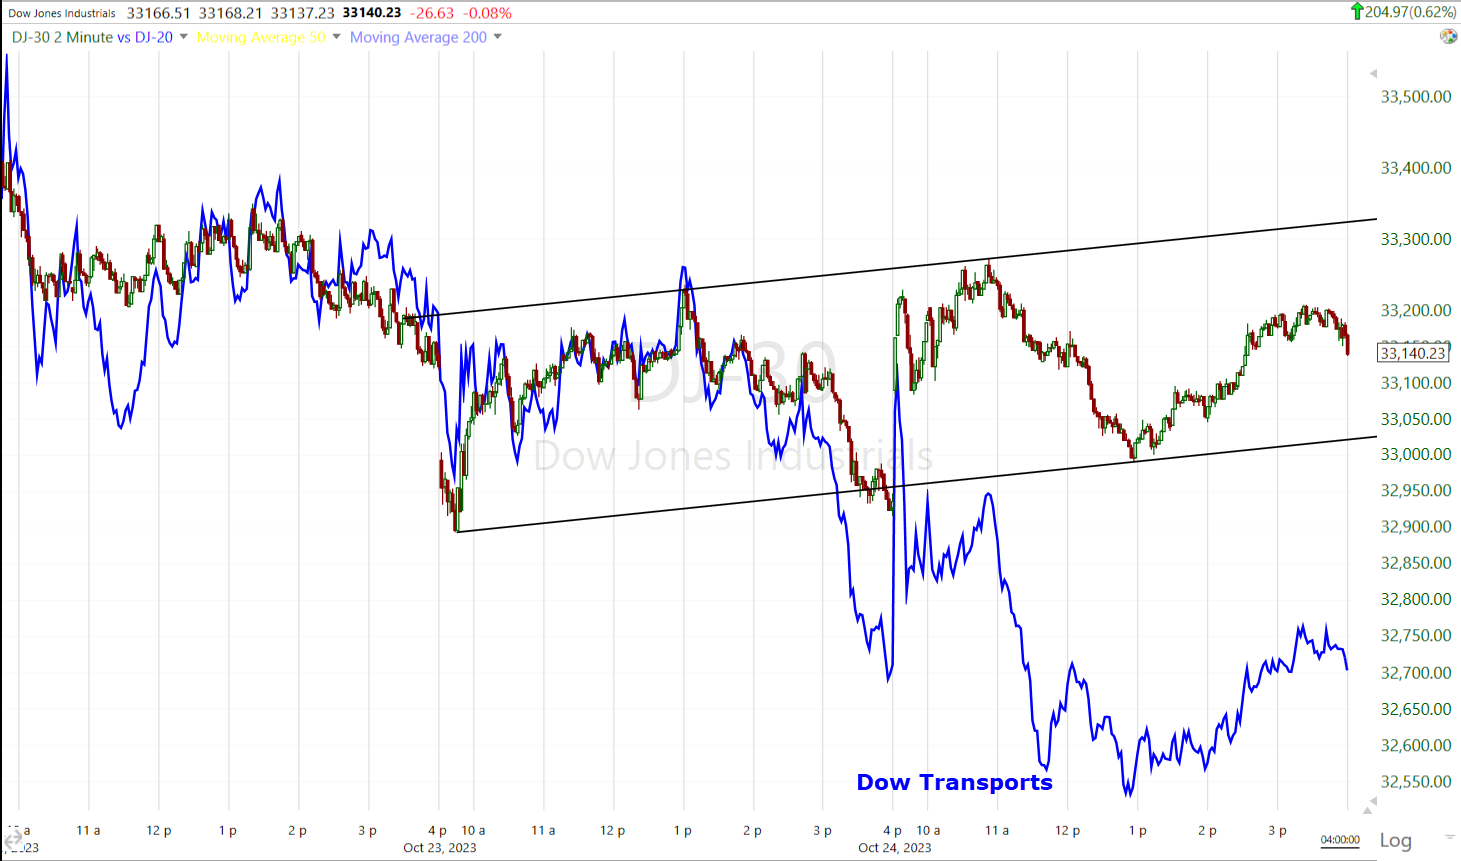 DJIA’s (2m) bear flag this week and Dow Transports (blue) leading lower (the price chart is normalized).
If we go back further, Transports actually led the Dow in to the July H&S highs, but since reaching those H&S highs, Transports have been leading the Dow lower as the chart below demonstrates…
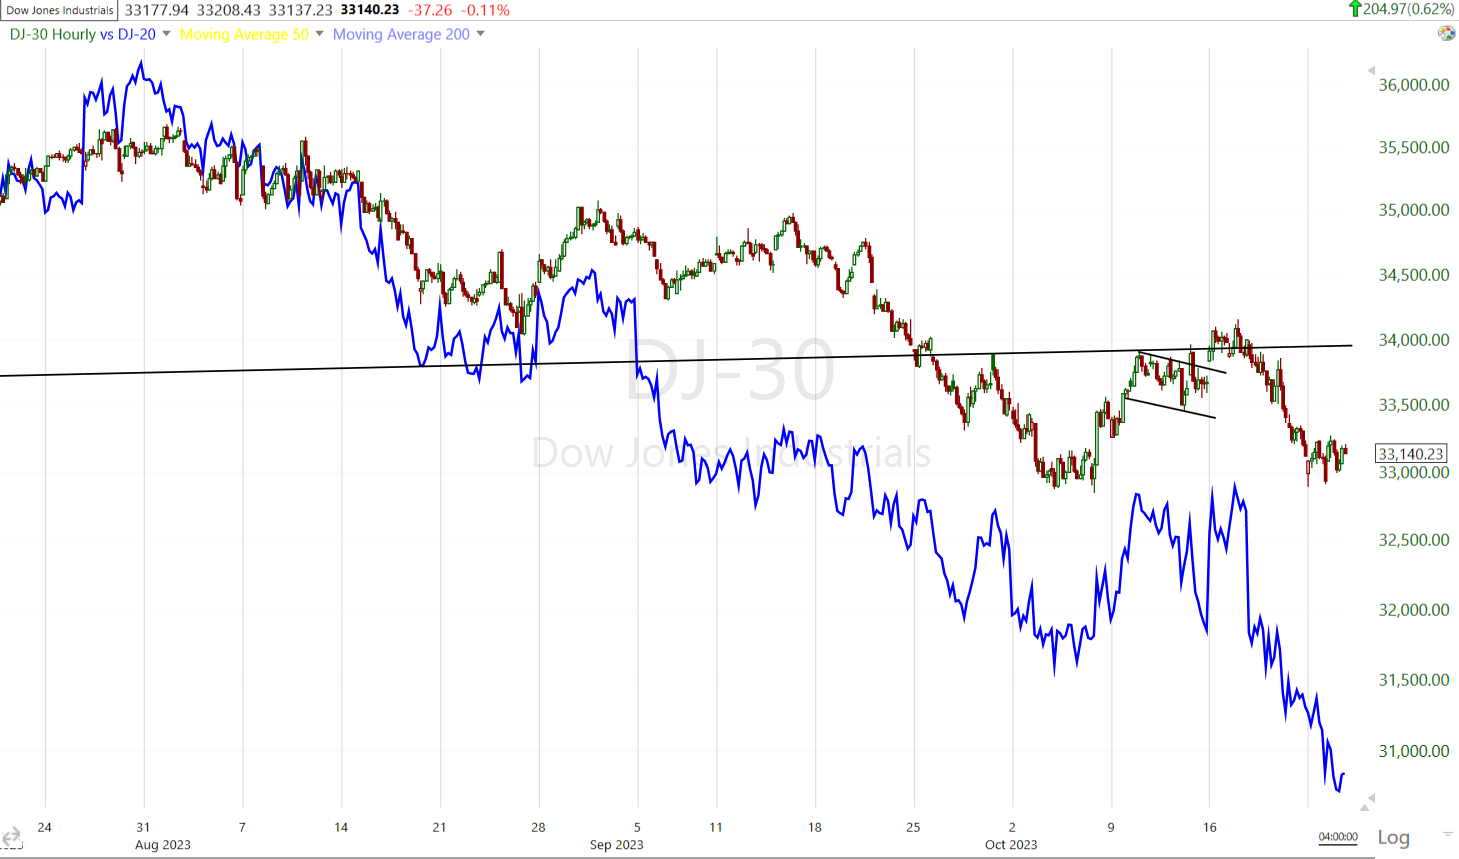 DJIA/Transports (60m normalized) from the H&S top highs.
After noticeable relative weakness in VIX (-6.85%) yesterday, this morning the volatility gauge was acting more normally as price dropped back below $20 (closing at $19.05), but afternoon trade saw volatility’s relative weakness make another appearance. VVIX’s (-9.6%) was more pronounced for a second day and VVIX has a tendency to lead VIX’s relative performance, all of which suggests to me that volatility is acting like it too expects the equity market to correct/consolidate here.
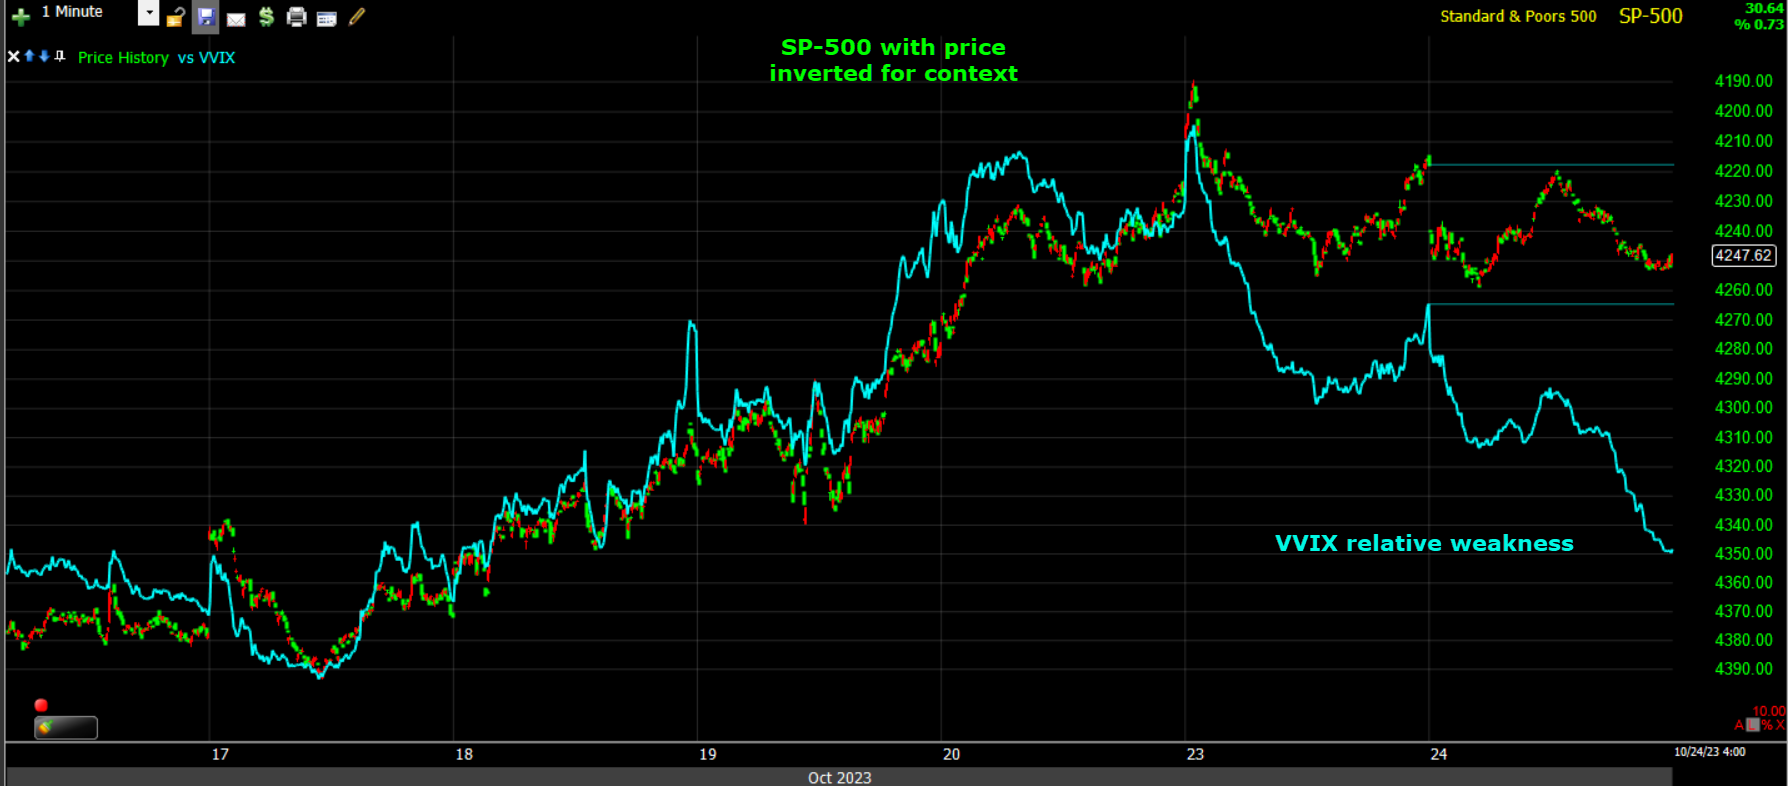 VVIX recent relative weakness
At 38, the Absolute Breadth Index is a non-factor.
S&P sectors
Illustrating the broad-based nature of the day’s advance, 10 of 11 S&P sectors closed higher with Energy the lone sector in negative territory after another loss in Crude oil futures. Sector bias, however, was all over the place, which isn’t uncommon in earnings season, or early in an oversold rebound. At the top of the leaderboard with gains of at least 1% or more we had defensive/bond proxy sectors like Utilities and Real Estate, also pro-cyclical Materials, and mega-cap heavy Communications and Consumer Discretionary.
Likewise, toward the bottom of the leaderboard we have pro-cyclical Energy, defensively oriented Health Care and while not as bad by the close, mega-cap heavy Technology.
The mega-caps (MGK +0.85%) dipped very modestly into the red in early afternoon trade and ended the day just 20 basis points better than the S&P Equal Weight index (+0.2%).
Semiconductors (+1.4%) didn’t stand out earlier, but doubled the Tech sector’s gains by the close.
Bank stocks were a pocket of weakness today related to concerns about credit quality, deposit costs, and weakening loan demand. Regional Banks fell -0.6% and the KBW Bank Index (-0.05%) was slightly below unchanged. you may recall that both of these broke down from bear flags last week.
Materials ⇧ 1.18 %
Energy ⇩ -1.41 %
Financials ⇧ 0.69 %
Industrial ⇧ 0.75 %
Technology ⇧ 0.69 %
Consumer Staples ⇧ 0.85 %
Utilities ⇧ 2.57 %
Health Care ⇧ 0.31 %
Consumer Discretionary ⇧ 1.07 %
Real Estate ⇧ 1.26 %
Communications ⇧ 1.18 %
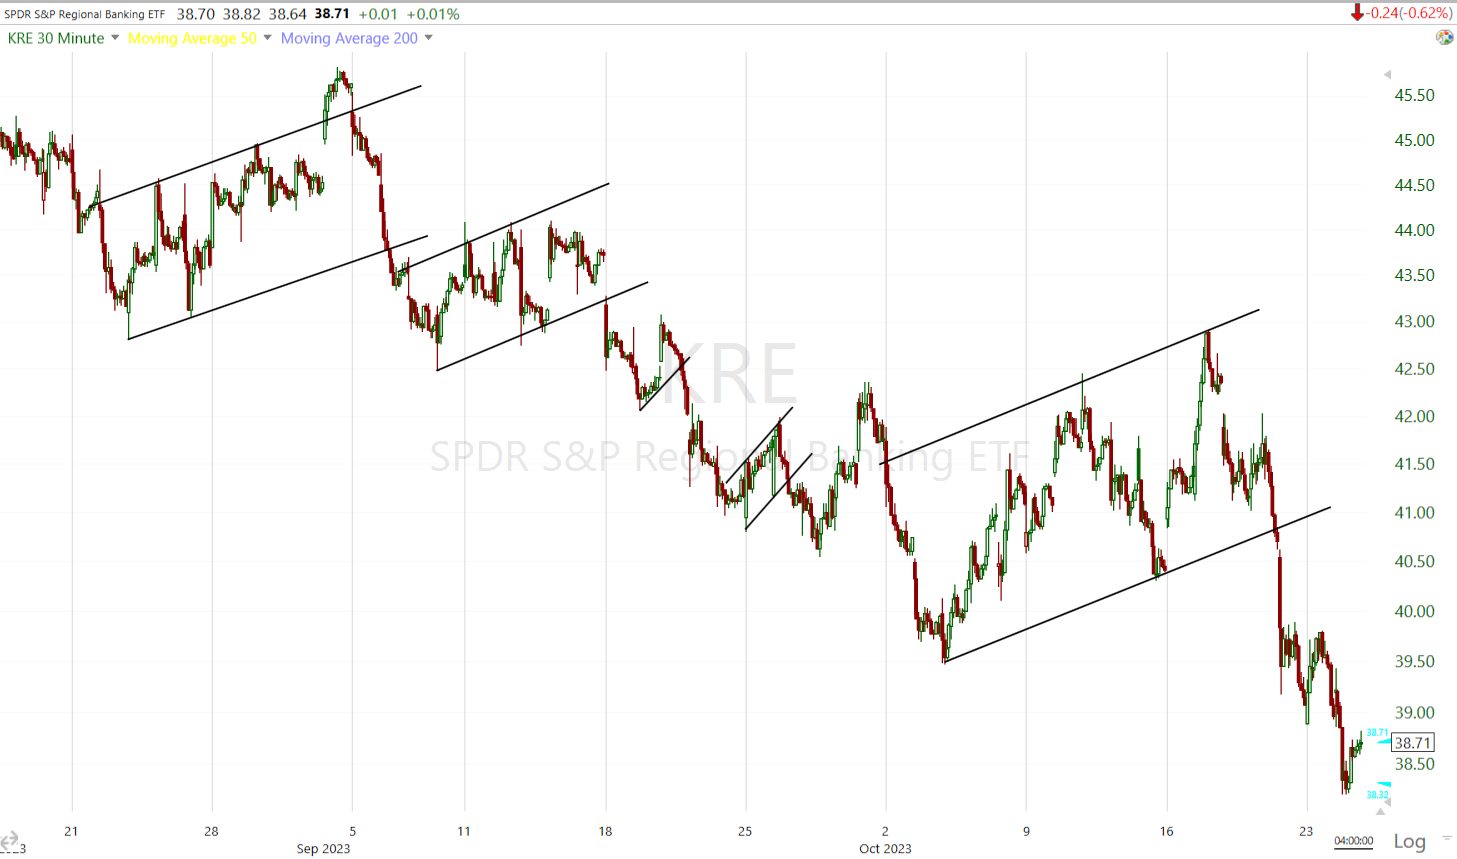 Regional Banks (30m)
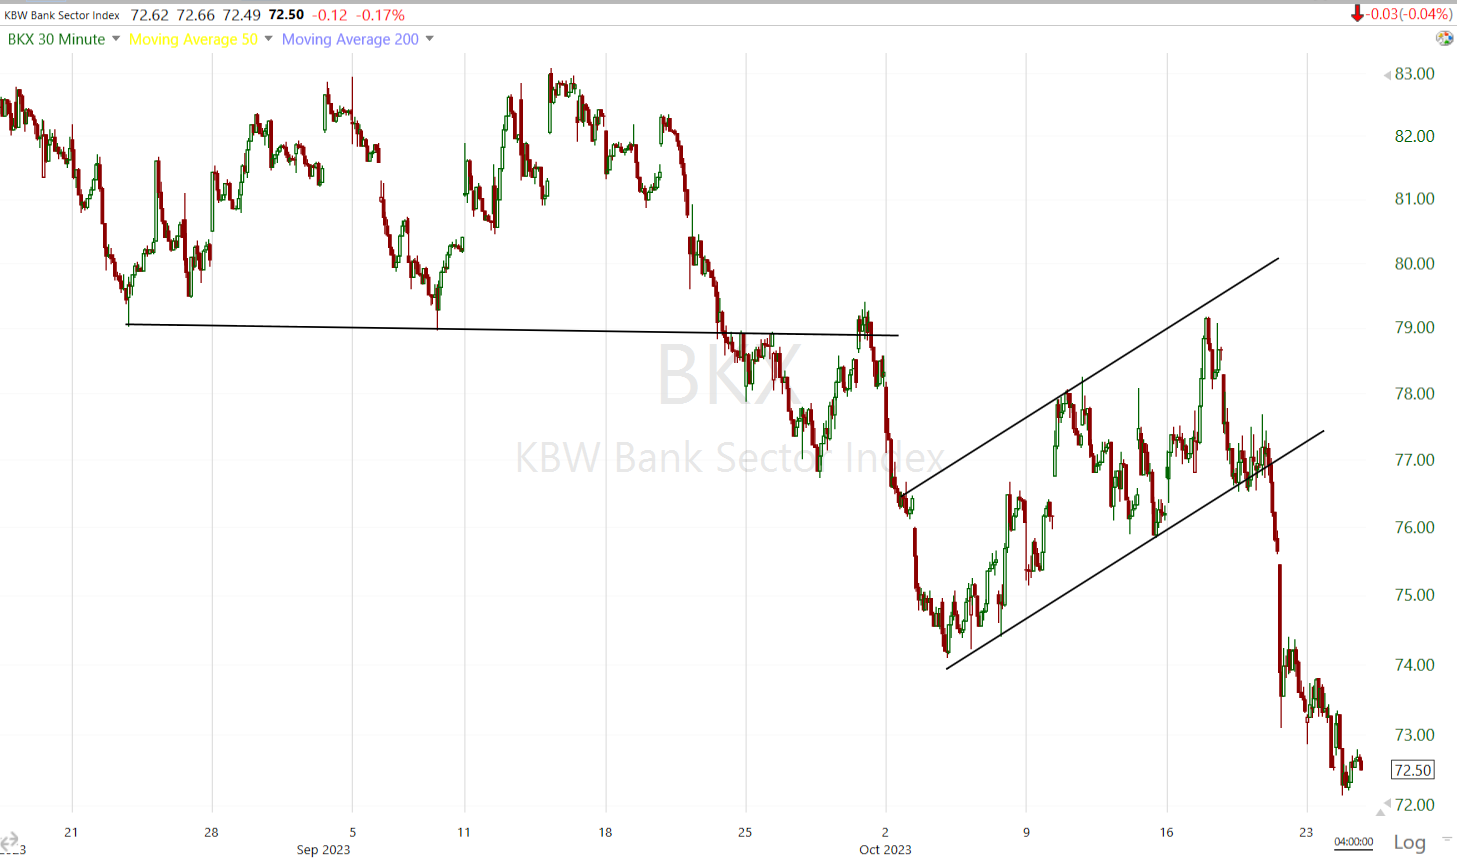 KBW Bank index (30m) which has already fulfilled more than -6% of its -10% downside measured move from the bear flag.
Internals
NYSE Advancers (1957) held a 2-to-1 margin over Decliners (863) on lighter Volume of 863 mln shares.
The Dominant price/volume relationship came in very strong at Close Up/Volume Down, which is the most suspect of the 4 relationships. It’s also exactly what you expect to see in a market that’s consolidating/correcting, but with a bearish bias.
All 3 conditions necessary for 1-day overbought internals are present, although it’s difficult to call a market with a three-quarter percent gain, and up for the first day of the last 6, “overbought”, however, the 1-day overbought signal is as solid as you can ask for. In this case I’d take it more as a signal of the quality of the advance today, which is to say, “poor”.
Treasuries
The 10-yr yield settled unchanged from yesterday at 4.84%. The 2-yr yield rose four basis points to 5.10% following a $51 billion 2-yr note auction that was met with solid demand.
While yields saw a sharp drop yesterday in reaction to Bill Ackman’s tweet that he covered his bond short, there’s nothing on the chart that even hints at a change in character that suggests an end to the the sharp rise in longer term yields.
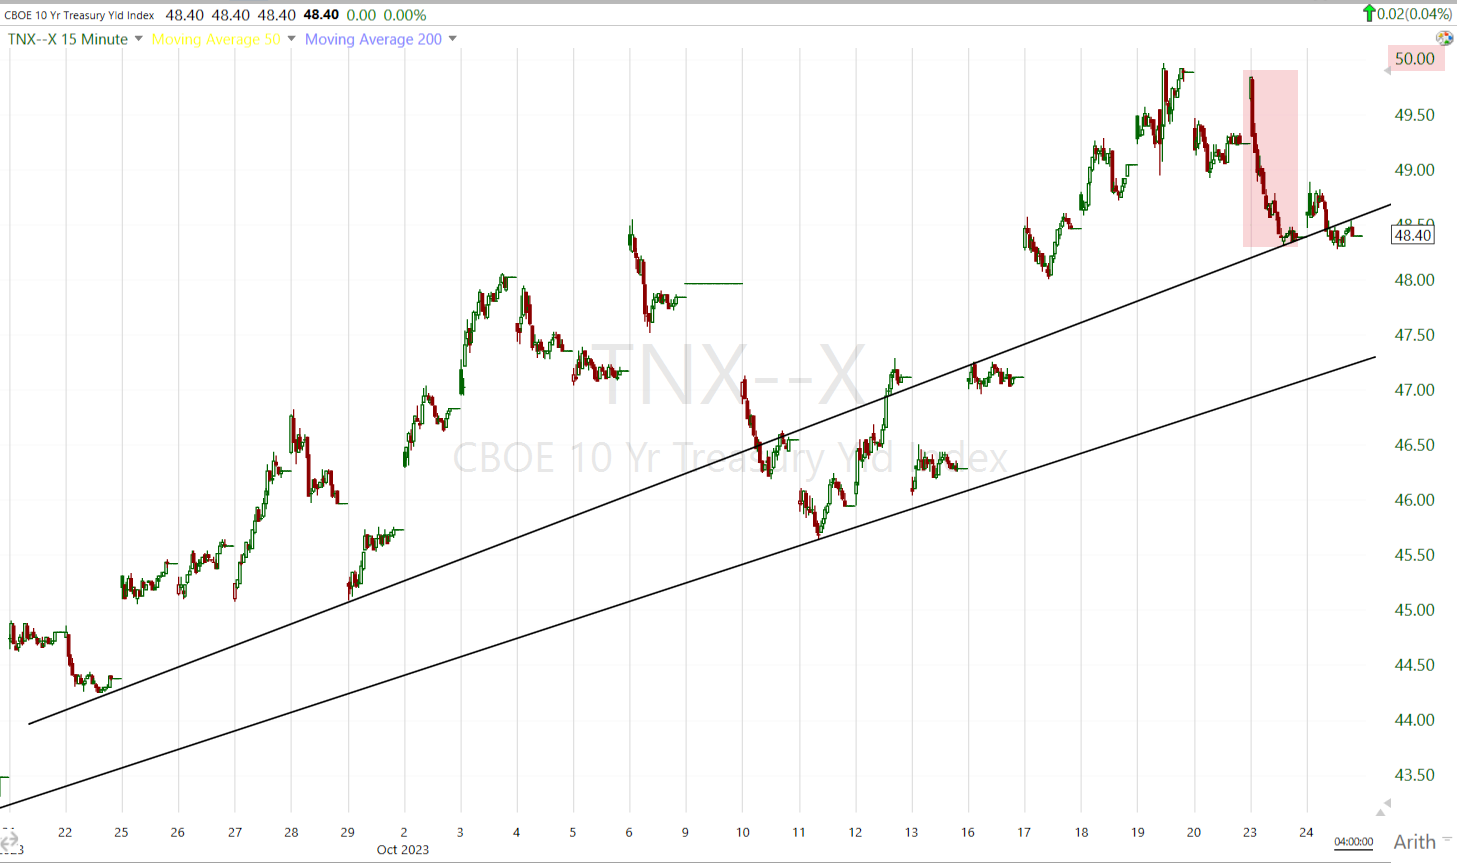 10-year yield (10m) I haven’t moved these two trend lines since I drew them, and both are unusually steep as compared to the rise in yields preceding them from May. The fact is, if we expect a consolidation/correction in the equity market this week (and perhaps a bit longer), then we should expect the same in yields. If we expect the S&P’s $4200 level to act as a temporary speed bump in the decline in price from $4600, we should expect the 10-year’s 5.00% level to do the same (the 10-year yield hit 5.02% this week before Monday’s cash open). The last “normal” correction which was actually instigated by a flight to safety in to bonds after Hamas attacked Israel over the weekend, was to the second trend line and was nearly 30 basis points. So far the 10-year has pulled back to the first trend line and 17 basis points. Thus far it’s about half of what was a normal correction just a few weeks ago. Beyond the sharpness of yesterday’s correction in response to Ackman’s tweet, I don’t see anything that looks abnormal on the chart.
After recent very sharp yield curve steepening (especially since September) among yield curves, the last 2-days have seen a correction with some modest flattening. Like everything else in the market, nothing moves in a straight line, but the 2-days of flattening does not take anything away from the worrisome recession signal of sharp yield curve steepening after yield curve inversion. The inversion of the curve is the warning that a recession is coming, but the sharp steepening after inversion is a sign that the recession is near.
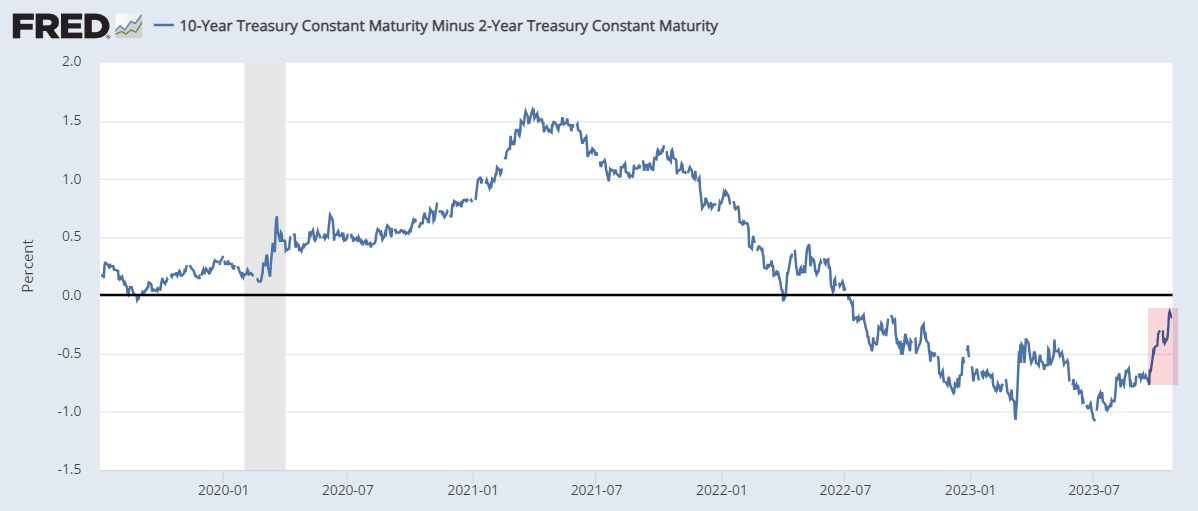 2s-10s yield curve with very sharp steepening since September highlighted in red and the last 2-day’s’ correction barely registers as a blip on the chart.
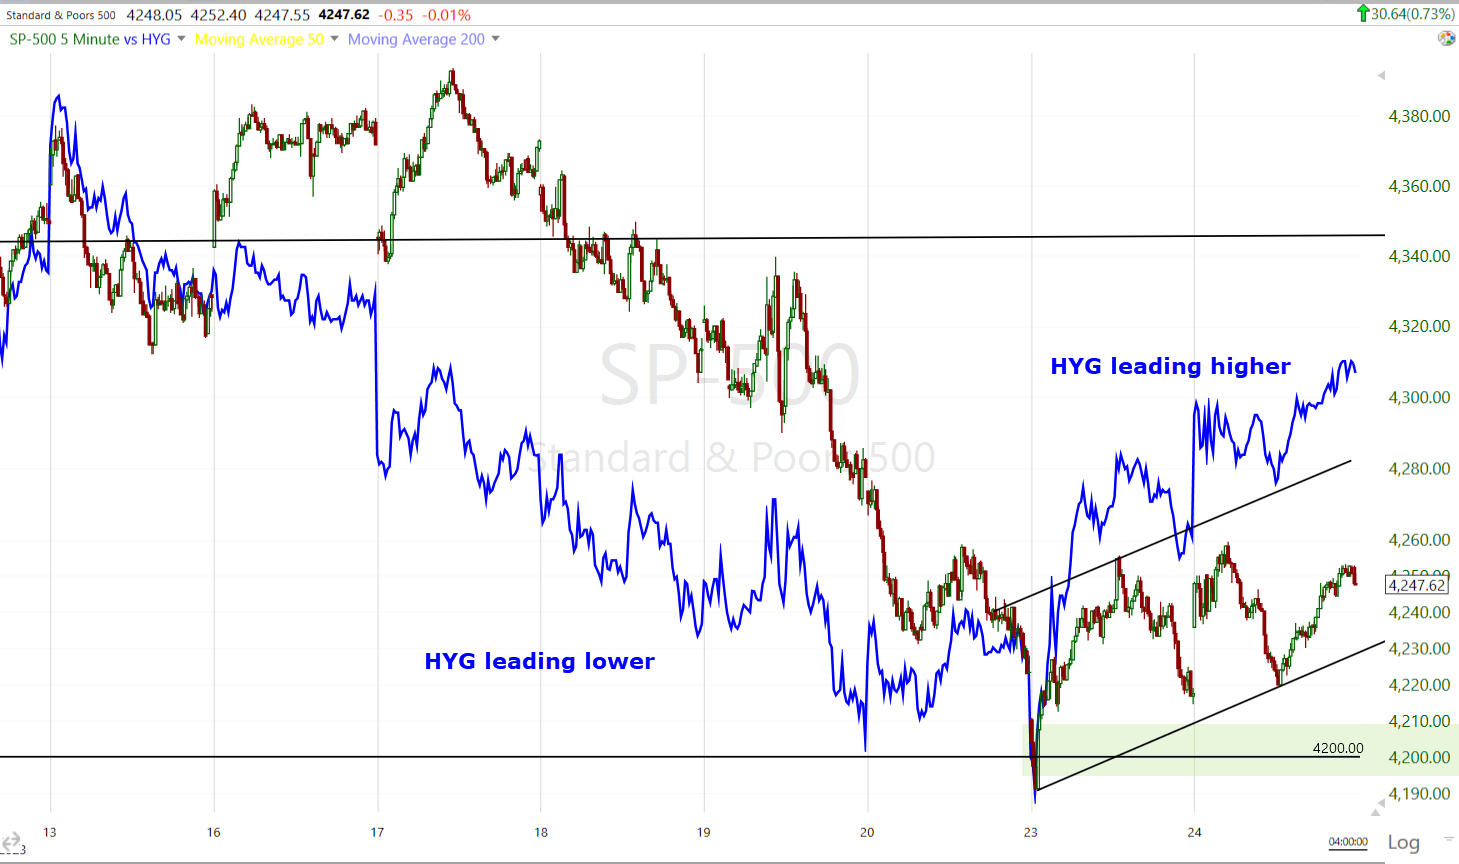
High yield Credit (HYG +0.5%) did relatively well today and in the short term, continues to lead the market off the week’s lows in a consolidation/correction. Recall that HY Credit led the market lower in to this week’s lows as well right up until the point that the S&P caught down to credit at $4200. It is one of my favorite market-based leading indicators.
 (5m)
(5m)
Currencies and Commodities
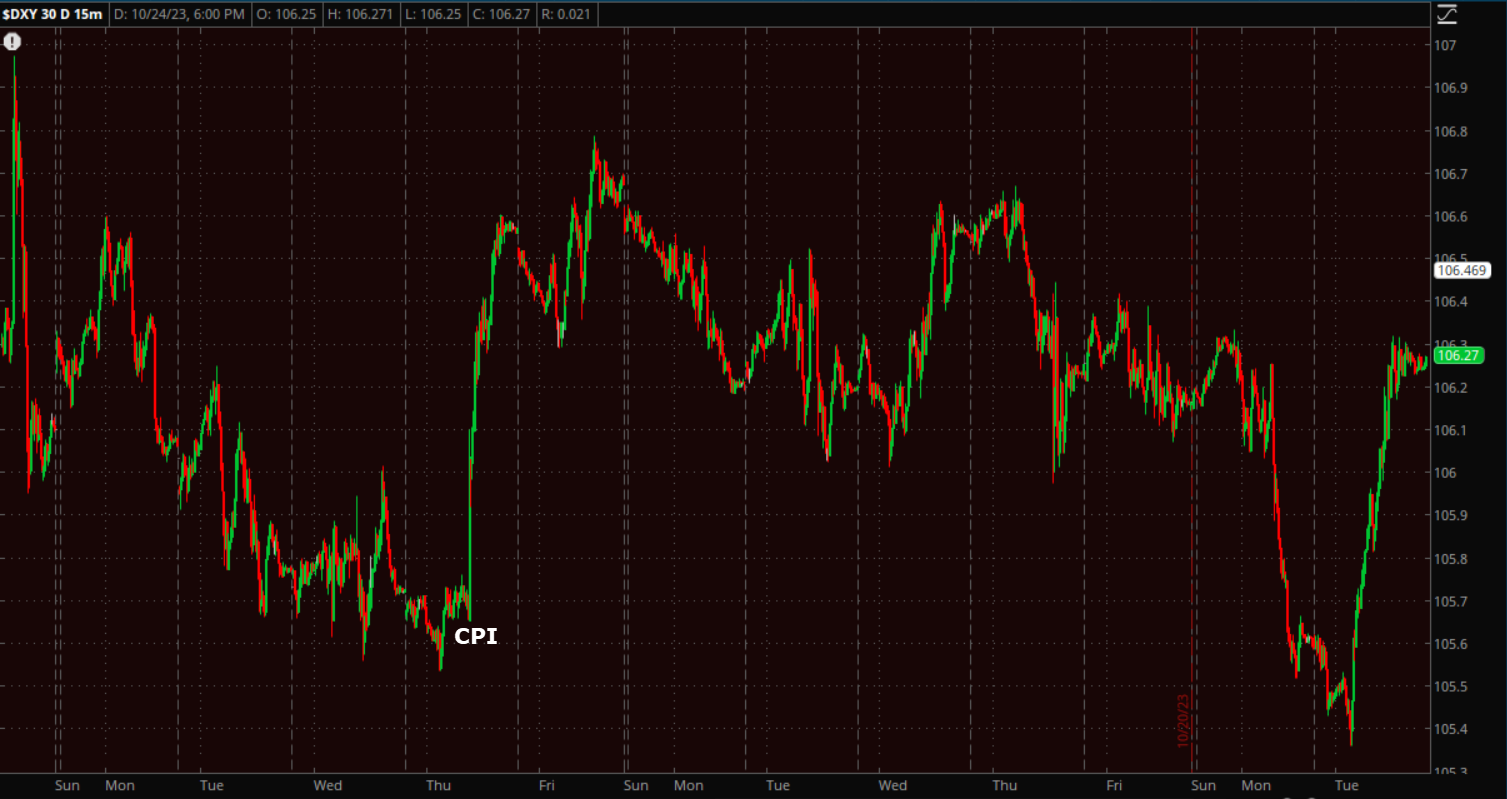
The U.S. Dollar Index gained about +0.6%, rebounding from pre-CPI levels and erasing yesterday’s Dollar weakness…
 U.S. Dollar Index (15m)
I’ve read some headlines from mainstream financial media outlets implying that the Dollar’s strong gains today were a reflection of the strong U.S. PMI’s – thus a strong U.S. economy, implying the data supports the view of a “soft landing” or no recession. First, PMI’s are “soft data” or survey data (Purchasing Managers Index), not hard data. They are opinions of purchasing managers. More importantly, the Dollar’s strength today was more of a reflection of the weak European PMI’s than the strong U/.S. PMI’s. The Dollar moves opposite of other major currencies such as the euro. If you take a closer look at the Dollar’s price chart (or the Euro’s), you can clearly see the Dollar’s gains are because the U.S. PMI’s are better than the European PMI’s. It’s a matter of relatively, not a signal that the U.S. may sidestep a recession.
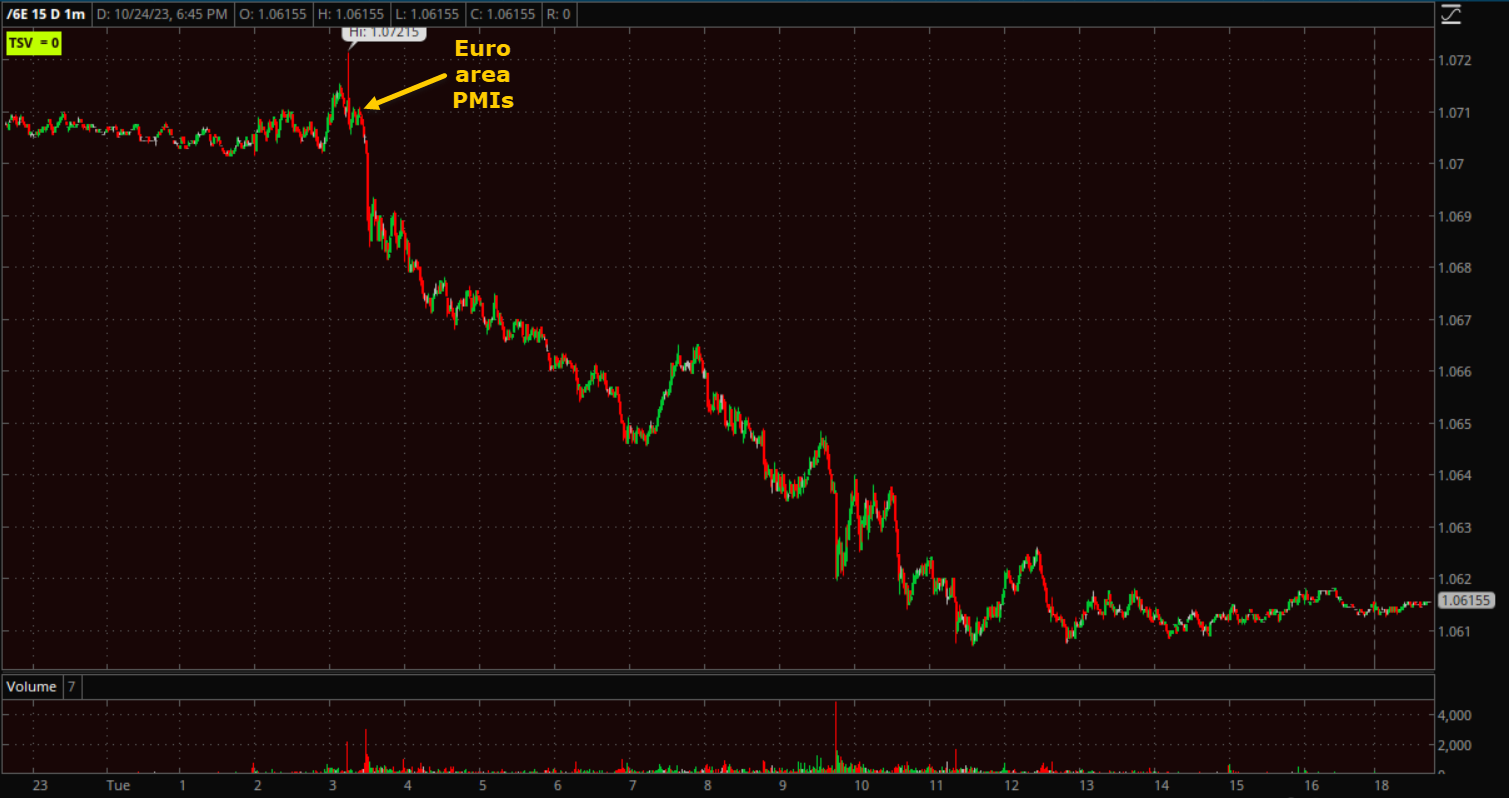
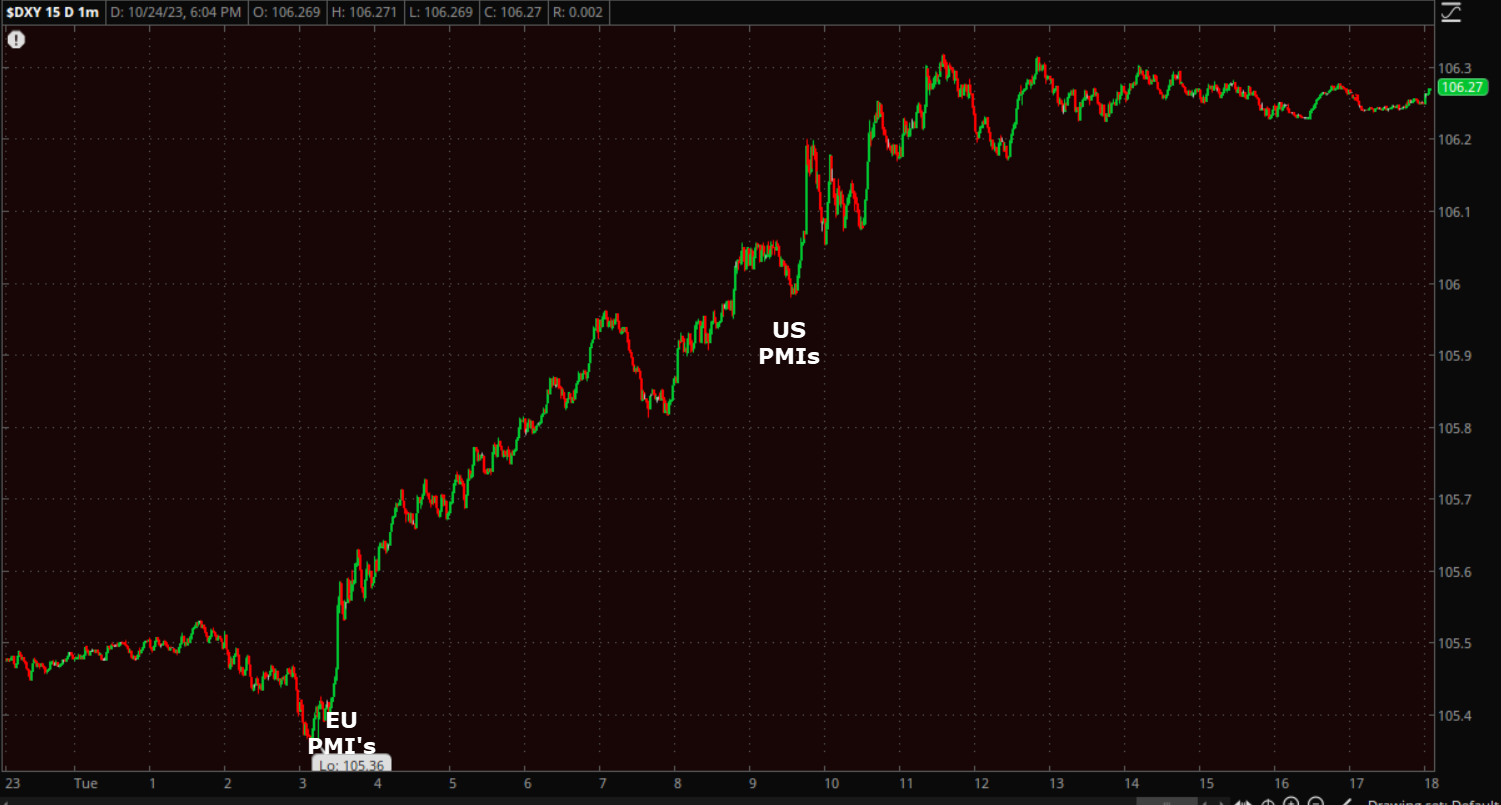 U.S. Dollar Index (1m) rises sharply due to the Euro falling sharply in reaction to disappointing European PMI’s. The Dollar gained a little on the release of the U.S. stronger PMIs but not so much as the weak European PMI’s.
Here’s the view from the euro’s perspective, the most influential currency in the Dollar Index, accounting for near 60% of its weight.
 Euro Futures (1m)
Or, you can simply look at the FX pair, EUR/USD and see the huge plunge at 3:30 a.m. ET, with virtually nothing standing out on the price chart as U.S. PMI’s came out at 9:45 a.m. ET.
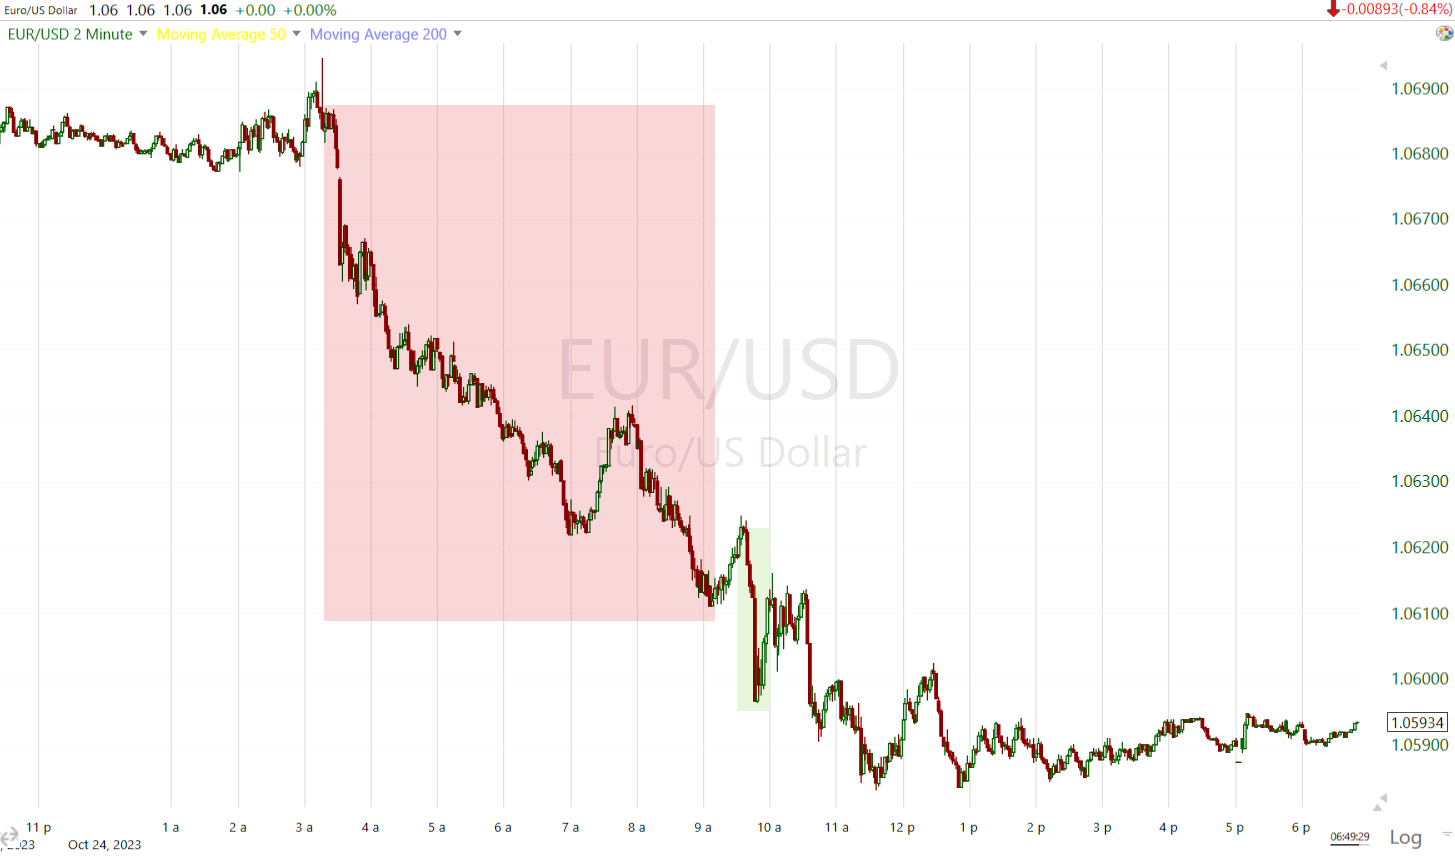 EUR/USD (2m) with the reaction to EU PMI’s in red and U.S. in green.
Energy complex futures settled in mixed fashion again. WTI crude oil futures fell -2.0% to $83.79/bbl and natural gas futures rose +1.4% to $2.97/mmbtu. Just last night in the Daily Wrap I pointed out that despite the war premium and risk of a broader regional conflict sending crude prices sharply higher, Crude’s price chart doesn’t look so great.
“ just looking at price action alone, these last 2 or so weeks look like a bear flag consolidation of the losses from the orange rectangle! If the war were to end tomorrow or simply not worry the market, the downside measured move for such a bear flag would be a decline of nearly -12% from the point price breaks under the lower red trend line.”
Today’s price action didn’t help matters…
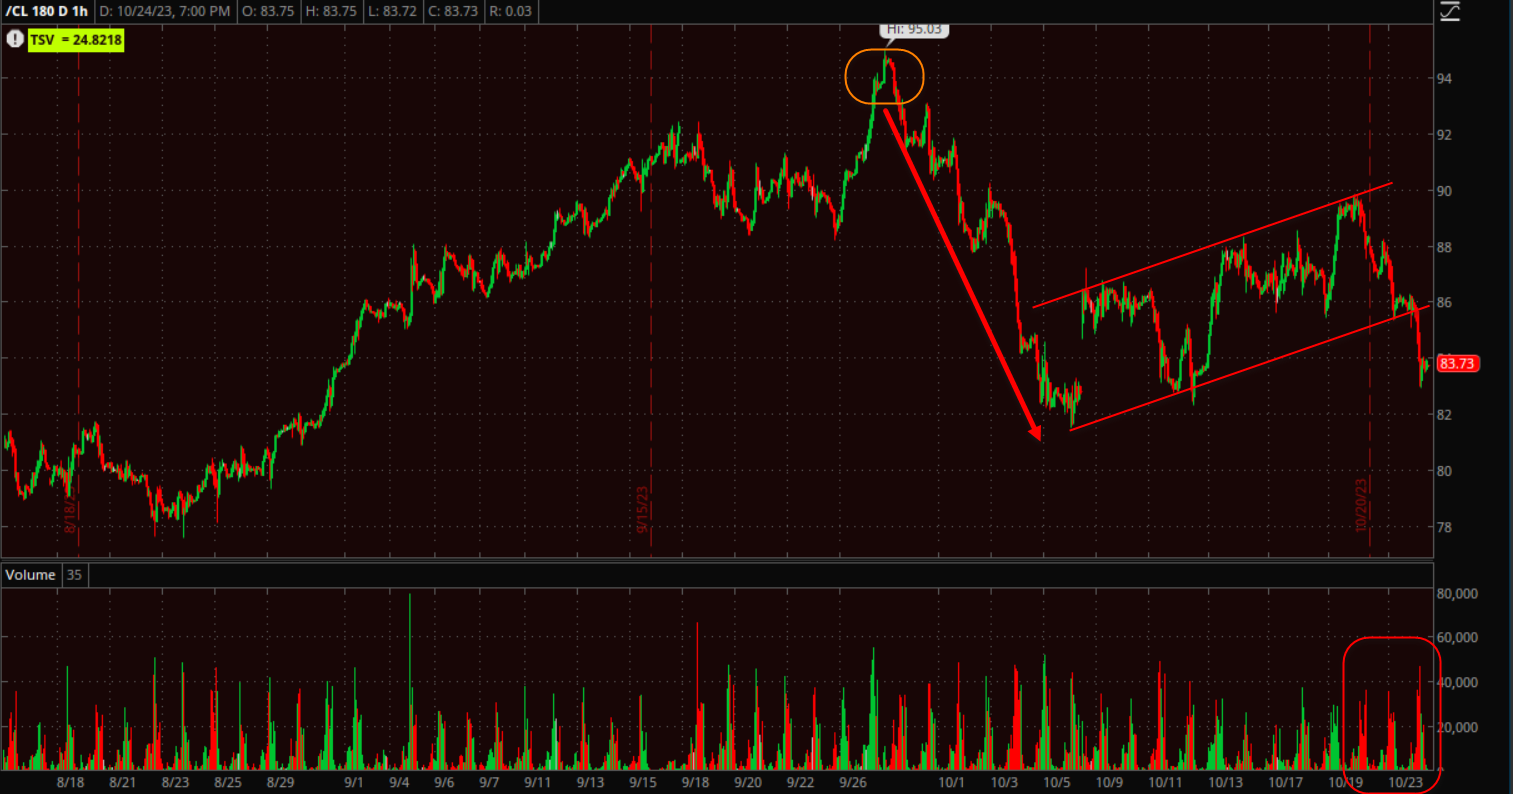 WTI Crude Oil futures (60m) – When I put on a position, I like to try to account for and control as much risk as possible. For instance, I’m not going to put on a large stock position ahead of earnings. I don’t want to be short oil with the unpredictability of the middle east conflict, but from a price-only perspective, this is an ugly, bearish price chart. If it weren’t for the unknowable and unpredictable risk of the war, I’d certainly have Crude high in my list of short trades. I definitely would NOT be long crude oil with a price chart looking like this.
UNG gained +2.2% with nice-looking price action coming off the bottom support trend line of a base, but volume did not see an increase on the day’s more bullish price tone.

UNG (daily)
However, 3C charts are looking better in both UNG and Natural Gas futures as highlighted this afternoon.
Gold futures settled very modestly lower by -0.1% (considering dollar strength) to $1,986.10/oz, off overnight lows of about -1.2%. Gold’s price action and decent relative performance is consistent with its own consolidation (bullish bias) after hitting $2,000 early this week. It’s funny how all of these key levels in equities, yields and gold all align. In any case, as expected, gold’s consolidation has a very bullish bias to it suggesting it will make another move higher after the consolidation phase is through.
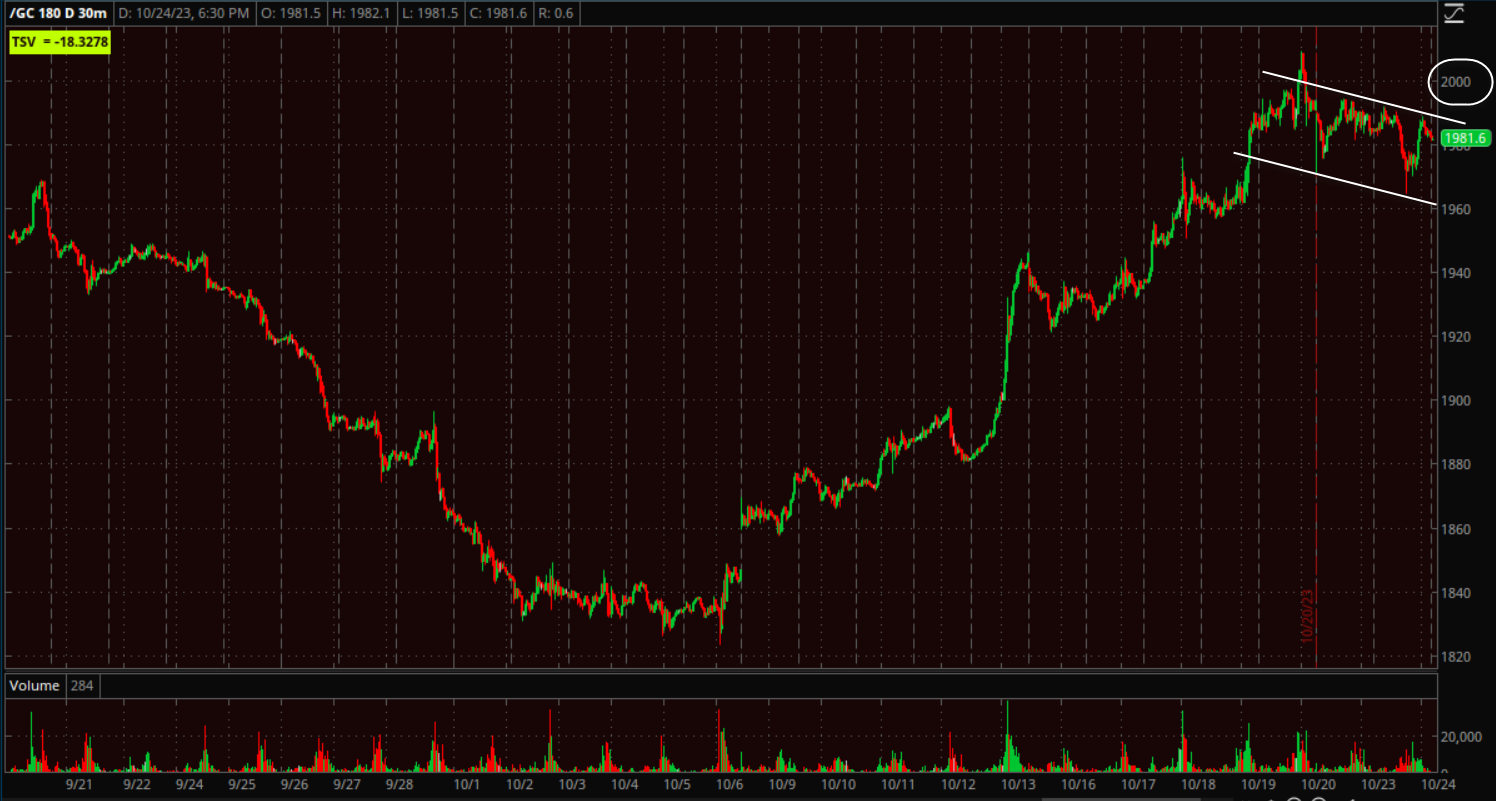 Gold futures (30m) with a nice bull flag after peaking slightly above $2,000.
Bitcoin jumped above $35,000 in overnight action on heavy volume, which is the highest since May of last year. Price has since pulled back under $34k, but it appears to be a bullish consolidation on diminishing volume.

BTC/USD (60m) – The reasons cited for BTC’s surge are numerous from expectations of an imminent Bitcoin spot-ETF after the the SEC abandoned its court ETF appeal, the recently obvious safe-haven status similar to gold’s due to the geopolitical risk with war erupting in the middle east, short squeeze, hyper-inflation in Argentina and renewed institutional interest.
Summary
Tonight’s summary is pretty simple and does not deviate from my expectations posted Friday and confirmed yesterday. The market is in a consolidation phase as we get into the thick of earnings season. Then next week we’ll have the November 1st FOMC policy announcement.
Between factors like VIX and VVIX’s relative weakness as well as HY Credit leading the S&P higher, I fully expect that this consolidation will continue to run. We’re really only 2 days in to it. If I had to guess I’d say it runs right in to next week and the averages should post some modest gains along the way, especially if the bear flag’s that are taking shape, continue. Remember that they do have a bearish bias, but they are an upward slanting parrellogram meaning prices should see modest gains.
I expected these to be bearishly biased consolidations and thus far we can see that in their price action, we can see that in the declining volume and the very weak dominant price/volume relationship, we can see that in 3C charts, or Dow Transports leading the Dow Industrials lower.
If we can get enough upside, they should offer some nice new short sale opportunities or the chance to lighten up on long positions if you’re so inclined.
Small Caps have a strong tendency to lead the major market averages and risk sentiment and they’ve already completed the full downside measured move from their own H&S top pattern. Remember that these H&S tops were not large and did not have large downside measured moves, but what their measured moves would and have done, is end the primary up trend or rally from last October’s low. The market’s price trend is in the midst of a change in character as was expected at the end of Q2 and as we moved in to Q3 and the second half of 2023.
The macro signals such as the yield curve suggest we’ll see the U.S. heading for an economic recession, perhaps later this year, but I’d say very likely by the first half of 2024. All things considered, oil is acting horribly. I also fully expect that the market averages will move back in to more substantial primary down trends, or bear markets, making lower lows than what were seen at October 2022. We’re actually pretty early in that process so I wouldn’t feel like you missed the boat when it comes to lightening up on long equity positions, or entering longer term trend short positions – or longs that can benefit from a bear market. I’m not seeing the typical signs of a market crash, but I wouldn’t rule one out as we move forward over the next 6 months or so. The signals for a crash can develop very quickly. I late 2019 and early 2020, I saw some of the strongest deflationary/crash signals I’ve ever seen about 5 weeks before the COVID crash of Q1 2020.
While I feel gold is stretched here and has some risk of catching down to real yields if its safe-haven premium is discounted, I do think gold will almost certainly benefit during a recession. Right now I do not like owning bonds, but I do think there will come a time, probably early next year, when they’ll look extremely attractive and the inverse correlation that stocks and yields have had for a couple of years, will flip back to a more normal correlation.
Overnight
In earnings since the close, Alphabet (GOOGL) is down -4.5%. The company beat tp and bottom line estimates, but Google disappointed on Google Cloud revenues, at $8.41 billion missed estimates of $8.6 billion. GOOGL’s operating margin of 28% missed estimates of 28.1%; and CapEx of $8.06 billion missed estimates of $8.81 billion.
On the other hand, Microsoft gained +4.25% in after hours after reporting earnings. the company beat top and bottom line estimates. What really grabbed the market’s attention though was revenue from Azure jumped 29% during the quarter, faster than the 26% consensus, and above the 27% last quarter. In short, it came down to AI/Cloud and MSFT impressed, while Alphabet disappointed.
S&P futures are down -0.15% and NASDAQ-100 futures are down -0.25%. Meanwhile, price weighted Dow futures are up between +0.15% and +0.2%.
The U.S. Dollar Index is down -0.05%
WTI Crude Oil futures are down -0.05% and consolidating bearishly following the day’s losses, despite a surprise Crude and Gasoline draw in API inventories after the close.
Gold futures are little changed (-0.05%).
Bitcoin futures are up +0.2%
The 2 and 10-year yields are both down around 1 basis point.
Looking ahead to Wednesday, participants will receive the following economic data:
- 7:00 ET: Weekly MBA Mortgage Index (prior -6.9%)
- 10:00 ET: September New Home Sales (prior 675,000)
- 10:30 ET: Weekly crude oil inventories (prior -4.49 mln)