Charts Update – Averages, Gold, Rates and FX
10:45 a.m. ET, February 14, 2020
While the market is relatively quiet, I’m rounding up the relevant charts to get a picture of where we are. I may add some as things develop.
First the 3C charts for the week… There haven’t been many interesting/divergent signals, until yesterday.
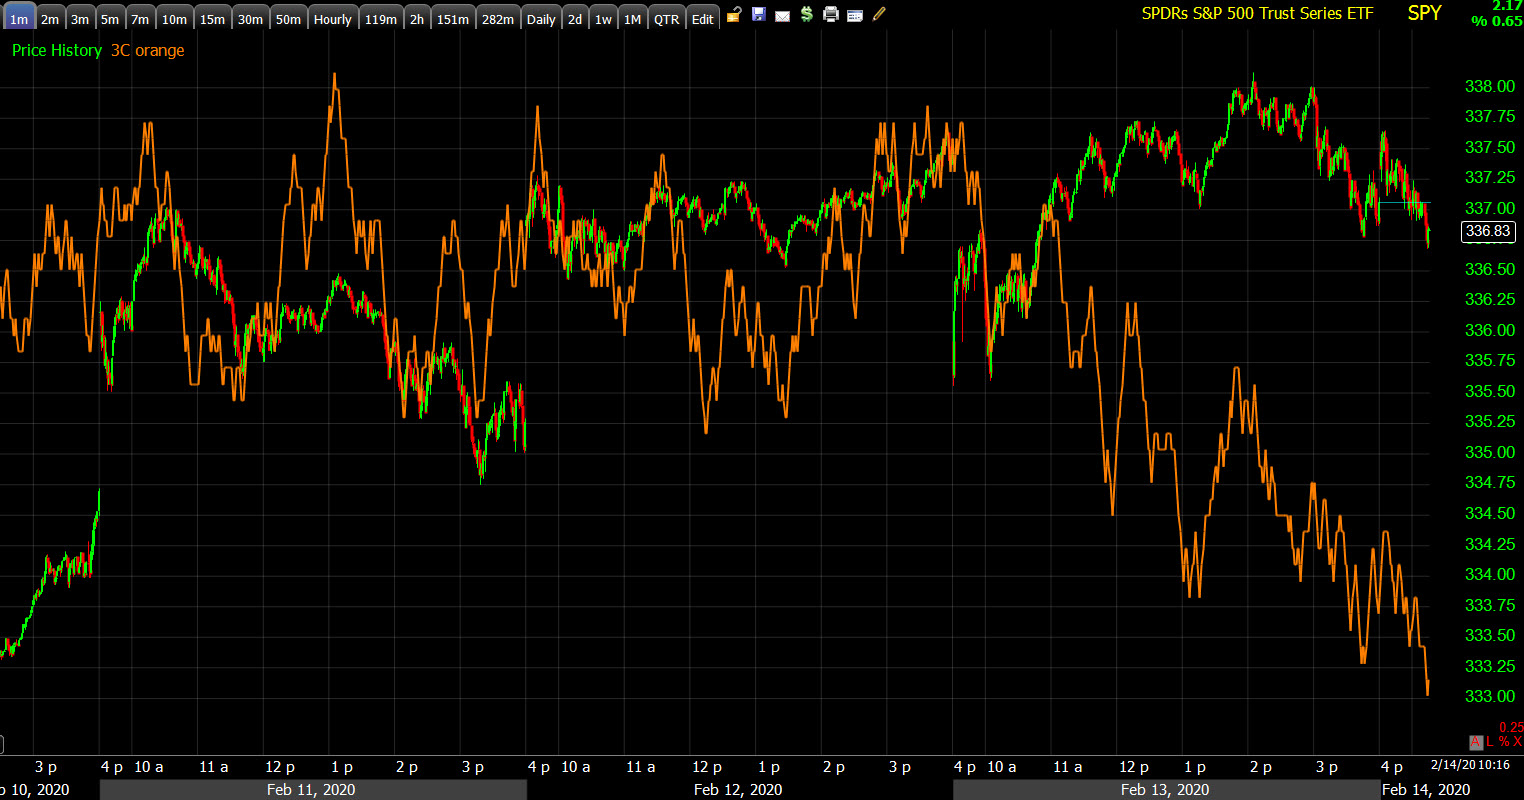 SPY (1m) negativity diverging and starting to lead lower in the footsteps of small caps.
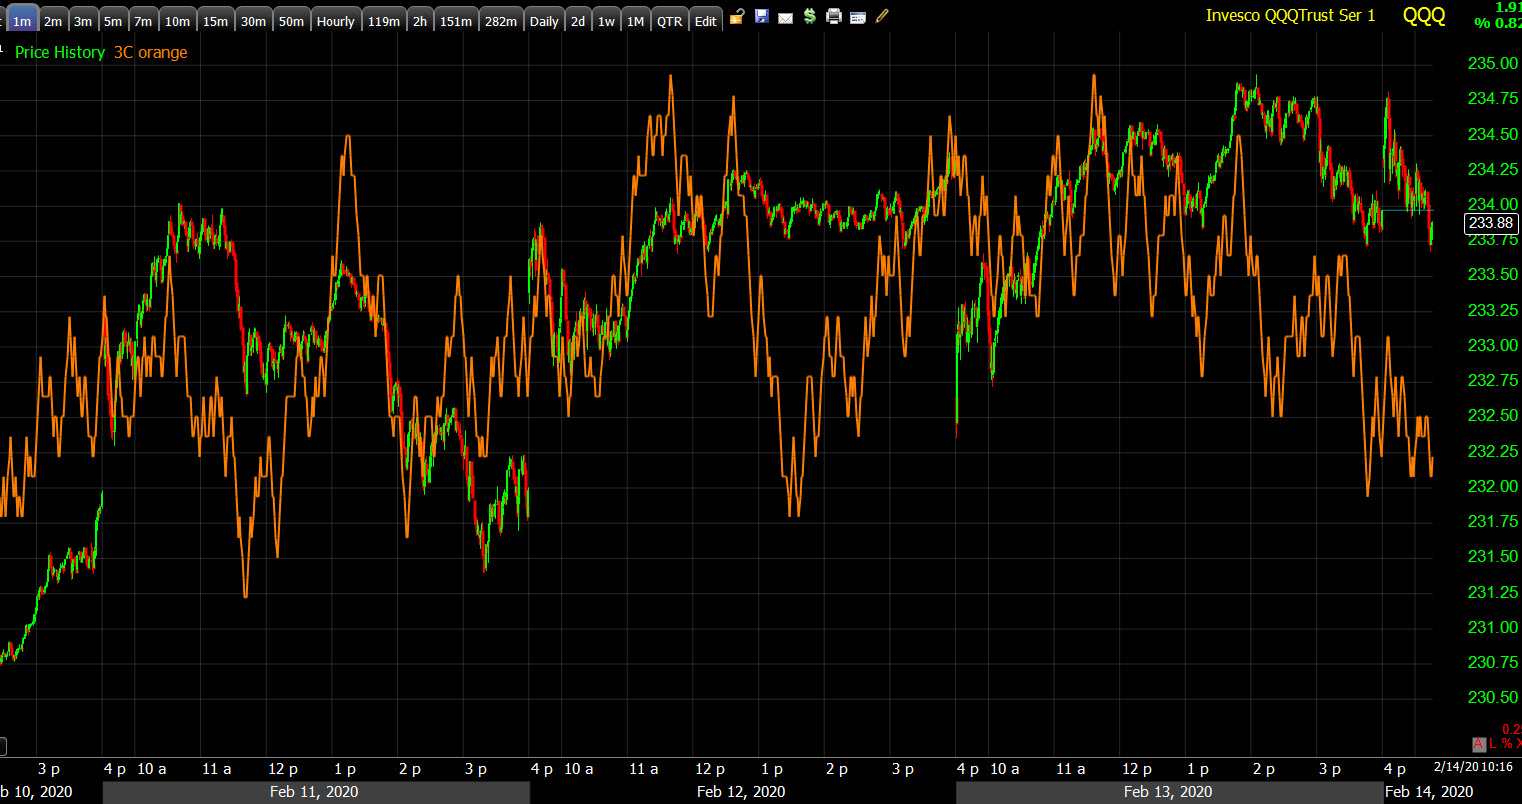 QQQ (1m) still pretty close to in line with price (confirming) as Technology/mega-cap Tech has been the recipient of inflows, likely including central bank (Repo) and buybacks.
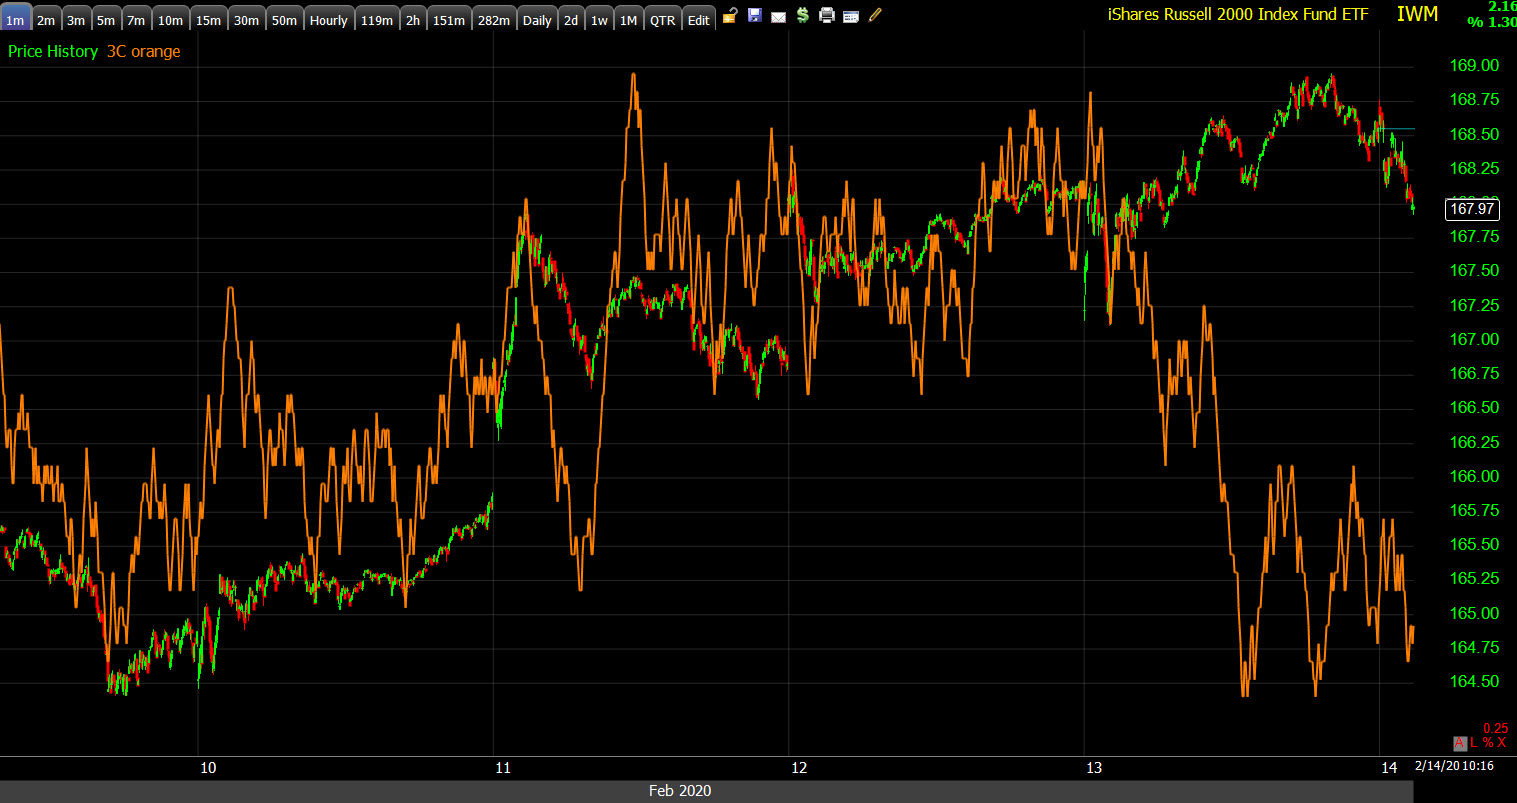 Small Caps/IWM (1m) is the most damning of the charts as small caps tend to lead the broader market.
The takeaway as usual, is small caps are showing weaker tone, but Tech is robust and will likely be the last sector to falter.
Yields are lower today, more defensive. I’m going to try to identify levels on the upside (near-term bullish for stocks) and downside (near-term bearish for stocks) for the 10-year yield.
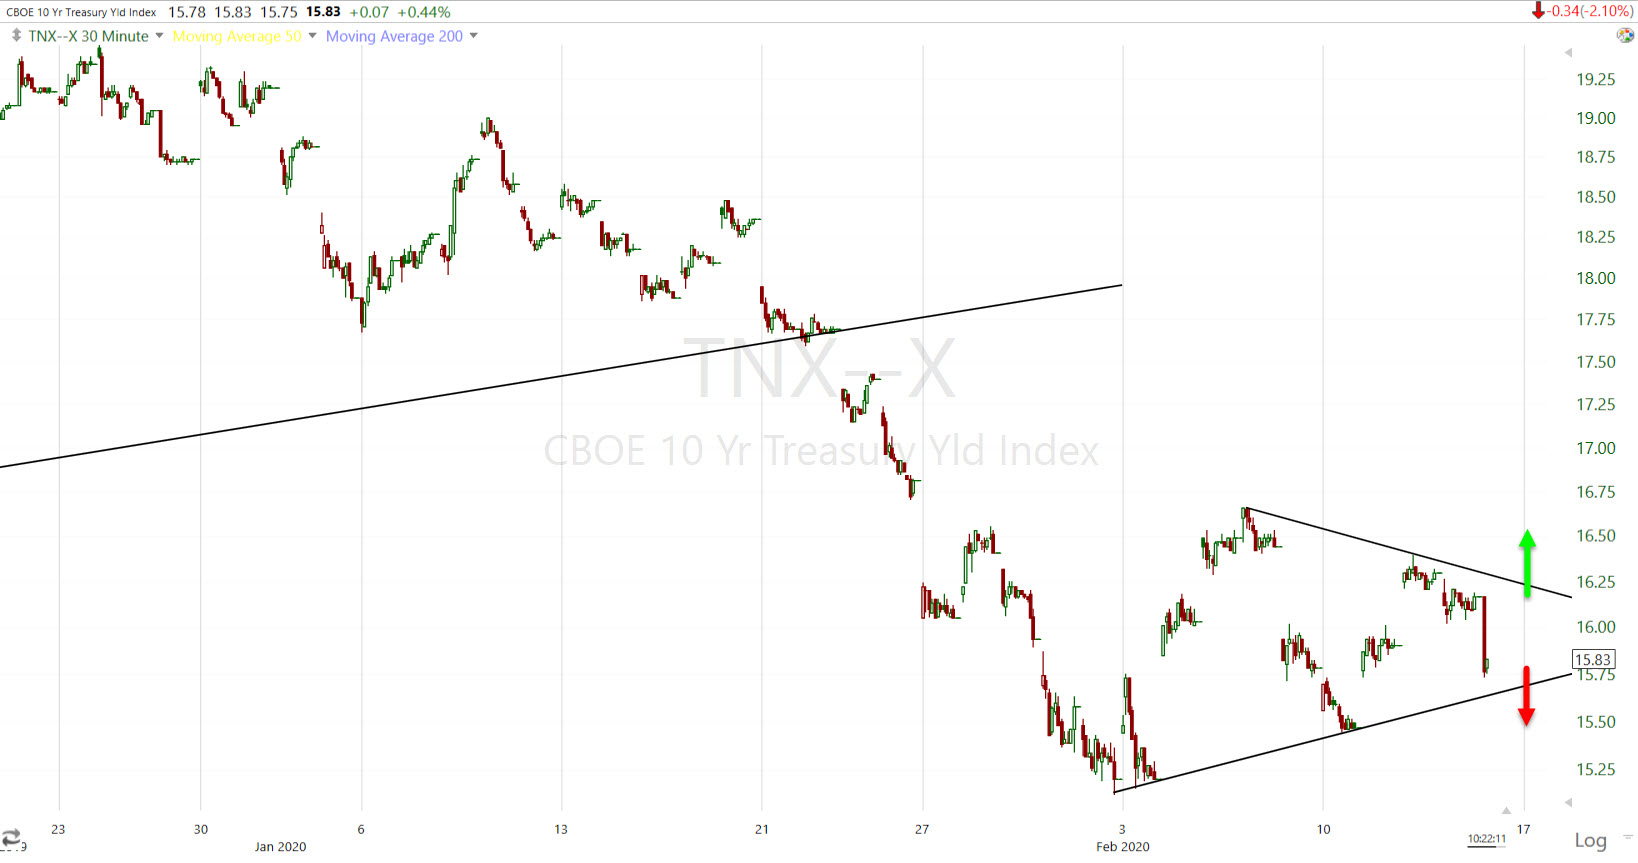 10-year yield (30m) like Crude and copper, this 30+ point plunge should not be dismissed as “so last week”, that’s a huge repricing from the bond market, tracking with currencies and commodities, along the lines of a downside economic shock. As stocks have rallied back to new highs the last 2 weeks, yields have consolidated in a symmetrical triangle. The consolidation has a bearish bias (for stocks) due to the preceding plunge.
The lower tend line is currently about 1.57%, a break below would be a bearish development for the market, a break above approximately 1.63% would be near-term supportive for stocks to continue their rally. I expect we’ll see a break lower, not higher. Remember the trend lines are diagonal so the levels will change slightly with time. However, the triangle is coming to an apex which suggests a move sooner than later. At this rate it comes to an apex next Thursday/Friday.
Gold has improved it’s technical position with a more defensive posture the last 2 days.
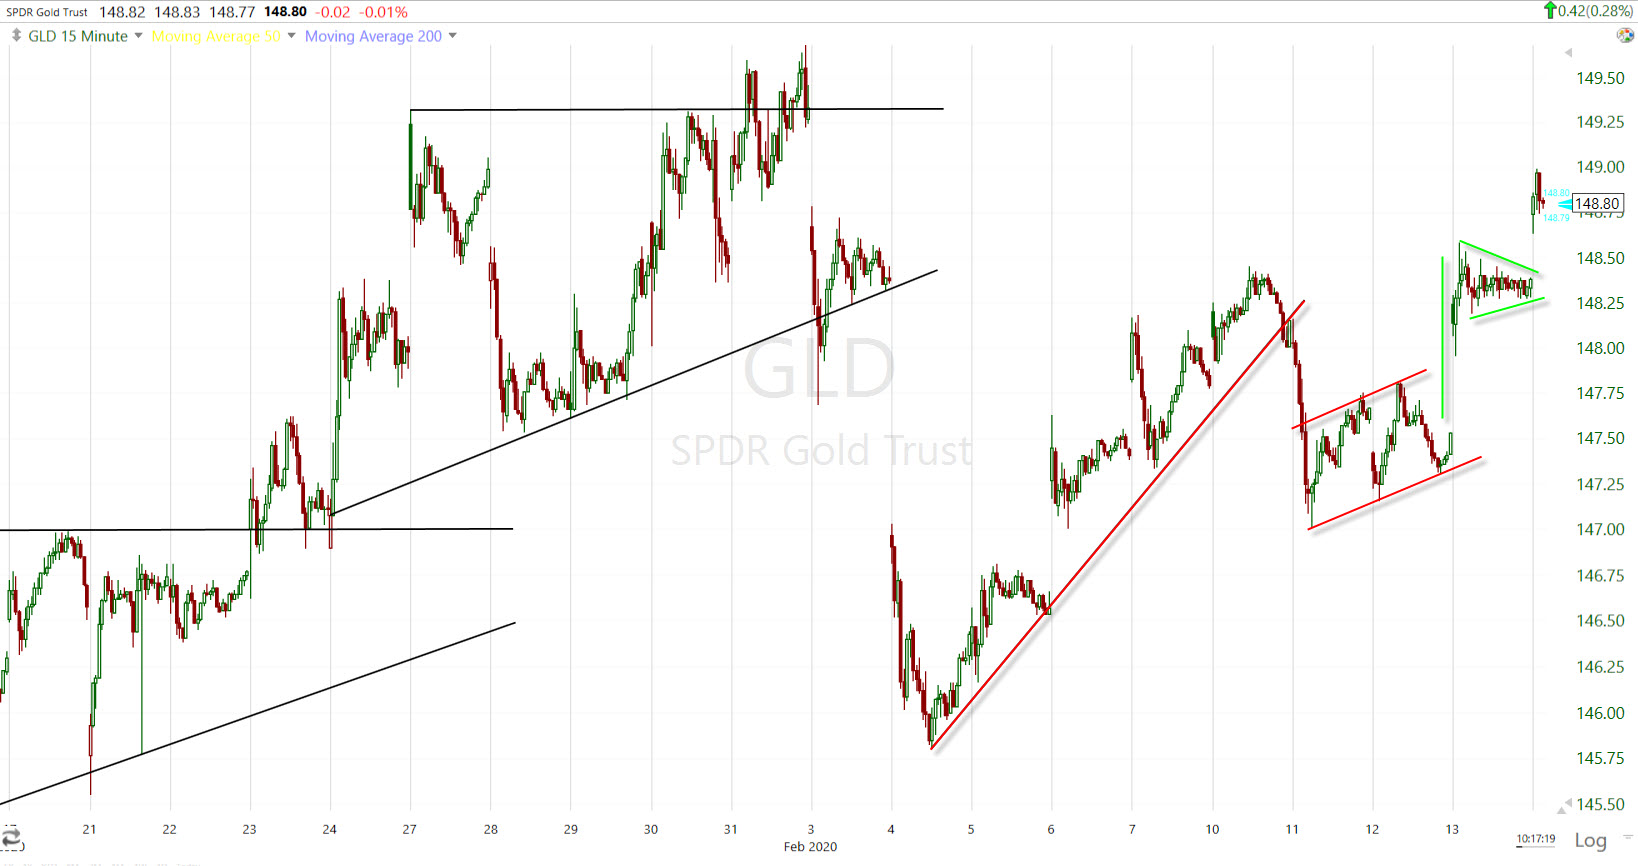 GLD (15m) is transitioning from a bearish short-term price pattern that suggested a test of recent lows, to bullish price. Key resistance is still around $149.50
Currencies… There are no hard and fast rules, but I included green and red arrows to indicate either bullish or bearish for stocks.
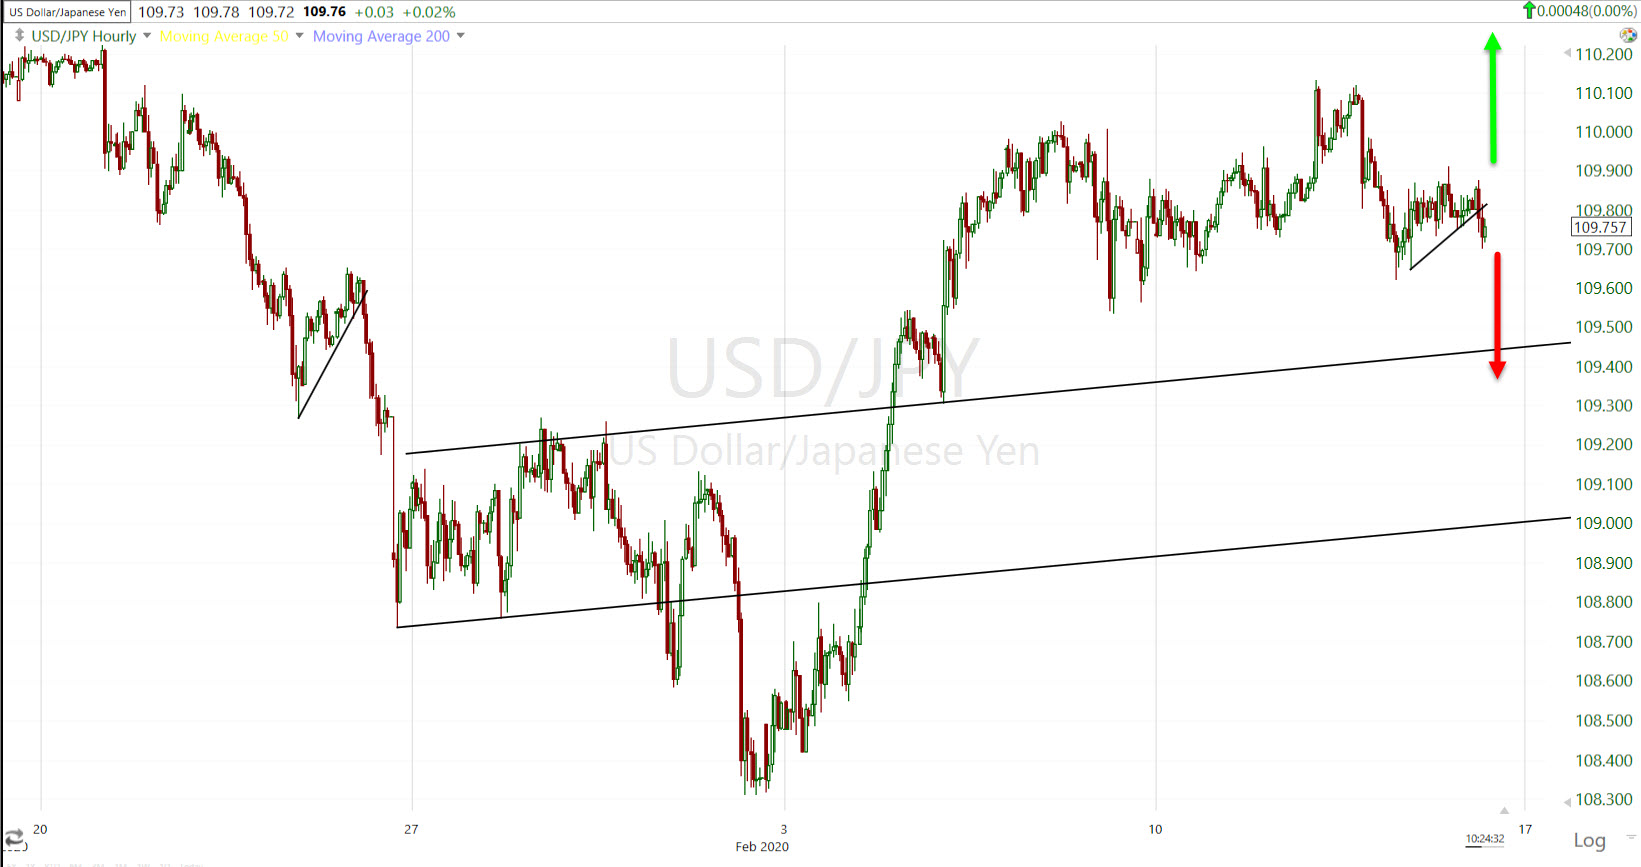 USD/JPY (60m) the small diagonal trend line is the trend from yesterday’s cash market. Generally speaking, the further down it moves, the more we’re seeing a flight to safety into the Yen, the further up it moves, the more risk-on the environment.
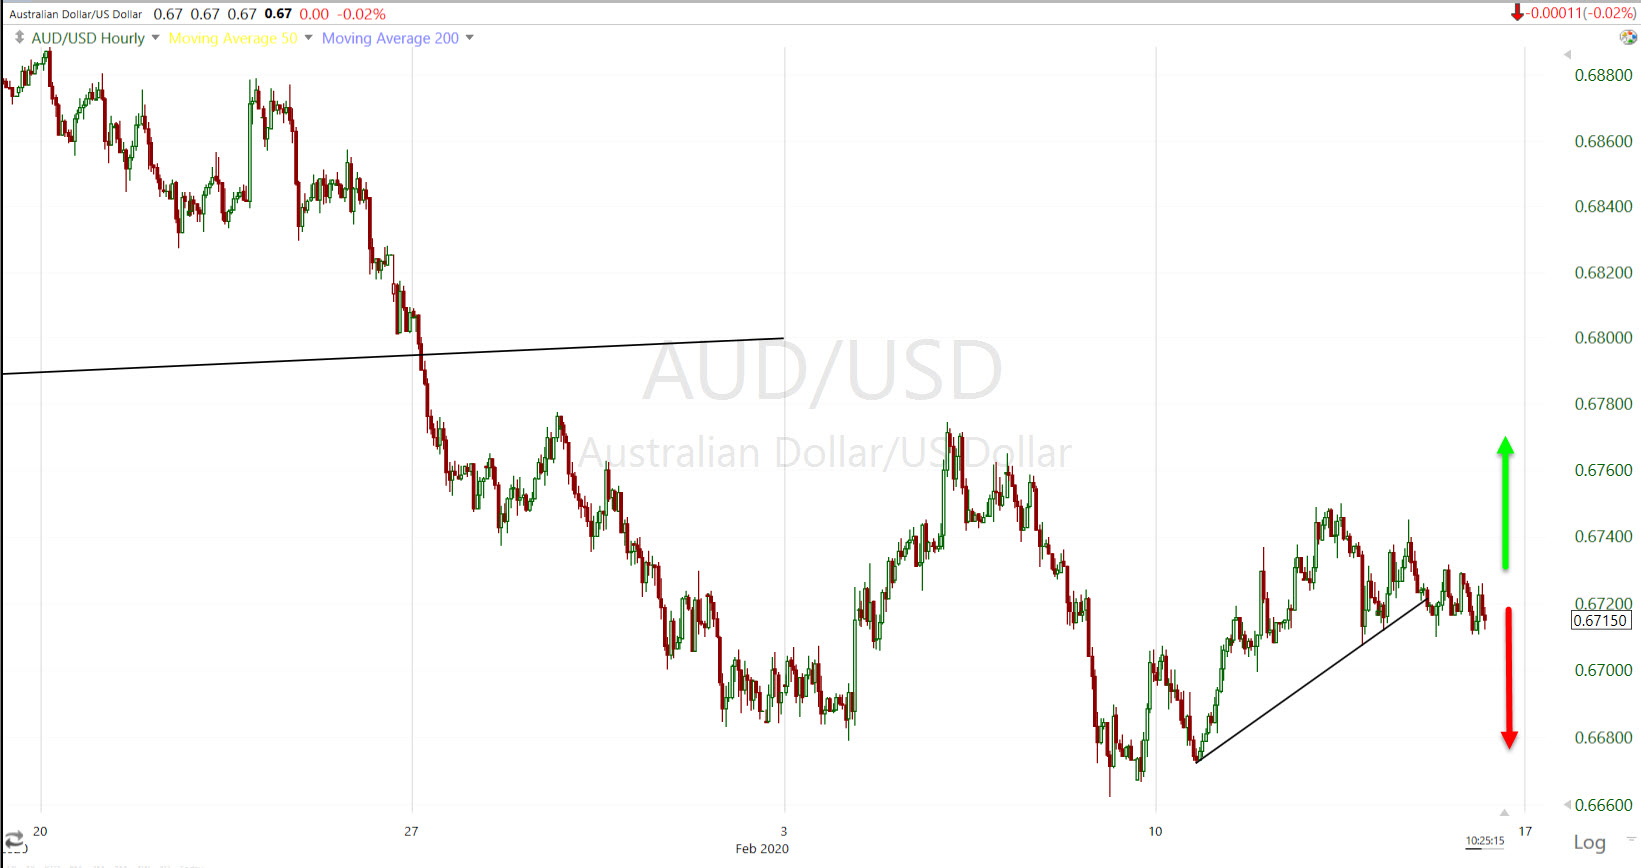 AUD/USD (60m) remember that the bounce from the 10th is from an 11 year low (very pessimistic view of Asia/Global economies). The trend line to the right is this week’s bounce/rally, which here is little more than corrective, certainly not risk-on.
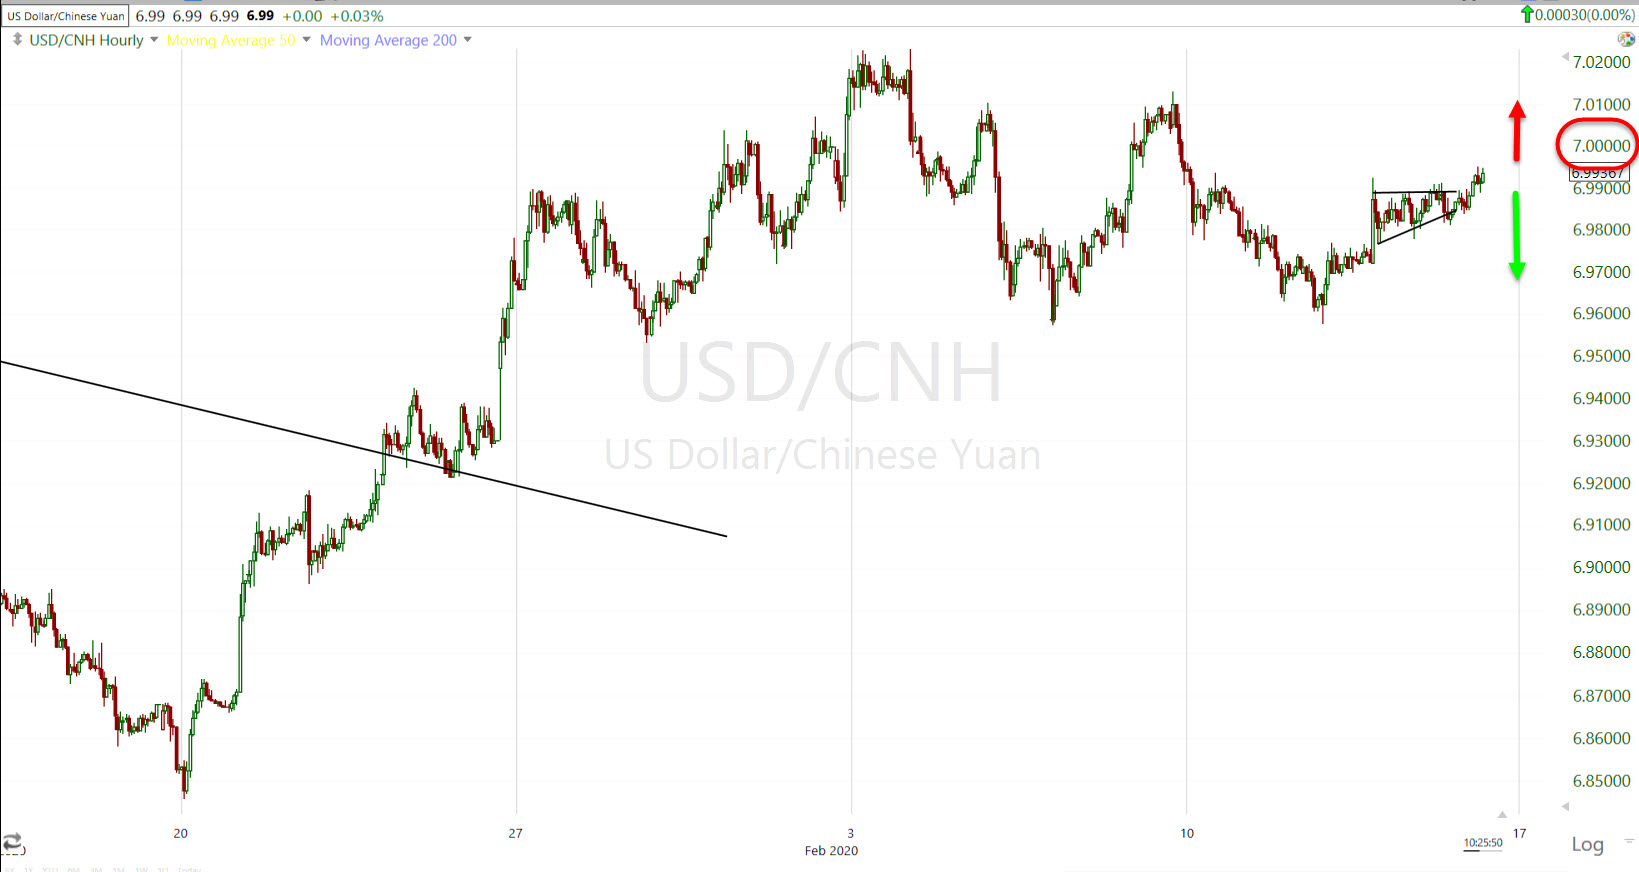
USD/CNH (60m) the $7 level is key and it has been defended several times the last 2 weeks, including by the PBoC.